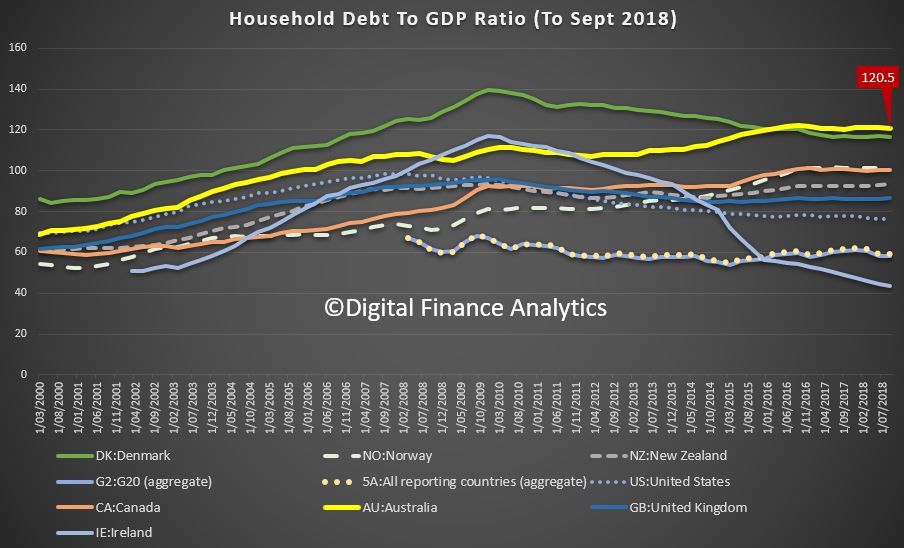
The World Bank issued a report on Global Waves of Debt. They warn that the global build-up in debt is unsustainable and the risks are rising. The debt bomb is still ticking….
Tag: Debt to GDP
Households Hold All The Wrong Records [Video]
We review the latest BIS stats on debt to GDP and debt servicing ratios. How is Australia tracking?
Households Hold All The Wrong Records…
The BIS have released their latest comparative stats for household debt to GDP and household debt servicing ratios. And congratulations Australia, we headed the list with the highest debt servicing ratios in their series, and the second highest debt to GDP. Both alarming.
Looking at the household debt to GDP ratios first, to June 2019, the average across advanced economies is 72.8. This gives a proxy for how easily households will be able to service and repay their loans, the lower the less risk there is.
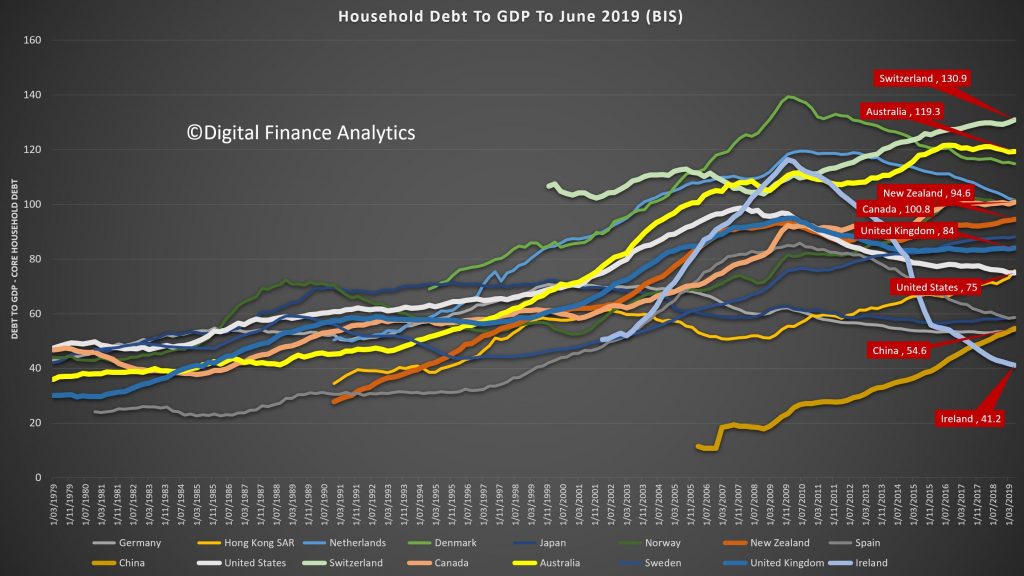
The United States is a little above the average at 75, the UK, at 84, Near Zealand stands at 94.6, similar to Canada, while Australia comes in at 119.3 and Switzerland leads the pack at 130.9.
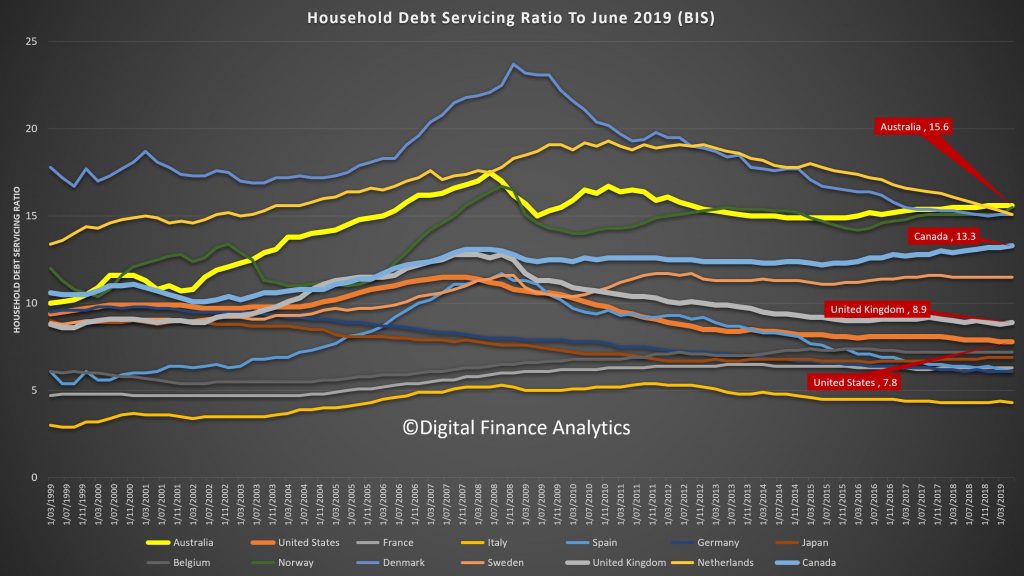
On the debt servicing ratios, we have taken first spot, at 15.6, with Canada at 13.3, the UK 8.9 and the US 7.8. The DSR is the average of income required to service a loan. So, the lower the better. Note this is across ALL households whether they borrow or not, so it takes account of the amount being repaid and the proportion borrowing. Note also the the Australian data has risen from 2014, despite rate cuts.
Conclusion, Australians is over leveraged, and mainly into property.
GDP Tanks – So What Next?
We look at the latest ABS national accounts data. We called it right! Household consumption continues to die as the savings ratio slides and GDP per capital sits at zero.
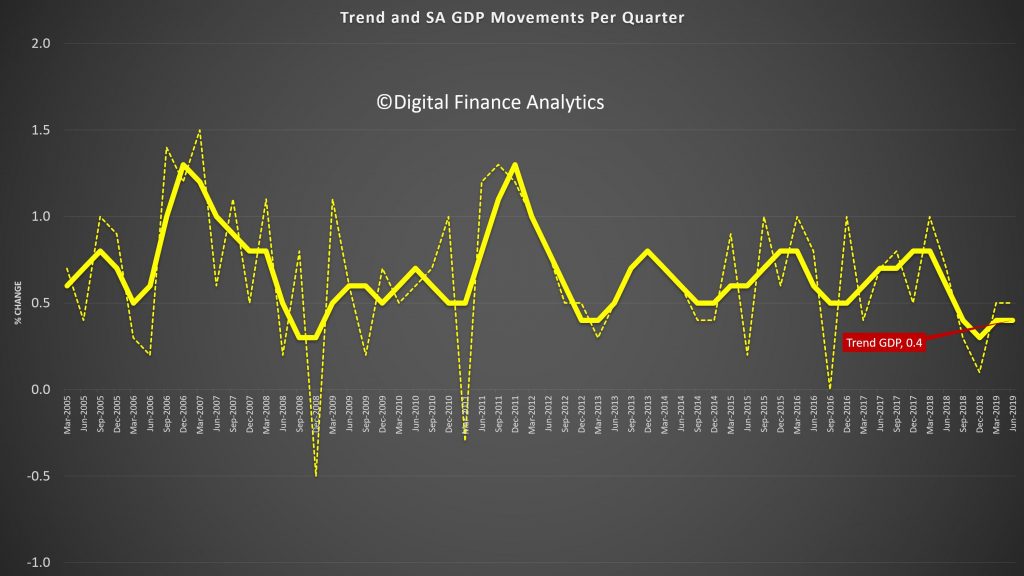
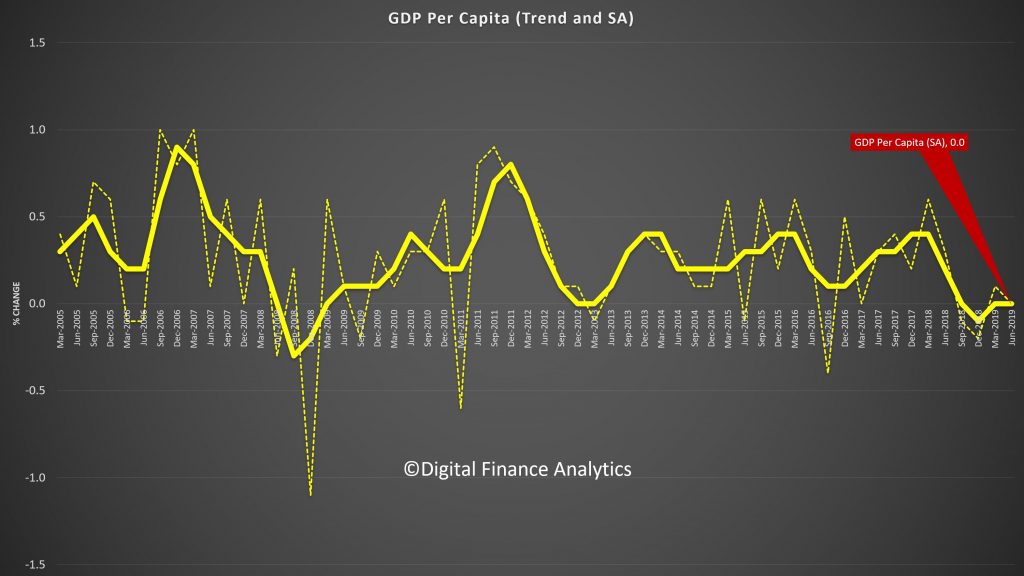
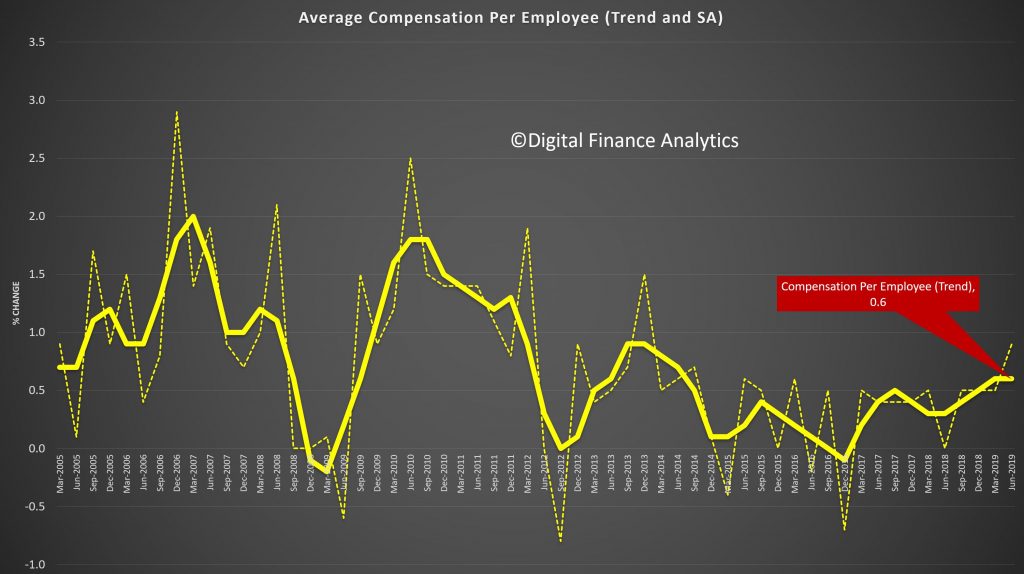
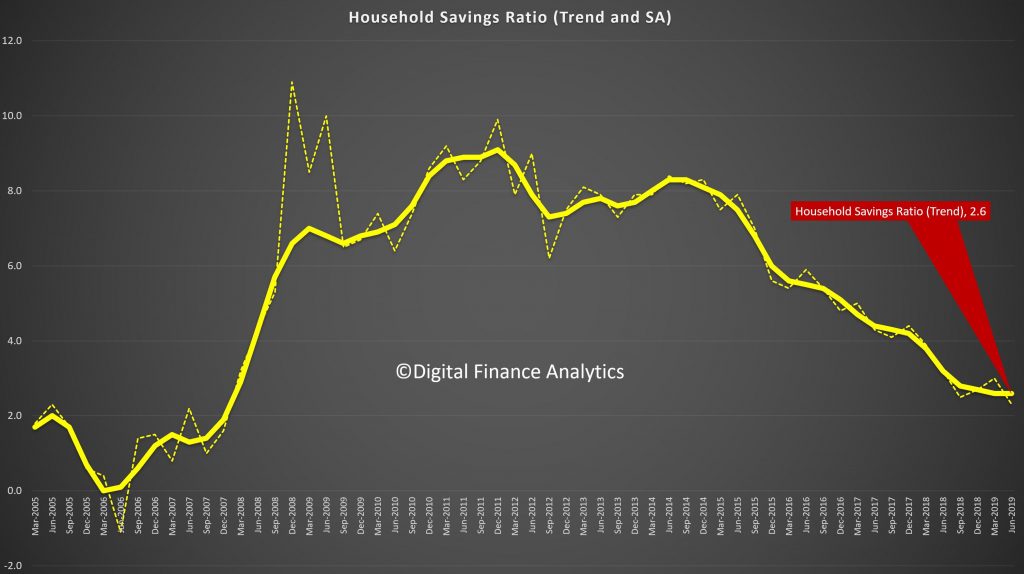
https://www.abs.gov.au/AUSSTATS/abs@.nsf/DetailsPage/5206.0Jun%202019?OpenDocument
IMF Finally Gets With The OZ Household Debt Problem
Until now the IMF has been warning in general terms of the risks from our housing sector, but in a recent working paper – Household Debt, Consumption, and Monetary Policy in Australia, they take the issue significantly further.

Within its 39 pages, the paper discusses the evolution of the household debt in Australia and finds that while higher-income and higher-wealth households tend to have higher debt, lower-income households may become more vulnerable to rising debt service over time.
Then, the paper analyzes the impact of a monetary policy shock on households’ current consumption and durable expenditures depending on the level of household debt. The results corroborate other work that households’ response to monetary policy shocks depends on their debt and income levels. In particular, households with higher debt tend to reduce their current consumption and durable expenditures more than other households in response to a contractionary monetary policy shocks. However, households with low debt may not respond to monetary policy shocks, as they hold more interest-earning assets.
And we should say at this point that IMF Working Papers describe research in progress by the author(s) and are published to elicit comments and to encourage debate. The views expressed in IMF Working Papers are those of the author(s) and do not necessarily represent the views of the IMF, its Executive Board, or IMF management.
Household debt in Australia has increased to comparatively high levels over the last three decades, a period during which housing prices also have risen rapidly. By end-September 2018, the ratio of household debt to household gross disposable income reached 189 percent, among the highest in advanced economies. High levels of household debt are widely considered to be risky, as they can amplify the impact of external and domestic shocks and, thereby, increase a country’s economic and financial vulnerabilities and pose risks to financial stability. In addition to amplifying financial and economic vulnerabilities, high household debt can also intensify the ongoing corrections in the housing market in Australia.
The macroeconomic impact of and the risks from household debt depend not only on the average debt level but also its distribution across households. Higher-income households might be at lower risk of debt default than lower-income households, for example. The latter might also be more likely to be finance-constrained in times of debt distress. From a monetary policy perspective, a key consideration is the extent to which household debt levels and distribution affect monetary policy transmission.
Household debt in Australia has been rising faster than household disposable income for the past three decades. As a result, the household debt ratio has risen to one of the highest levels among advanced economies.
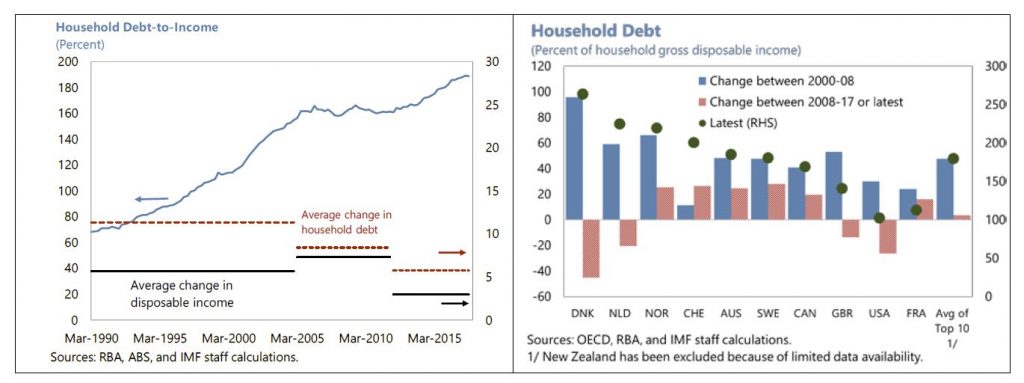
The housing boom has also played a significant role in the rapid accumulation of household debt. High housing demand due to income and population growth in conjunction with relatively inelastic supply have pushed up house prices, and expectations of future capital gains has encouraged investment demand for housing.
The interaction between the long-term upswing in housing prices and relatively easy mortgage financing has therefore led to the buildup of a high level of residential mortgage debt.
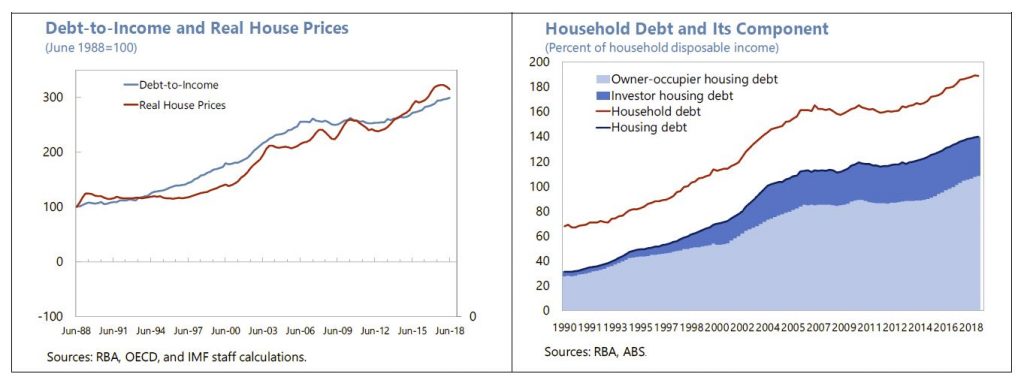
High household debt also reflects the preference for home ownership and housing investment in Australia. Housing debt at 140 percent of household disposable income accounted for about three-quarters of household debt outstanding as of September 2018, with owner-occupied housing debt accounting for a relatively stable share of about one half.
The rise in the share of investor housing debt since 2000 has also contributed to the fast increase in household debt, while other personal debt has remained broadly stable (one quarter of household debt outstanding) at about 46 percent of household disposable income since 2000.
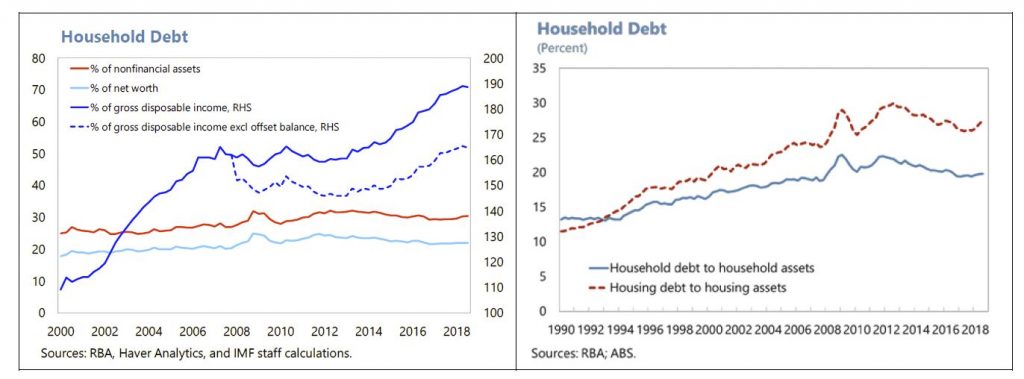
For financial stability, as well as monetary and macroprudential policies, it is not only the level of household debt that matters but also the speed of debt accumulation or leverage increases, the extent of leverage, and, more importantly, the distribution of debt.
The IMF uses old data, from the HILDA survey, which has been running with annual frequency from 2001 to 2016 to make their assessment – clearly the debt position has deteriorated since then, yet they show that debt has grow across the cohorts and segments. The RBA analysis has the same fundamental flaw.
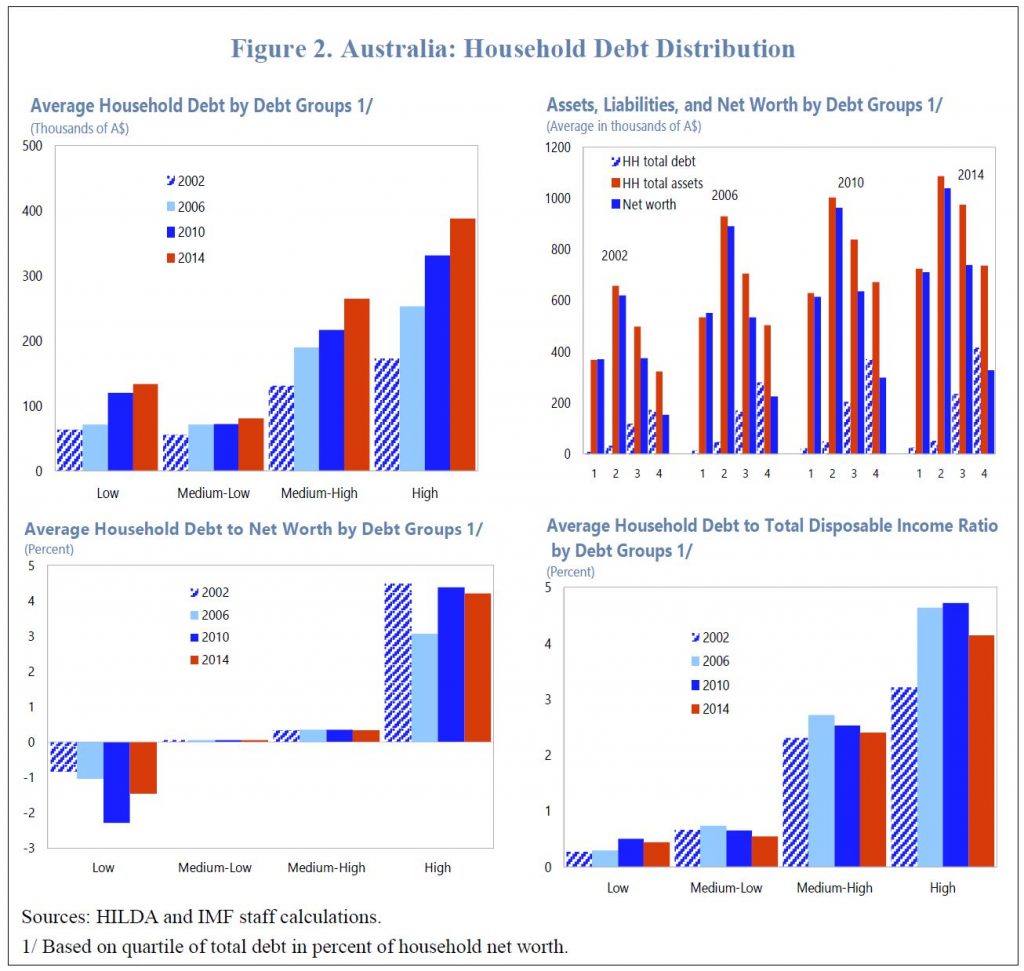
The paper finds that high debt exposure is more prevalent among higher-income and higher-wealth households. Nevertheless, the debt exposure of lower-income and more vulnerable households has also increased over time, and thereby more exposed to risks from rising debt service. The presence of over-indebted households at both low- and higher-income quintiles suggests that macro-financial risks have increased, suggesting a need for close monitoring.
Despite the high debt level, households’ debt service burden has remained manageable due to historical low mortgage interest rates and given that financial institutions assess mortgage serviceability for new mortgage lending with interest rate buffers above the effective variable rate applied for the term of the loans. However, downside risks on debt service capacity and consumption remain with regards to a sharp tightening of global financial conditions which could spill over to higher domestic interest rates.
The empirical analysis investigates the transmission of monetary policy shocks to the current consumption and durable expenditures of households with different debt-to-wealth ratios. With reasonable assumptions and using the large sample of households available in the HILDA survey for 2001-16, the results corroborate that households’ response to monetary policy shocks will vary, depending on both their debt and income levels.
In particular, the results suggest that households with high debt tend to reduce their current consumption and durable expenditures relatively more than other households in response to a contractionary monetary policy shocks. At the same time, households with low debt may not respond to monetary policy shocks, as they hold more interest-earning assets and thereby can smooth their consumption using the higher interest income, suggesting that for these households, the income effect dominates the intertemporal substitution effect.
The results of the analysis suggest that, with a larger share of high-debt households and given their high responsiveness to a monetary policy shock, it may take a smaller increase in the cash rate for the RBA to achieve its policy objectives, compared to past episodes of policy rate adjustments. It corroborates recent RBA research, which suggests that the level and the distribution of the household debt will likely alter monetary policy transmission, in other words, more bang for the buck. By responding gradually, the RBA can still meet its mandates.
The implications of higher household debt for monetary policy have also required that the RBA addresses this challenges in its communication. The results of the textual analysis show that the RBA’s communication has increasingly focused on the impact of household debt on monetary conditions and financial stability over the past decade, consistent with the rise in debt-to-income ratios. Markets have also started to take into account household debt in their assessment of monetary policy and market expectation analysis. Therefore, continuing with a transparent and strengthened communication strategy on issues related to the household debt and household consumption will further improve predictability and efficiency of monetary policy in Australia.
My take is the household debt burden is larger, and more exposed to potential risks than many accept. Nothing new perhaps, but the IMF highlighting the issues is one more piece of the too-high debt narrative!
And according to the AFR, in an exclusive interview, the International Monetary Fund’s lead economist for Australia, Thomas Helbling said Australia’s housing market contraction is worse than first thought, leaving the economy in what he called a “delicate situation” that boosts the need for faster infrastructure spending and even potential interest rate cuts.
Australia’s housing market contraction is worse than first thought!
Just How Much Trouble Are We In?
We look at the latest data from the BIS on GDP to Debt and Servicing ratios. Where does Australia stand? Data on New Zealand is also included.
