DFA Household Finance Confidence Index For July 2015 Shows Investors Have It

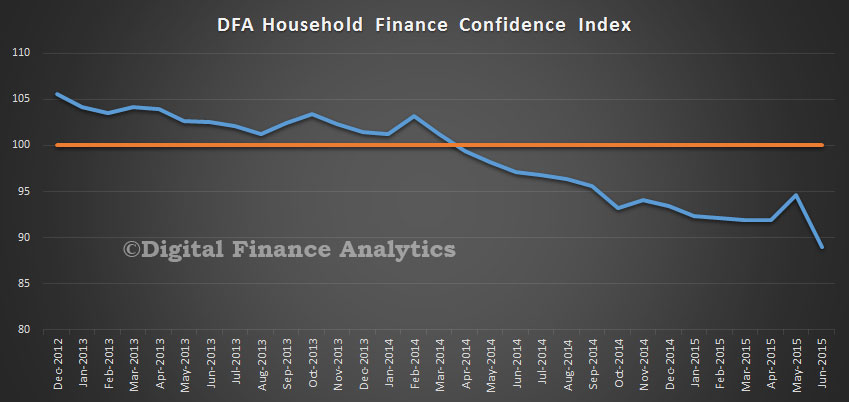
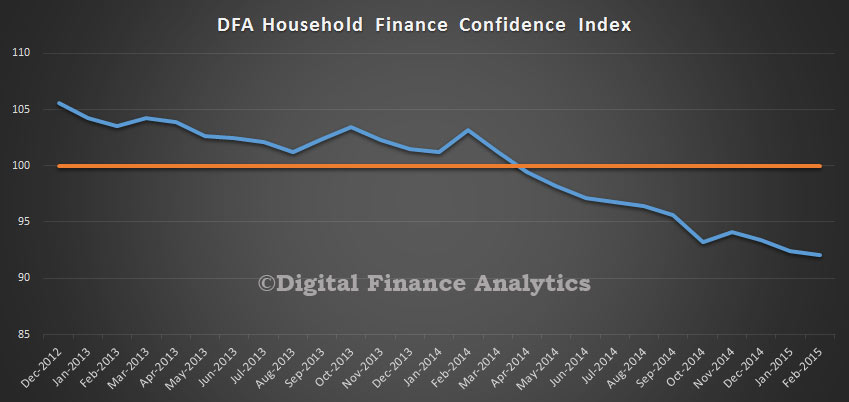
We released the latest DFA Household Finance Confidence today, incorporating results from our household surveys to end July. The overall index recovered a little from its all time low last month, rising to 91. This is still below a neutral setting. The index has been below water since April 2014.

FCI-July-2015This month we pulled out data from the 26,000 survey responses, segmented by our master property categories. We found that households who are property inactive (those renting, living with parents or friends, or homeless) consistently registered a lower score, at 87 this month, and we see a falling rating since we started this analysis in 2012. On the other hand, those households with investment property consistently rated higher, because of the wealth effects of rising property values, and because their incomes were more stable. Owner occupied households fell between the two extremes, though we noted a kick-up this month, thanks to the prospect of potentially cheaper loans ahead. We also see a subtle fall in the confidence of property investors, who are reacting to recent hikes in interest rates for investment properties. Could this be the first sign of an investment sector slow-down?

FCI-Segment-July-2015

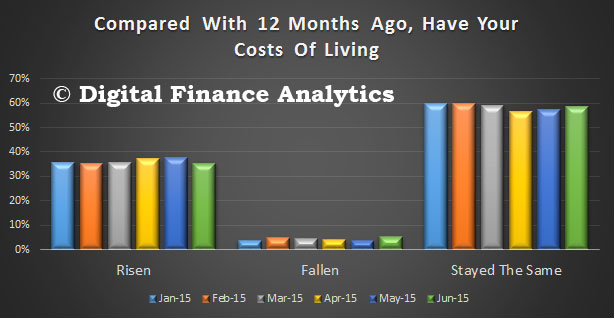
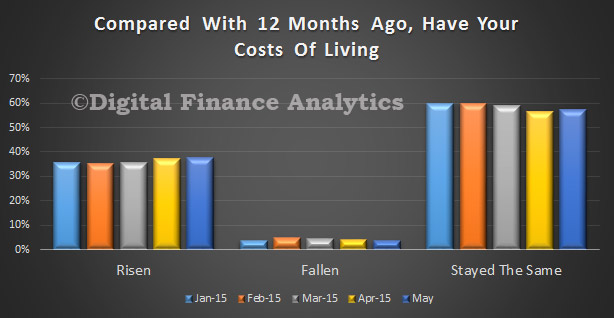
Now turning to the All Australia aggregate data, we see that costs of living continue to worry households, with 38% of households saying their costs were rising, up 3% on last month, and a similar fall in those who said there was no change to their costs. Households identified costs relating to council rates, food, fuel and overseas purchases as the main reasons for the rise. Those families burdened with child care costs and health related expenditure also suffered significant increases.

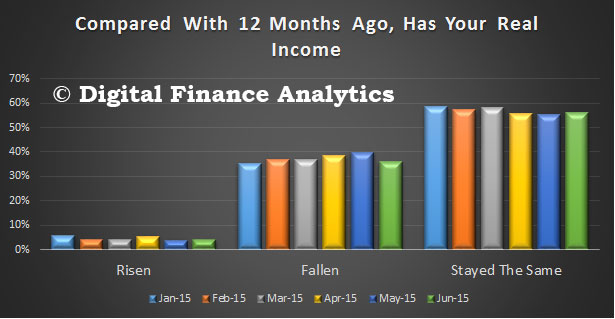
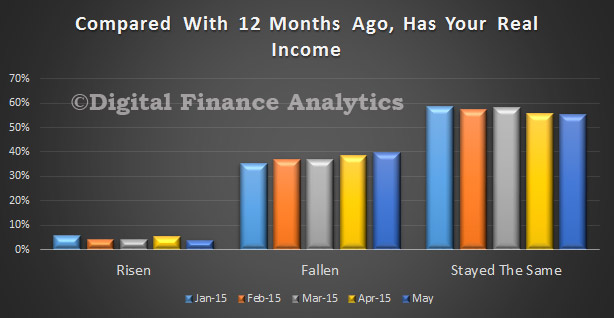
FCI-Costs-July-2015Turning to income, 4% more households this month said their income was falling in real terms, and 40% of households fall into this category. As well as wages being static or falling, households also saw falls in the interest paid on bank deposits. Only 4% said their incomes had risen, these tended to be households receiving dividend income from stocks. Just over 55% of households said their incomes had not changes (though as highlighted above, their costs had), so many are feeling the pinch.

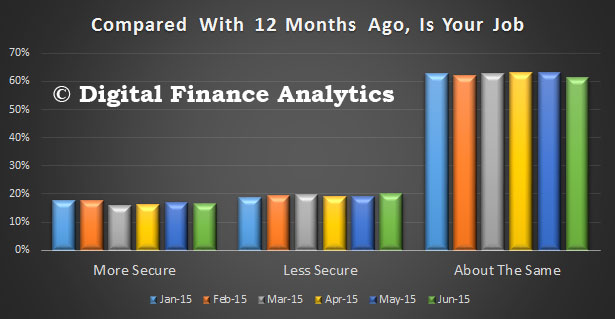
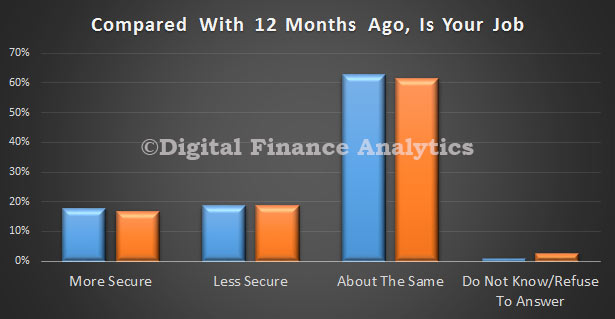
FCI-Income-July-2015Next, looking at job security, those households who felt more secure in their jobs fell by nearly 1%, to 16% of households. More than 62% of households felt no difference in their level of job security. There were significant state and industry variations however, with those in WA and SA the most concerned, and registering a fall in security, whilst NSW and VIC both registered higher rates of job security.

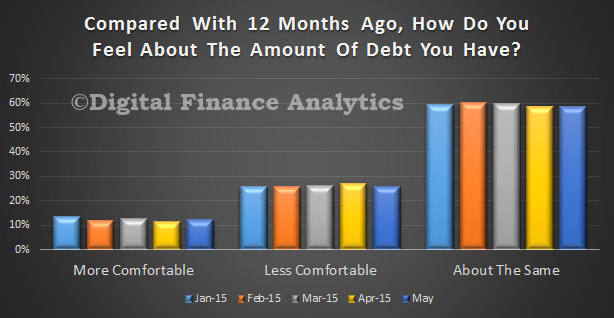
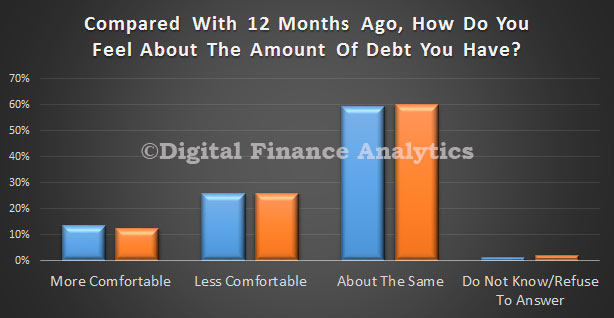
FCI-Job-Security-July-2015Looking at household debt (which is very high at the moment), 13% of households were more comfortable at their levels of debt, whilst 26% were less comfortable, and 60% were as comfortable as last time. Low interest rates are allowing households to manage high debt, but of course they are highly leveraged, and would be impacted if interest rates were to rise. Most households expect rates to remain low for the next couple of years.

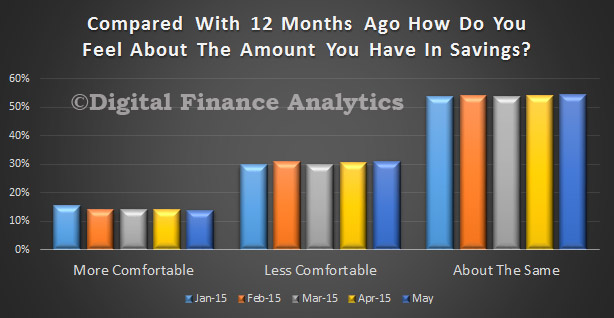
FCI-Debt-July-2015Turning to savings, 14% of households were more comfortable with the savings they had, little changed from last month, whilst 54% were as comfortable as last month. Households commented on the difficulty of finding a good home for their savings, in the current low interest rate environment, and were concerned that adjusted returns were worth next to nothing. We also noted an increase in those households unable to get access to $2,000 within a week in an emergency. Around 15% of households are in this category, and the majority are those who are property inactive.

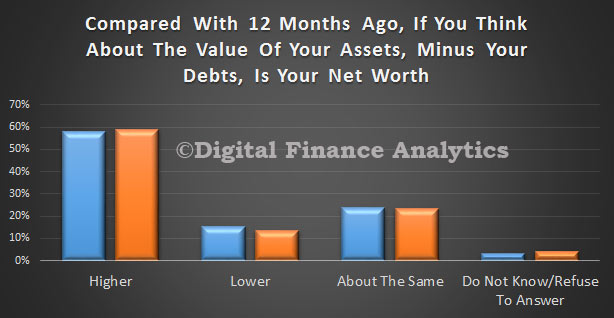
FCI-Savings-July-2015Finally, we look at net worth. Those households in the eastern states with property are feeling better off thanks to continued rises in property prices. Those with investment properties were feeling particularly smug. However, those in WA, NT and QLD were more more concerned about the trajectory of house prices, and saw their net worth falling – 62% of households saw their net worth rise, up 2%, whilst 14% saw it fall.

FCI-Net-Assets-July-2015So overall, slowing wage growth and rising costs of living are counterpointed by rises in property prices, and low interest rates. However, bearing in mind that rates are unusually low and house price growth unusually high (for some), we do not see the fundamentals in place for a significant boost to household financial confidence any time soon. Therefore we expect households to spend conservatively, continue to save, and seek higher investment returns from higher risk asset classes.

DFA Household Finance Confidence Index Falls In June To New Low

The latest edition of the DFA Household Finance Confidence Index was released today. The latest data to end June shows there was a fall over the last month, the score moved from 94.6 to 89.0, the lowest score since the index started in 2012. A number of factors pressed in on households, including the international financial situation, flat or falling real incomes, concerns about local job security, and concerns about security.

FCI-Index-June2015The results are derived from our household surveys, averaged across Australia. We have 26,000 households in our sample at any one time. We include detailed questions covering various aspects of a household’s financial footprint. The index measures how households are feeling about their financial health.

To calculate the index we ask questions which cover a number of different dimensions. We start by asking households how confident they are feeling about their job security, whether their real income has risen or fallen in the past year, their view on their costs of living over the same period, whether they have increased their loans and other outstanding debts including credit cards and whether they are saving more than last year. Finally we ask about their overall change in net worth over the past 12 months – by net worth we mean net assets less outstanding debts.

Looking at the drivers of the index, this month, overall job security fell, with those feeling more secure than a year ago at 16.4%, down 0.5%, whilst those who feeling less secure rose by 0.82% to 19.8%. Local employment conditions are still worrying many, overlaid by the international situations in Europe and China.

FCI-Jobs-June2015Looking at costs of living, those who said their costs of living rose in the past year was at 35.3%, down by 2.3%, whilst 58% said costs were similar, up 1.19%. Many commented on the costs of child care, which appears to be a major household budget issue.

FCI-Costs-June2015About 5% said their incomes had risen in real terms in the last year, whilst 36% said their incomes had fallen, which is up slightly from last month. Many have not been able to benefit from a cost of living pay rise, and overtime opportunities are limited.

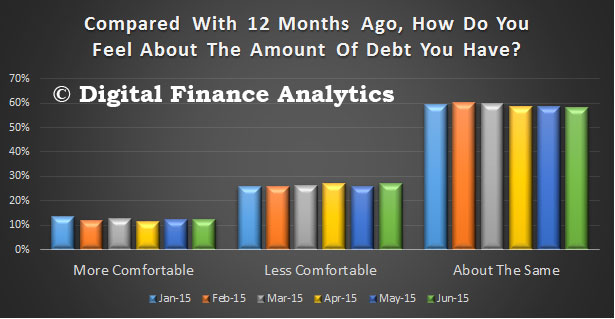
FCI-Income-June2015Lower interest rates have impacted households attitudes to debt. About 12.4% of households were more comfortable, thanks to these lower rates, although the proportion who felt uncomfortable with their level of debts rose 1.2% to 27%. Those with a more recent and large mortgage were the most uncomfortable. Around 58% of households were as comfortable as 12 months ago. We noted that younger households with mortgages were the most concerned, whilst older households with lower debt levels were more confident.

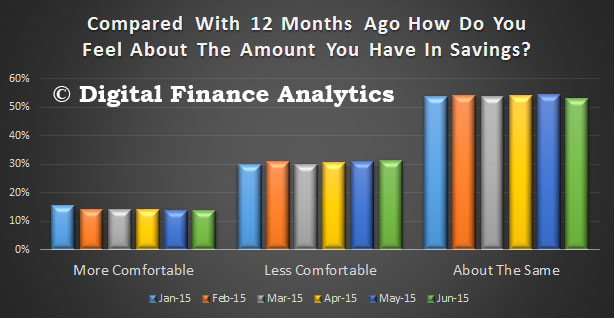
FCI-Debt-June2015Turning to savings, 13.8% of households were more comfortable with their level of savings compared with twelve months ago, whilst 31% were less comfortable, up 0.4%. The main reason for the discomfort can be traced to the lower returns  on savings. Many are finding that their income is being squeezed. This is especially true among older household groups, especially those with higher health related expenses.

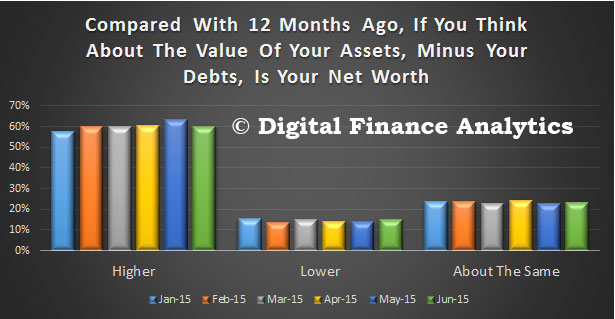
FCI-Savings-June2015Finally, looking at overall net worth, 60% of households think their worth is higher than 12 months ago, though this fell by 3% in the month, thanks to recent stock market falls. In some states, property prices are also down, but not in Sydney and Melbourne. Those in rented accommodation or in financial stress saw their worth fall, (15%) whilst about 23% saw no change, up 0.6%. Households in rented accommodation or in receipt of Centrelink support were generally less comfortable.

FCI-NetWorth-June2015So overall, we see the continuing trend of lower income, higher costs, those households with property and shares enjoying offsetting net worth growth, but others not participating to the same extent. The budget has had little longer term impact, and the RBA rate cut has also not changed the overall trajectory of the index. Households are wary, and will remain cautious in the months ahead.

Note that this data is averaged across the states, though we note some significant differences between WA (overall confidence lower) and NSW (overall confidence higher), thanks mainly to differential movements in house prices and employment prospects. We do not published the detailed segment and state based analysis in this post. This detail is available to our paying clients!

DFA Household Finance Confidence Index Up A Bit In May

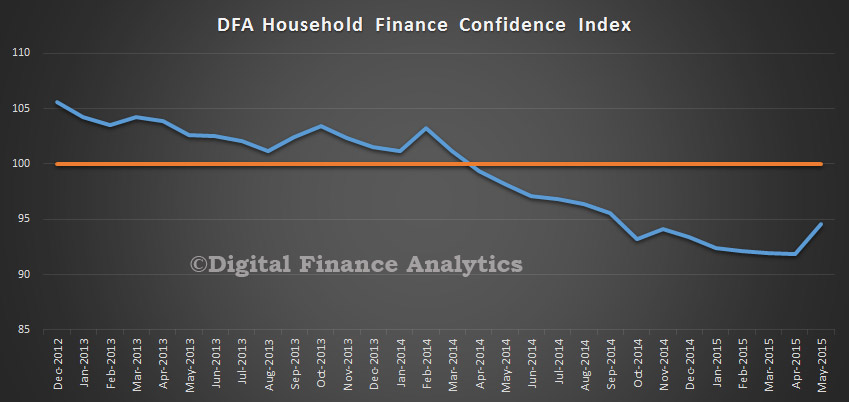
The latest edition of the DFA Household Finance Confidence Index was released today. The latest data to end May shows there was an improvement over the last month, partly in response to the budget and the RBA rate cut, but the overall score is still well below a neutral setting. The score moved from 91.87 to 94.6.

FCIIndexMay2015 The results are derived from our household surveys, averaged across Australia. We have 26,000 households in our sample at any one time. We include detailed questions covering various aspects of a household’s financial footprint. The index measures how households are feeling about their financial health.

To calculate the index we ask questions which cover a number of different dimensions. We start by asking households how confident they are feeling about their job security, whether their real income has risen or fallen in the past year, their view on their costs of living over the same period, whether they have increased their loans and other outstanding debts including credit cards and whether they are saving more than last year. Finally we ask about their overall change in net worth over the past 12 months – by net worth we mean net assets less outstanding debts.

Looking at the drivers of the index, for all Australia, we see that costs of living are rising, with 37.64% of households seeing a rise in the last 12 months (up from 37.2%), and more than half seeing no improvement in costs of living. Elements which are driving this include fuel costs, rising council charges and costs of imported goods.

FCICostsMay2015Turning to income 3.8% of households have seen a real increase in the last year, compared with 5.5% last month. 39.9% of households have experienced a fall, compared with 38.4% last month, and 55.5% of households stayed the same compared with 55.8% last month.

FCIIncomeMay2015Looking at household debt, 12.3% of households are comfortable with their debt levels, up from 11.4% last month. Households who are uncomfortable with their debt levels fell to 25.8% from 27.2% last month. The change was directly linked to the RBA Cash Rate cut in May, and an expectation that rates will fall further. Those with high credit card debts were significantly more likely to be is the less comfortable category. Those households with interest only mortgages were disproportionally more comfortable than those with a p&i loan.

FCIDebtMay2015Turning to savings, those who are more comfortable fell from 13.9% to 13.7%. We saw a rise in households who were less comfortable (from 30.4% to 30.9%) and more than half saw no change. One element of note was that households are tapping to their savings to fill the gap left by slow income growth, against costs and spending. Low deposit rates are encouraging some households to spend some of their savings.

FCISavingsMay2015On job security, there was a slight rise in those feeling more comfortable (from 16.2% to 16.8%). Interestingly those employment in small businesses saw a significantly larger positive swing, offset by lower levels of security in larger companies. The worst deterioration were in WA and QLD.

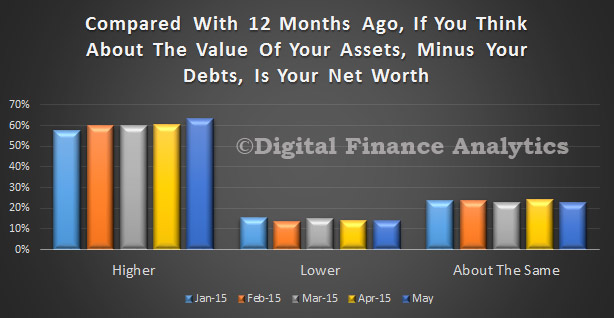
FCIJobsMay201563.1% of households saw their net worth rising, up from 60.5% last month, thanks primarily to further rises in real estate (especially in Sydney and Melbourne) and shares. A slightly smaller proportion of households saw their net worth falling (down from 14.2% to 13.86%), the majority of those households who reported a fall were not property active, living in rented accommodation, and more reliant on Centrelink support than average. We also note a skew to rises in net worth in the main urban centres on the east coast, and higher than average income. Households in WA scored the highest fall this month.

FCINetWorthMay2015So overall, we see the continuing trend of lower income, higher costs, those households with property and shares enjoying offsetting net worth growth, but others not participating to the same extent. The budget may have moved the dial a bit, but the RBA rate cut had more impact.

Note that this data is averaged across the states, though we note some significant differences between WA (overall confidence lower) and NSW (overall confidence higher), thanks mainly to differential movements in house prices and employment prospects. We do not published the detailed segment and state based analysis in this post. This detail is available to our paying clients!

DFA Household Finance Confidence Index Falls In March

We have released the latest edition of the DFA Household Finance Confidence Index, the results of are derived from our household surveys, averaged across Australia. We have 26,000 households in our sample at any one time. We include detailed questions covering various aspects of a household’s financial footprint. The index measures how households are feeling about their financial health.

To calculate the index we ask questions which cover a number of different dimensions. We start by asking households how confident they are feeling about their job security, whether their real income has risen or fallen in the past year, their view on their costs of living over the same period, whether they have increased their loans and other outstanding debts including credit cards and whether they are saving more than last year. Finally we ask about their overall change in net worth over the past 12 months – by net worth we mean net assets less outstanding debts.

The overall index fell from 92.1 to 91.97 in March, which continues the overall declining trend since February 2014.

FCIMar2015

Looking at the elements within the index, nearly 60 percent of households are enjoying a growth in their net worth, mainly thanks to further rises in house prices and positive stock market movements. On the other hand, there was a rise of 1.5 percent in those who have seen their net worth fall, these are households who predominately do not own property.

FCINetWorthMar2015

There were small movements in the costs of living data, with school fees and child care being two elements which have hit some households hard, though offset by falls in the costs of fuel. We also see the impact of falling exchange rates on overseas purchases, especially from the US. Finally, rentals are increasing faster than incomes for some households, especially in cities on the east coast.

FCICostsMar2015

Household real incomes are relatively static, though there is little evidence of rising income. Less than 4 percent of households recorded a rise in real terms.

FCIncomeMar2015

Some households are a little more comfortable with their level of debt, this is directly linked to the fall in RBA rates in February. However, there was also a rise in those households who were concerned about the debts they owed, with a rise of 0.57 percent. On average females were more concerned than males, and older households more worried than younger ones.

FCIDebtMar2015

There was a small rise in households who were more comfortable with their savings position, but more are less comfortable, and this is directly linked to the current low interest rates offered for deposits, and the prospect of even lower rates, and the quest for higher yield elsewhere looking ahead. Females were significantly more concerned than males.

FCISavingsMar2015

Finally, looking at job security, there was a significant rise in those households who are concerned, with a drop in those who felt more secure than last year by 1.7 percent and a rise in those who fell less secure. That said, more than 60 percent registered as about the same. We noted some state variations, with those in WA significantly more concerned than those in NSW.

FCIJobsMar2015 Note that the detailed state by state and segmented data is not publicly released. We will update the index again in a months time.


DFA Household Finance Confidence Index Fell In February

Using data from our household surveys, we have updated our household finance confidence index to end February. We compare the confidence of households now, compared with 12 months ago. The overall index, which is still below a neutral setting, fell slightly again in the month,  despite the RBA rate cut of 25 basis points in February. Households are less confident about their financial health than anytime since December 2012. To calculate the index we ask questions which cover a number of different dimensions. We start by asking households how confident they are feeling about their job security, whether their real income has risen or fallen in the past year, their view on their costs of living over the same period, whether they have increased their loans and other outstanding debts including credit cards and whether they are saving more than last year. Finally we ask about their overall change in net worth over the past 12 months – by net worth we mean net assets less outstanding debts.

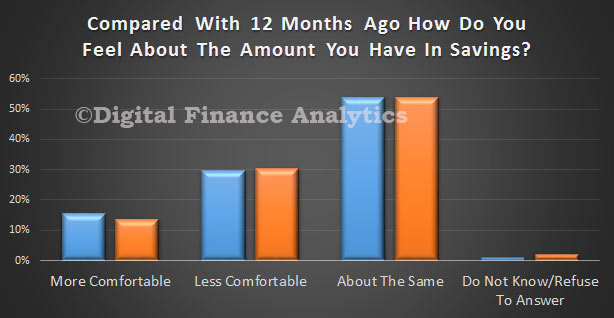
FSI-Index-Feb2015Looking at the composite elements in the index, with regards to savings, those comfortable with what they have saved, fell by 1.7%, reflecting mainly lower deposit rates, especially amongst females. Those less comfortable rose a little (0.6%). Those in part-time work had similar ratings to those households unemployed, in contrast to those full time employed. In these charts, the blue is data 12 months to January, and orange is 12 months to February.

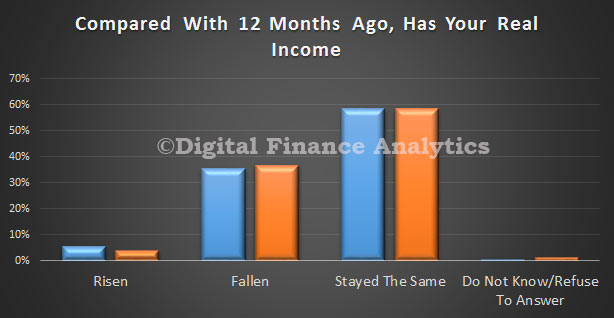
FSI-Savings-Feb2015Those households who think their real incomes have grown, fell by 1.8% in the month, whilst those households whose real incomes fell, rose by 1.3%.

FSI-Income-Feb2015Looking at household debt, households who were comfortable with their level of debt fell by 1.1%, though we found males more comfortable with their debt position than females. A slightly higher proportion were as comfortable as 12 months ago.

FSI-Debt-Feb2015Those whose costs of living stablised over the last 12 months rose by 0.5% to 59.3%, helped by lower interest rates, petrol and electricity bills.

FSI-Costs-Feb2015More than half of the households said their net worth had increased over the past year, up by 1.1% for last month. Less households had seen a fall in net worth (down 1.85%)

FSI-Net-Worth-Feb2015Finally a slightly smaller number of households thought their jobs were as secure as a year ago, (down 1.1% to 61.6%), those who felt their jobs were more secure fell (down 0.9%), whilst those felling less secure rose a little (up 0.3%).

FSI-Job-Feb2015Our take is that household financial confidence is still in the doldrums, despite ultra low interest rates and sky high property prices. Their future spending patterns will remain conservative, and we will not see a sudden change in consumption patterns anytime soon. We will update the index again next month.

DFA’s New Household Finance Confidence Index Falls

DFA has just launched a New Household Finance Confidence Index, and so we are going to explain how the index works, and also discuss the initial results. This brief video covers both.

DFA has been surveying households on aspects of their finances for many years. We have 26,000 households in our sample at any one time. We include detailed questions covering various aspects of a household’s financial footprint. We are using this data to create a monthly index – THE HOUSEHOLD FINANCE CONFIDENCE INDEX. The index measures how households are feeling about their financial health.

To calculate the index we ask questions which cover a number of different dimensions. We start by asking households how confident they are feeling about their job security, whether their real income has risen or fallen in the past year, their view on their costs of living over the same period, whether they have increased their loans and other outstanding debts including credit cards and whether they are saving more than last year. Finally we ask about their overall change in net worth over the past 12 months – by net worth we mean net assets less outstanding debts.

The overall result for Australian households shows a gradual but significant fall in confidence over the past few months. Whilst a score of 100 would be a neutral result, the latest data to January 2015 came in at only 92.4. So on average, Household Finance Confidence Is Falling.

FCI-Index-Jan-2015
This initially seems quite surprising, because nearly 58 percent of households said their net worth had improved over the past year, thanks to significant rises in house prices. For example in Sydney prices rose on average 12 per cent. In addition, superannuation is growing, and the stock market has been performing quite well. However, a quarter of households were less comfortable with their level of debt compared with last year, reflecting larger mortgages and higher levels of credit card debt.

FCI-Debt-Jan-2015
One third said their real incomes have dropped, partly because overtime is being cut, and partly because average pay increases are lower than inflation has been. Many households have had no increases for several years.

FCI-Income-Jan-2015
In addition, more than 35 percent said their costs of living had risen. Despite recent falls in fuel prices at the bowser, the costs of child care, school fees, electricity and gas, and food more than offset any gains.

FCI-Costs-Jan-2015
Looking at savings, about 30 per cent of households were less comfortable with their level of savings compared with last year.Many are dipping into savings to make ends meet, and others are seeing overall income dropping because of falling interest rates.

FCI-Savings-Jan-2015
Finally, nearly one fifth were less confident of their job security than a year ago.

FCI-Job-Security-Jan-2015
Now, these are national results. Whilst the survey is completed at a segment level, and by each state, this more granular data is not available in this post.

We will be updating the confidence index each month, and will post the results on the DFA blog. You can of course subscribe to receive updates.