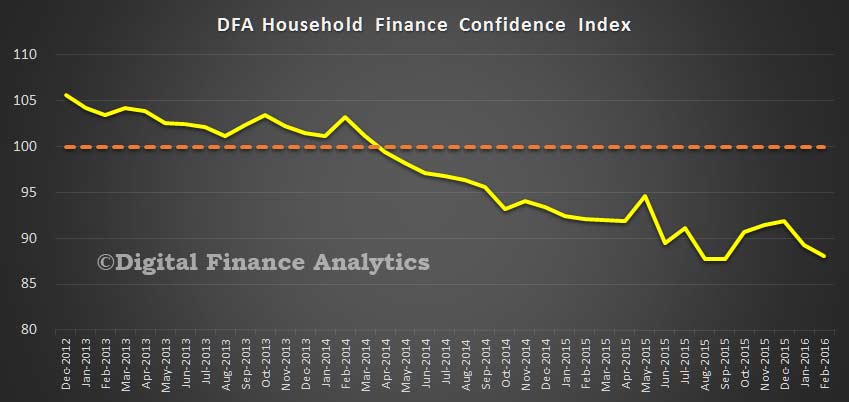
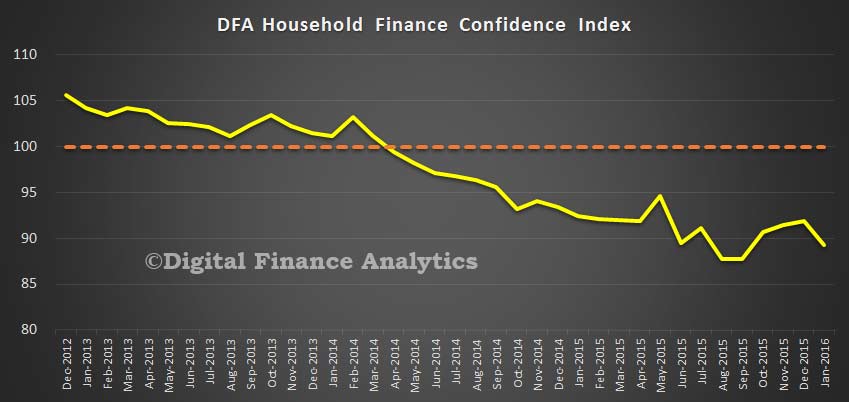
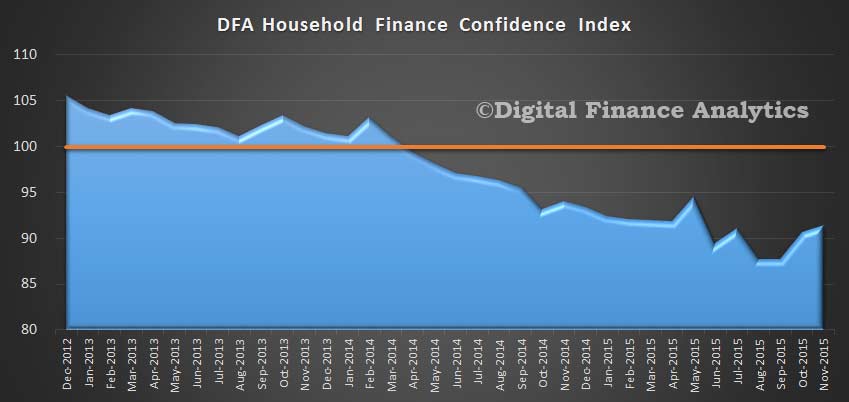
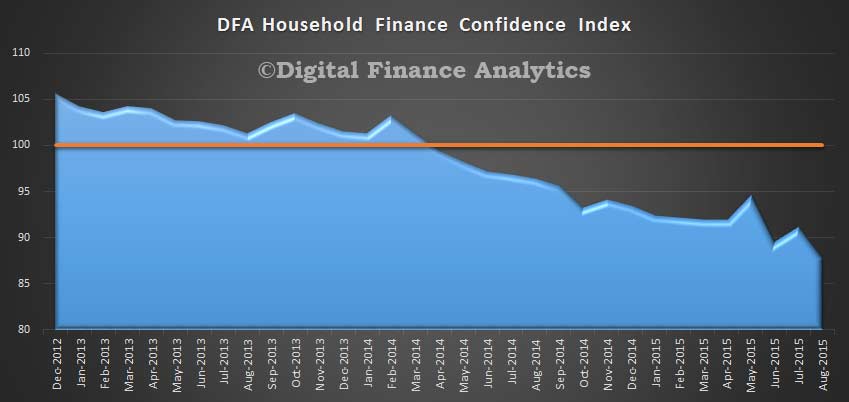
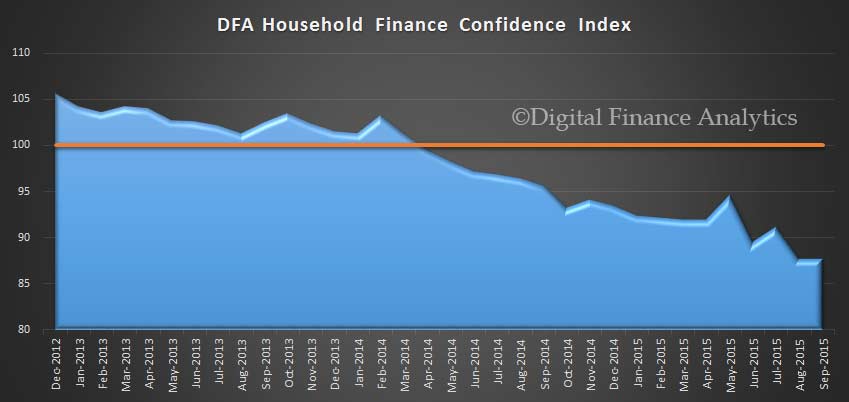
The negative household confidence sentiment continued in September according to the latest results from our household surveys, released today. The overall score was 87.73, compared with 87.69 last month. These are levels well below 100 which is a neutral result, and still in the lowest region since 2012 when the DFA FCI started. The instability in the financial markets, flat real income growth, and rising costs swamped any positive impact on the change of Prime Minister overall. Households with property investments remain significantly more confident than those who are property inactive.
 The results are derived from our household surveys, averaged across Australia. We have 26,000 households in our sample at any one time. We include detailed questions covering various aspects of a household’s financial footprint. The index measures how households are feeling about their financial health.
To calculate the index we ask questions which cover a number of different dimensions. We start by asking households how confident they are feeling about their job security, whether their real income has risen or fallen in the past year, their view on their costs of living over the same period, whether they have increased their loans and other outstanding debts including credit cards and whether they are saving more than last year. Finally we ask about their overall change in net worth over the past 12 months – by net worth we mean net assets less outstanding debts.
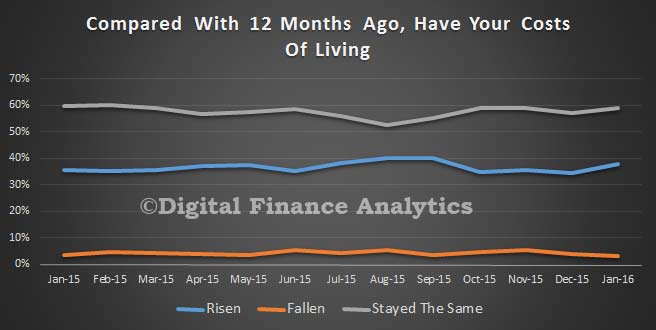
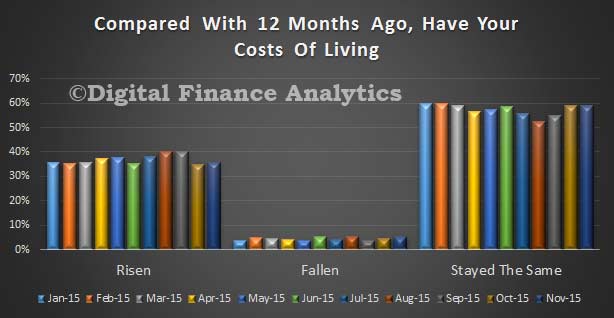
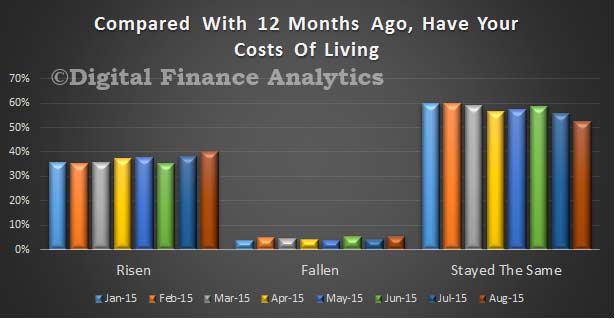
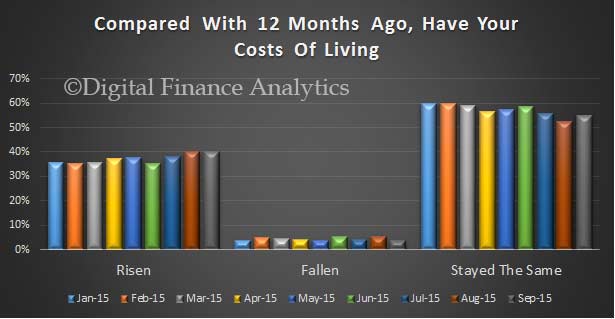
Looking in detail at the elements which drive the survey, 40% of households said their costs of living had risen in the past 12 months, a rise of 0.17% from last month. Only 3.6% of households said their costs had fallen, down 2% on last month. Major movements were driven by the rising costs of some supermarket goods, as well as child care and school fees. 55% of households said their costs of living had not changed in the part year, a rise of 2.5% from last month. The majority of younger households were significantly worse off.
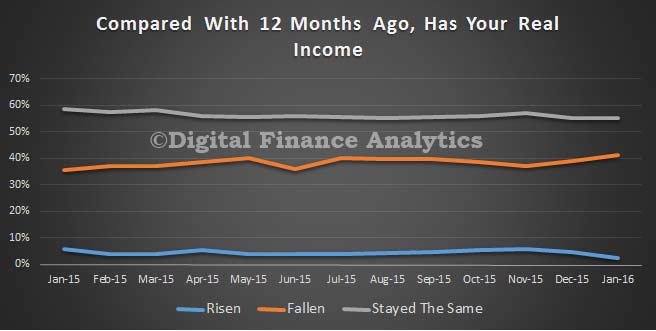
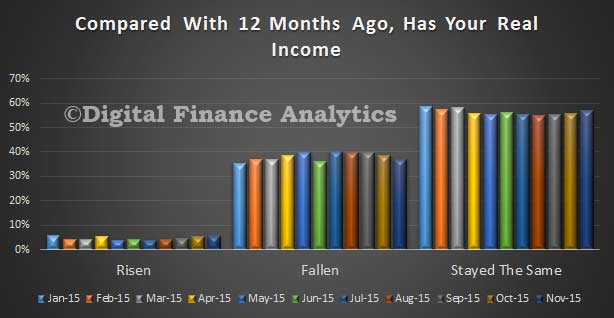
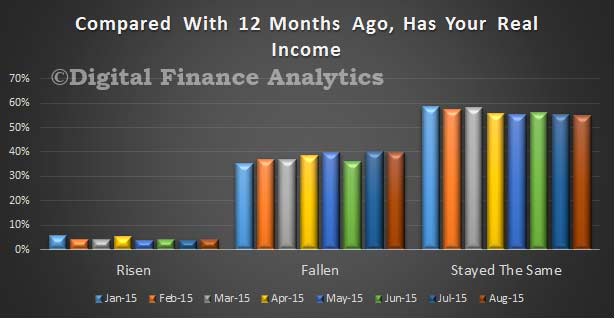
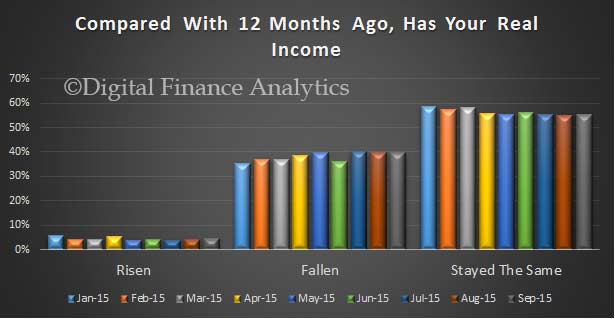
 Turning to income, after inflation, 4.8% of households said their incomes had risen, up 0.6% on last month, whilst 40% said their real incomes had fallen, down 2% on last month. 55% said there had been no change in the part 12 months. Those relying on income from savings continue to be hit by low deposit account interest rates, and recent stock market falls. We saw a number of households report a fall in overtime, especially in WA and SA, whilst in NSW and VIC additional work was a little easier to find.
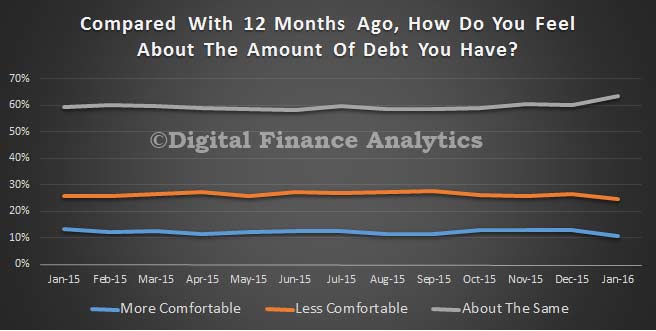
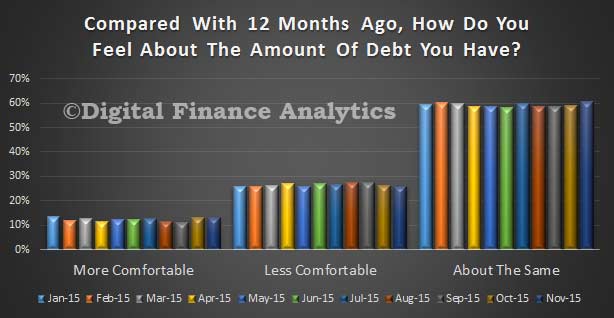
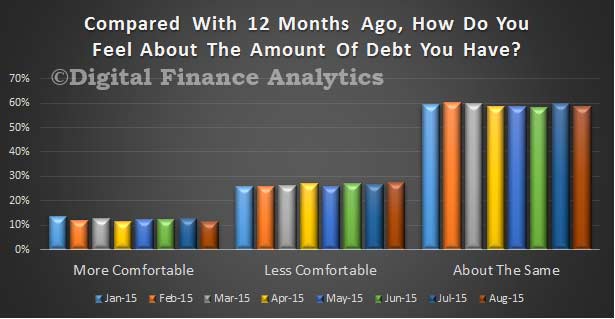
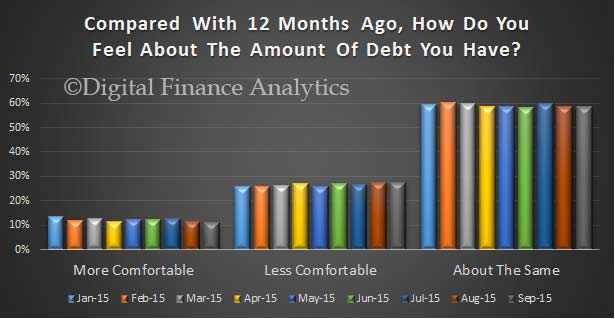
 Next we look at debt. 11% of households were more comfortable than 12 months ago, little changed from last month. Many of these continue to pay ahead on their mortgage, and are reducing credit card debt. 27.7% of households were more uncomfortable than a year ago, up 0.38% on last month. Those younger households with a owner occupied mortgage were most concerned, and in addition, we noted the rise of concern among those using credit cards to balance their spending. The ongoing low mortgage rates on owner occupied mortgages provides a buffer, and so far, the higher rates on investment loans have not worked through to dent confidence. 58% of households were as comfortable with the debts they service, very similar to last month.
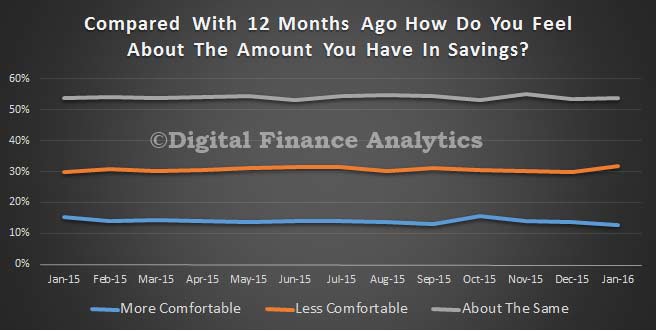
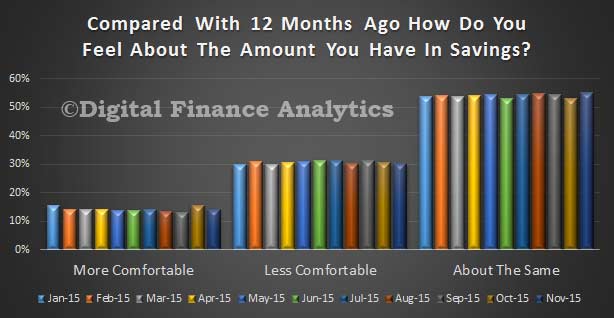
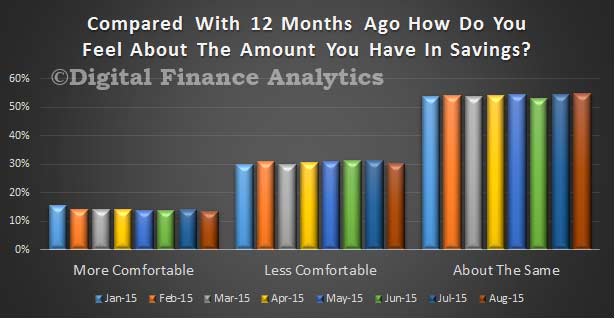
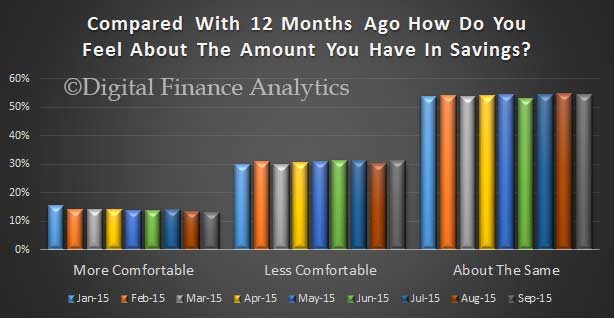
 Looking specifically at savings, 13.2% were more comfortable, down 0.4% on last month. 31.1% were less comfortable, up 1% on last month, thanks to stock market volatility and ultra low bank deposit rates. There was a higher concern now that the Government may impose more tax on superannuation following the change of leadership. 54% of households were still as comfortable compared with 12 months ago, little changed on the month.
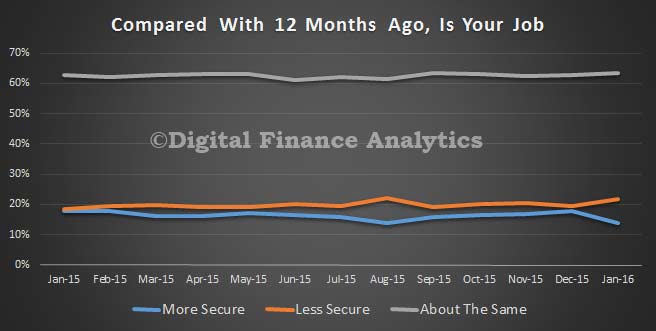
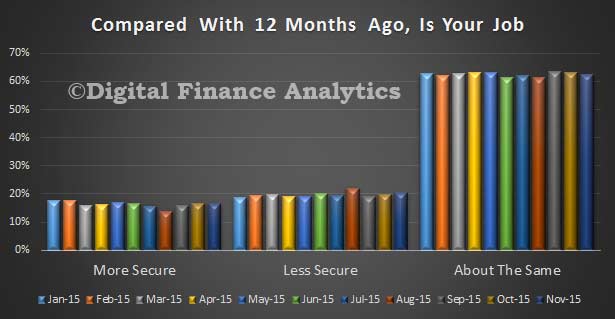
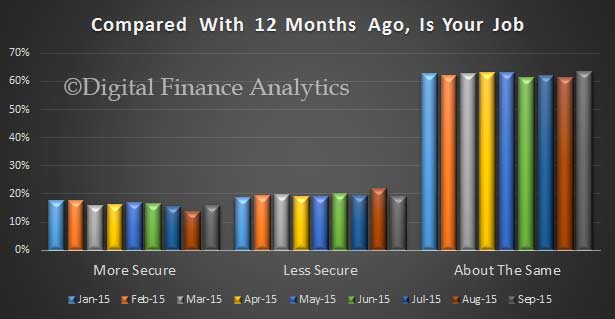
 The state variations in job security are becoming more pronounced, with WA, SA and NT all showing greater concerns, whilst NSW and VIC continued to improve. We noted those currently working in the construction sector were more concerned this month, thanks to an expected development slow-down. Those more secure than last year rose 2.1% to 15.9%, thanks to the NSW and VIC effect. 63% of households were as confident as 12 months ago, up 2%, whilst those less confident overall fell by 2% to 19%. However, there are a number of moving parts which are working in different directions, and which are averaged away in the national summary.
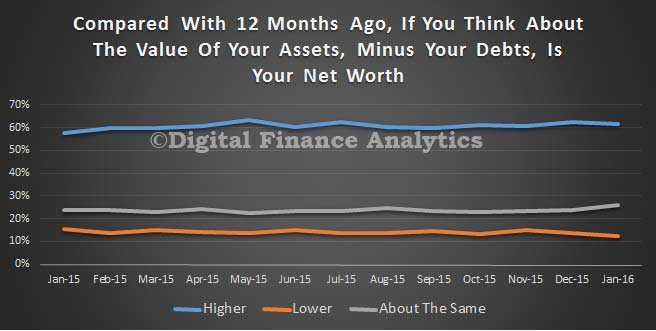
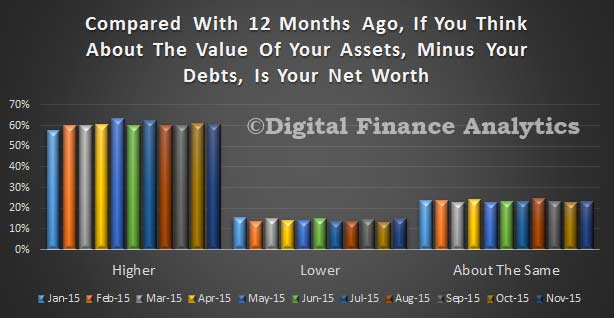
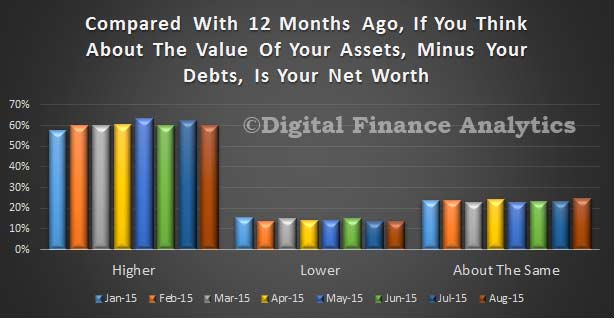
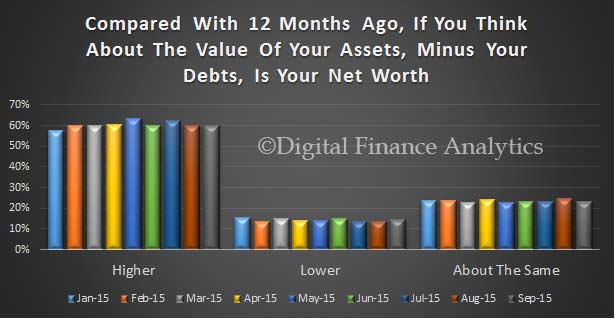
 Finally, we look at net worth, a measure of overall value held, net of debt by households. Overall, those with higher net worth than a year ago remained at 60%, whilst those with lower net worth rose 1% to 14.5%. 23.5% of households said they had no overall change, up 2.6% on last month. There are again offsetting forces at work in these results, with sustained house price growth in NSW and VIC more than offsetting falls in the stock market. On the other hand, states where house prices were weaker, were more likely to see net worth fall, because mortgage debt is still high.
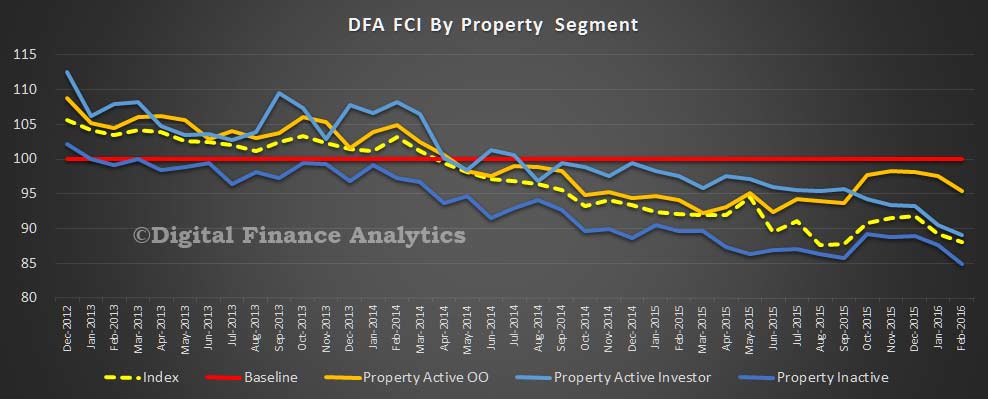
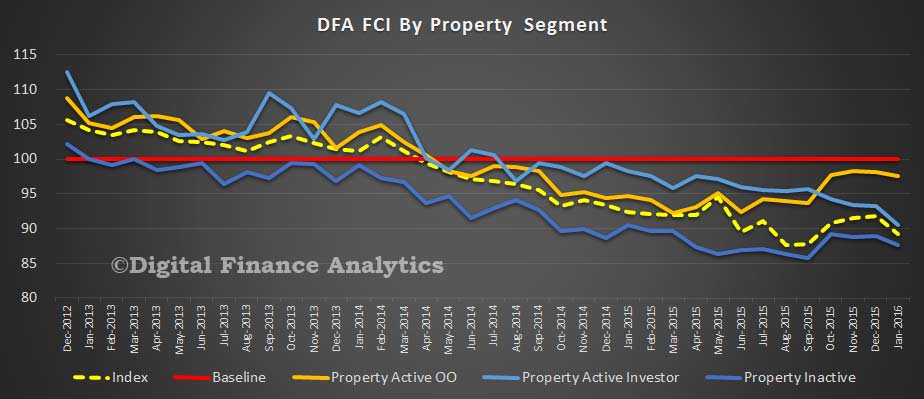
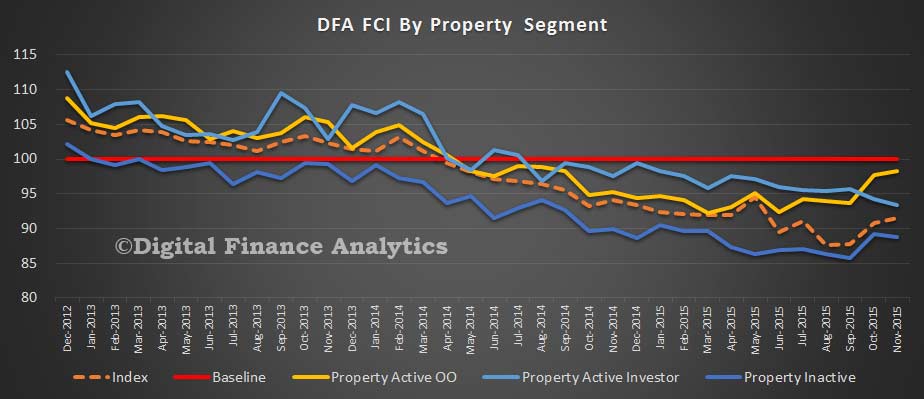
 If we look at the overall index by property segment (as defined by DFA), those who are property inactive (either renting, living with friends, at home, or in public housing) had a lower confidence score, because they had all the pressures created by rising costs, static or falling incomes, and no upside from property. Investment property investors were the more confident (though still well below the 100 neutral level), and owner occupied home owners are between the other two segments.
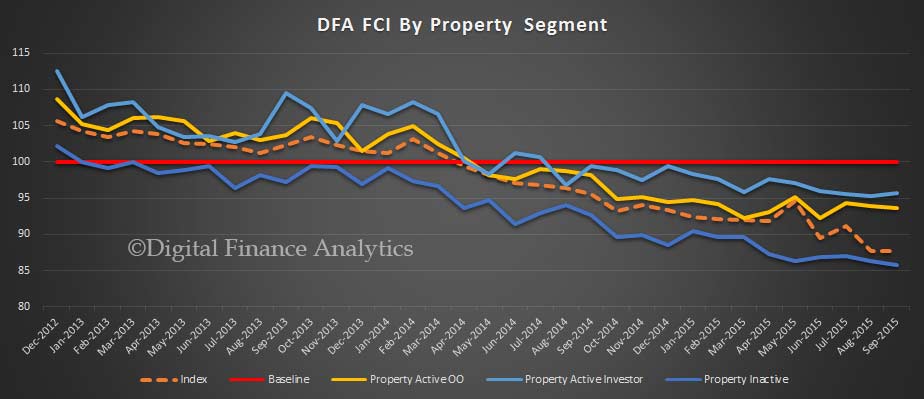 Overall then household financial confidence continues to languish, despite record low interest rates. Because of this we believe many households will continue to spend carefully, and be careful not to extend their high personal debt further. We also see how property is supporting the confidence levels significantly, and of course if this changed for any reason (for example, static or falling capital growth, or rising rates) confidence would be significantly dented further. The future of housing has become the key to confidence.

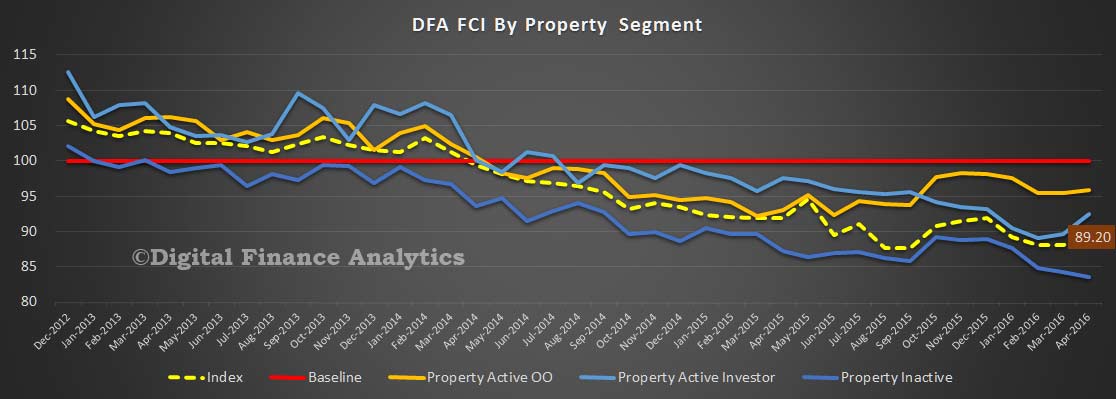 Of note is the significant spike from 89.67 to 92.45 in confidence among property investors, thanks to the Government stance on negative gearing, the expectation of interest rate cuts, and better news on home price growth. Investor households in NSW and VIC improved the most. Property active owner occupied households saw a small lift from 95.43 to 95.93, thanks to the expectation of lower mortgage rates (though offset by lower returns from those with deposits). Improved stock marker performance assisted. Once again, stronger positive scores in NSW and VIC were somewhat offset by noticeably weaker scores in WA and QLD.