
The enhanced focus on mortgage lending serviceability means that a consideration of the loan to income ratio or LTI is ever more important.
In the UK, where LTI calculations are the norm, the Bank of England first introduced limits on high LTI mortgages in 2014. These measures meant that no more than 15 per cent of mortgages issued should exceed a loan-to-income ratio of 4.5. The actions were not retrospective and few British lenders were impacted by the curbs.
 The UK’s 4.5 LTI cap on 85 per cent of new lending is still in place. In June last year, Bank of England governor Mark Carney announced that the 4.5 ratio “insurance measures” will become “structural features of the UK housing market.
Last month, APRA, the prudential regulator announced that it would remove its 10 per cent benchmark on investor loan growth for banks that could confirm that their policies and practices meet a range of expectations.
But one of APRA’s expectations for banks is a commitment to develop
internal risk appetite limits on the proportion of new lending at very high debt-to-income levels (where debt is greater than six times a borrower’s income) and policy limits on maximum debt-to-income levels for individual borrowers.
So, it should be of no surprise to note that the Commonwealth Bank of Australia has announced that it has brought in its new debt-to-income measurement for borrowers.
CBA, who is the largest owner occupied mortgage lender in Australia has disclosed that it will now “monitor” loan applications with a debt-to-income ratio higher than 4.5 and will also bring in a new e-learning requirement for brokers that have not settled a CBA loan for more than a year. Applications with a DTI higher than 7.0 will be subject to a manual credit approval check.
The new measure will reportedly help the bank get a clearer picture of what its book looks like and to understand trends. Speaking of the decision, Daniel Huggins, CBA’s executive general manager, home buying, said:
At the Commonwealth Bank, we constantly review and monitor our home loan processes and policies to ensure we are maintaining our prudent lending standards and meeting our customers’ home buying needs. Our decision to implement a new debt-to-income measure is just another example of our ongoing commitment to responsible lending and meeting our regulatory commitments.
Last year, NAB introduced an LTI ratio calculation of 8 for all home loan applications. In February, this year, it was reduced to 7 a still generous 7 times.
The bank said at the time.
NAB is committed to lending responsibly and ensuring our customers can meet their home loan repayments today and into the future.
Now we have been looking at the current portfolio view of all mortgages in Australia from an LTI perspective using data from our core market model. This is based on our rolling survey of 52,000 households each year.

The relative distribution across the LTI bands highlights relative risks in the system.
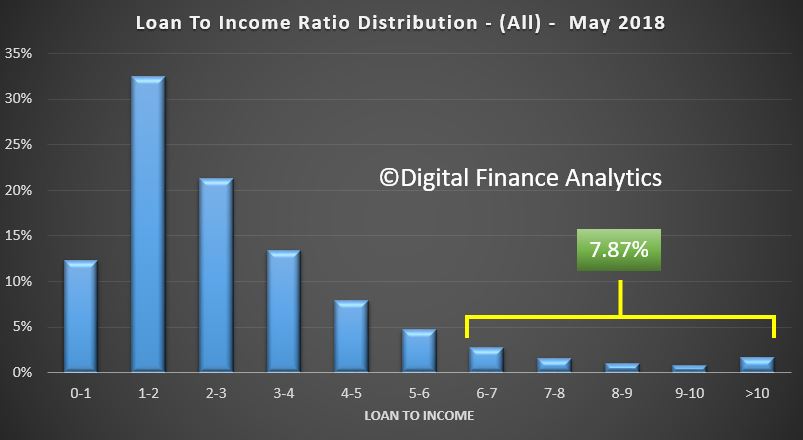
We took a cut off of 6 times, in line with the APRA guidelines. On an all portfolio basis, across the country around 7.9% of all loans have a current loan to income ratio of 6 times or more. This is based on current loan values and current incomes, not those considered at the inception of the loan.
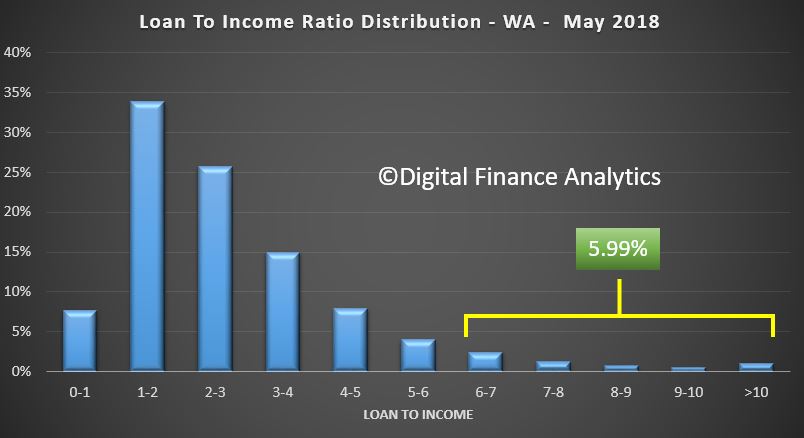
 But there are some significant state variations, for example, loans in Western Australia have 6% of loans with an LTI of 6 or above. In the west the proportion is rising as incomes remain constrained, despite loans growing a little. This is thanks partly to capital being released via refinancing.
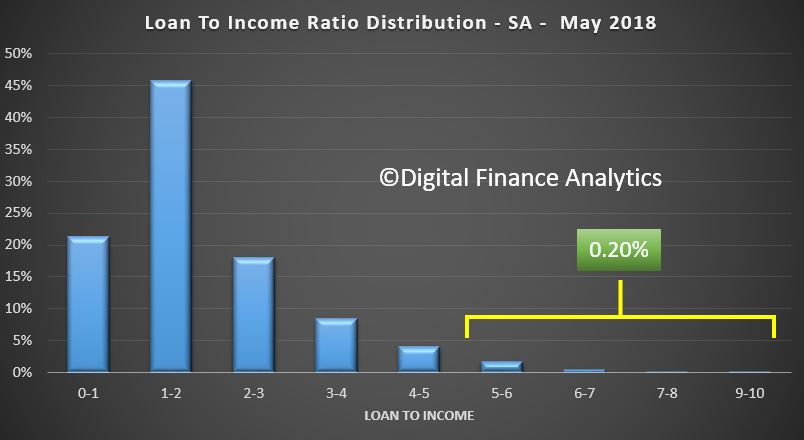
 In South Australia, only a very small proportion of loans have a loan to income of 6 times or more.
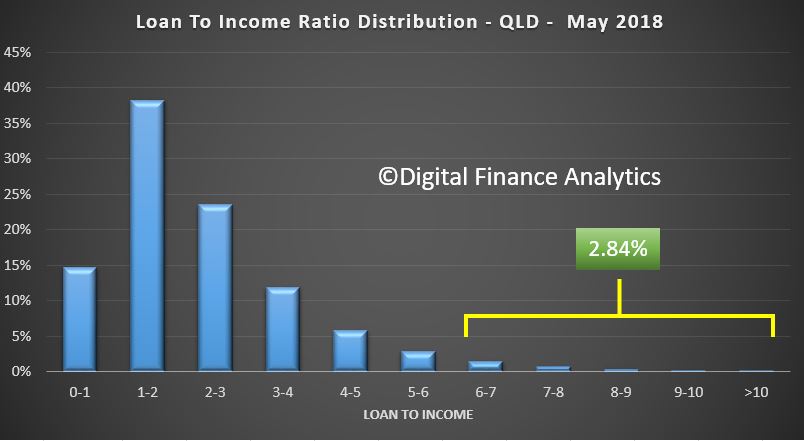
 In Queensland, the total proportion above 6 times is 2.8%.
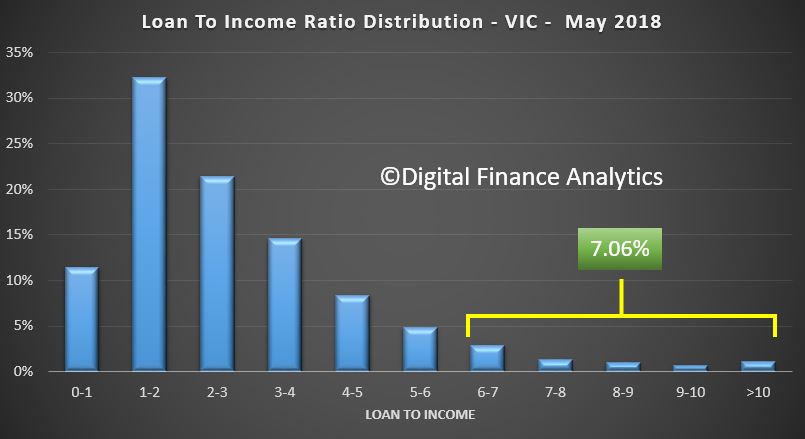
 However things get more interesting in the eastern states, with 7.1% of households in Victoria holding a loan to income ratio of 6 times or higher.
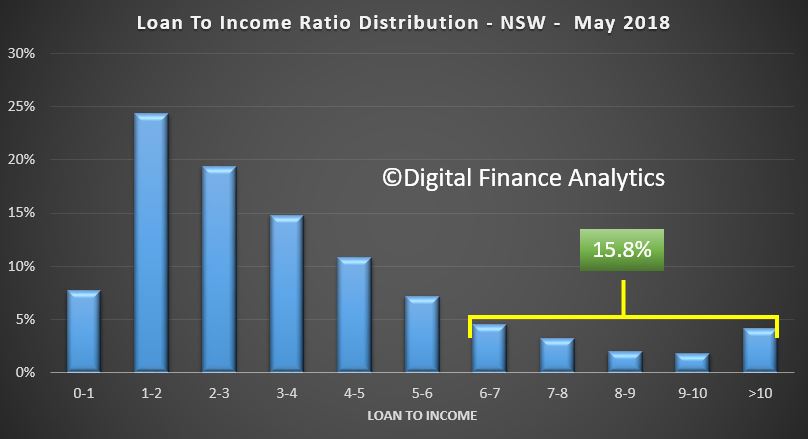
 But the prize goes to New South Wales with a massive 15.8% of households currently holding loans with a loan to income ratio of 6 or more. This is of course explained by the high prices, big mortgages, and lose lending standards.
 This analysis provides some insights into the pressures on households, as this higher multiples are indicative of larger payments being made to service the loan.
Thus we conclude the most severe issues will be found in NSW, where of course house prices are now firmly on the slide.
We will publish our latest mortgage stress data, to the end of May early next week. Finally, consider this, when I was a banker, the rule of thumb was 3 times one income plus 1 time the second. How the world has changed!