U.S. Non-Bank Mortgage Lender Margins May Fall Further

U.S. non-bank mortgage lenders may face further margin pressure as interest rates continue to rise owing to higher funding costs relative to banks with lower-cost, stable depository funding, Fitch Ratings says.

Profitability metrics for non-bank mortgage lenders are generally weak, with expenses outstripping net revenues by approximately 21% across the five public non-bank mortgage companies for the 4.5-year period ending June 30, 2018.

We expect consolidation to continue as a result of weak profitability, with non-bank lenders seeking scale efficiencies to combat rising rates, persistently high technology and regulatory compliance costs, and declining refinancing activity. That said, non-bank lenders with multiple origination channels and established mortgage servicing platforms that generate higher fee income and more sustainable earnings should be better positioned for the shifting trends of the interest rate and economic cycles. These lenders are generally less exposed to cyclical swings in the mortgage market, as the complementary nature of origination and servicing businesses can serve as a natural hedge, reducing earnings volatility.

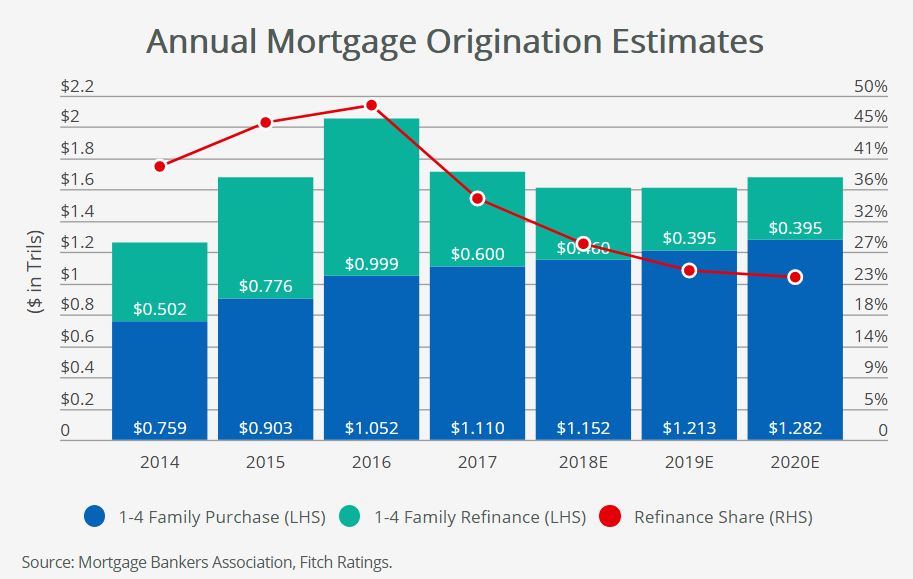
Aside from driving funding costs higher, Fitch also sees rising interest rates as a headwind to origination volumes, which could further pressure profitability in the medium term. Forecasts by the Mortgage Bankers Association (MBA) call for originations of $1.6 trillion annually from 2018-2020, down 6% from 2017 levels. Refinancings should drop to 24% of originations by 2020, down from 49% in 2016, in the face of rising rates, according the MBA.

Positively, mortgage servicing right (MSR) valuations generally increase with rising rates and economic growth, as prepayments fall and default risk lessens. Reflecting these dynamics, MSR valuations have increased in recent years, averaging 104bps of the unpaid principal balance of servicing portfolios for the five public non-bank mortgage companies.

Ratings assigned to non-bank mortgage servicers are typically in the ‘B’ to ‘BB’ rating categories, reflecting the highly cyclical and monoline nature of the business, valuation volatility associated with MSRs, elevated legislative and regulatory scrutiny, weak earnings profiles and reliance on short-term wholesale funding sources.

Brexit Uncertainty Makes Smooth Transition Less Likely

An intensification of political divisions within the UK and slow progress in negotiations with the EU means there is such a wide range of potential Brexit outcomes that no individual scenario has a high probability, Fitch Ratings says.

We no longer believe it is appropriate to identify a specific base case. An acrimonious and disruptive “no deal” Brexit is a material and growing possibility.

Fitch’s prior base-case assumption following the 19 March draft withdrawal agreement – that the UK would leave the EU in March 2019 with a transition period until around December 2020 and a framework for a future Free-Trade Agreement – looks more uncertain. This scenario no longer ranks as significantly more likely than other possible outcomes.

The UK government’s 6 July plan faces opposition from ‘remainers’ and ‘brexiteers’ and has led to close parliamentary votes on Brexit legislation, underlining the depth of division within the ruling Conservative Party and parliament on the future relationship with the EU. Any deal is likely to provoke brinkmanship and may not gain parliamentary approval. This could trigger a general election and greater talk of a second referendum.

The time available to finalise a withdrawal agreement is getting shorter, while the UK and EU remain wide apart. The European Commission has expressed fundamental concerns on aspects of the UK plan. Without more EU flexibility on the indivisibility of the four freedoms (goods, capital, services, and labour), in the context of no physical Irish border, this implies the UK would need to abandon red lines regarding free movement of people and the jurisdiction of the European Court of Justice. Such concessions would make it even more difficult to secure parliamentary passage for a Brexit deal.

Potential outcomes include the UK leaving the EU in March, with a transition agreement and a framework on future trade relations. These range from something based around the UK’s 6 July plan, to initial WTO terms with a commitment to seek a future free trade agreement, to closer alignment with the EU through Single Market and/or Customs Union membership.

“No deal” is also a material possibility. This would substantially disrupt customs, trade and economic activity, with the depth of disruption depending on how quickly a “bare bones” deal could be reached.

Extending the withdrawal period is a more remote possibility, requiring unanimous approval by the European Council in agreement with the UK government. The UK remaining in the EU cannot be excluded if there is a second referendum. As things stand, in our view, no single outcome has a high probability.

Political, economic and institutional uncertainty stemming from the negotiations is reflected in the Negative Outlook on the UK’s ‘AA’ sovereign rating. An outcome that adversely affected growth prospects could lead to a downgrade, as we said when we affirmed the rating in April. Political developments that impede a clear determination of the UK’s future relationship with the EU or undermine the economic policy framework and economic performance are also negative rating sensitivities.

Our most recent macroeconomic forecasts point to GDP growth slowing to 1.3% this year. We forecast stronger growth of 1.7% in 2019 and 2020, in line with the UK economy’s potential growth. But this assumes a smooth Brexit. In a more disruptive Brexit we could substantially reduce our growth forecasts and change our unemployment and inflation assumptions.

Our current forecasts are consistent with the general government deficit falling moderately to 1.4% of GDP in 2020 from 1.9% in 2017, allowing government debt-to-GDP to decline to 83.5% from 87.7%. An adverse Brexit scenario involving a sharp growth slowdown in 2019 and anaemic recovery in 2020 could see the deficit rise towards 2.5% of GDP in the near term, other things equal. In this scenario, debt-to-GDP would decline more gradually over 2019 and 2020.

A severe enough shock could reverse the downward trajectory in the ratio since 2015. Worsening public finances leading to a rising government debt ratio could also lead to a downgrade of the UK.

End of ECB QE Could Push Up Global Bond Yields

Global bond yields could see upward pressure if net capital outflows from the eurozone start to subside when the ECB ends its quantitative easing (QE) in December 2018, according to Fitch Ratings.

The latest chart of the month from Fitch’s economics team shows net outflows of capital from the eurozone in the form of long-term portfolio debt instruments. This is calculated as purchases of foreign bonds by eurozone residents minus foreigners’ purchases of eurozone bonds. Net portfolio debt outflows rose sharply after the ECB commenced government bond purchases in early 2015. ECB purchases were substantially greater than the net issuance of new debt to fund eurozone government deficits, implying reduced exposures by existing holders of eurozone government debt. In an environment of increasing scarcity, existing bondholders moved capital to other geographies.

This large net capital outflow has likely helped cap benchmark long-term bond yields in the US (and elsewhere) and a reversal of these flows could drive yields upwards. Since the start of the ECB’s sovereign QE programme, it has bought over EUR2 trillion of bonds while net bond outflows from the eurozone have amounted to EUR1.5 trillion. Eurozone investors now own as many US bonds as Japan and China combined. However, with net QE purchases set to end this year net outflows have already recently started to lose some momentum with foreign selling of eurozone bonds moderating since the start of this year. The risk is that eurozone net bond outflows could drop away sharply when the ECB QE ends in December 2018, reducing demand for US Treasuries and pushing up US (and global) yields.

One factor that could temper such a shock is the ongoing yield advantage of owning US bonds. This is likely to remain a strong pull factor for eurozone investors, as the chart shows. The spread between two-year US Treasuries and German Bunds is at the widest in three decades. The large stock of ECB QE holdings is expected to continue to contain Bund yields, which will remain further anchored by ECB’s negative deposit rate. We believe the ECB deposit rate will be on hold until late next year while the central bank awaits confirmation of firmer underlying inflation trends. Meanwhile the Fed will continue to raise rates.

While the ECB’s dampening influence on global bond yields is likely to weaken significantly from next year, it is unlikely to go away completely.

CBA Results Highlight Pressure Points for Australian Banks

From Fitch Ratings.

Fitch Ratings says the Commonwealth Bank of Australia’s full-year results to 30 June 2018 (FY18) broadly support the agency’s expectation that earnings pressure would emerge for Australian banks during 2018. An increase in wholesale funding costs led to a reduction in CBA’s net interest margin in 2H18, loan growth continued to slow and continued investment into the business and compliance contributed to higher expenses. Mortgage arrears also trended upwards due to some pockets of stress, and while they have not translated into higher provision charges as yet due to strong security values, continued moderation in Australian house prices may result in higher provisioning charges in future financial periods.

Most of the earnings issues appear applicable across the sector and are likely to remain into 2019, placing pressure on profit growth for all Australian banks. Increased regulatory and public scrutiny of the sector may make it difficult for the larger banks to reprice loans to incorporate the increase in wholesale funding costs, meaning net interest margins are likely to face some downward pressure. Loan growth is likely to further slow as the housing market continues to moderate, while compliance costs continue to rise due to the scrutiny on the sector.

The most prominent scrutiny is the royal commission into misconduct in the banking, superannuation and financial services industry, which has already identified a number of shortcomings within the industry. We expect the release of the interim royal commission report, due to be published by the end of September 2018, to give a better view of how widespread these shortcomings are and what impact they may have on the credit profile of Australian banks.

CBA’s FY18 results show a level of resiliency despite these issues. The bank reported cash net profit after tax from continuing operations declined 5% to AUD9.2 billion in FY18, but this was driven by a number of one-off charges, including a AUD700 million fine to settle a civil case in relation to breaches of anti-money laundering and counter-terrorism financing requirements. Cash net profit after tax from continuing operations rose by 4% to AUD10.0 billion when the one-off items were excluded.

Balance-sheet metrics remain consistent with Fitch’s expectations. The bank reported a stable common equity Tier 1 ratio of 10.1%, which incorporates the AUD1 billion additional operational risk charge (essentially an increase of AUD12.5 billion in operational risk-weighted assets) put in place following the publication of the independent prudential inquiry report in May 2018. The divestiture of a number of assets planned for FY19 as well as CBA’s ability to generate capital through retained earnings mean the bank is well-positioned to meet the regulator’s “unquestionably strong” capital requirements ahead of schedule. CBA’s liquidity coverage ratio (131%) and net stable funding ratio (112%) both increased due to an improvement in the bank’s deposit mix towards more stable deposit types and a lengthening in the average term to maturity of its wholesale funding.

Fitch continues to monitor CBA’s progress in remediating shortcomings in its operational risk controls and governance identified in the May 2018 independent prudential inquiry report as risks around this process were a key driver of Fitch’s revision of CBA’s Outlook to Negative. CBA noted in the FY18 results announcement that the remediation program has received approval from the Australian Prudential Regulation Authority and that it aims to make significant progress in implementing the program over FY19. However, CBA also noted that full remediation would be a multiyear process for the bank.

How Will The Trade Wars Play Out?

From Fitch Ratings.

There is every reason to believe that the United States’ trade dispute with China will get worse before it gets better, and that the US trade deficit will widen further rather than shrinking. In fact, the economic conditions – were they to materialize – that would allow President Donald Trump’s administration to claim victory in the dispute would ultimately undermine its economic policy credibility.

Now that they are on the receiving end of US tariffs, Chinese policymakers have three options. First, they could capitulate, by scaling back many of the “discriminatory practices” identified in the US Trade Representative’s March 2018 report on technology transfers and intellectual property. So far, there is no indication that China is considering this option.

Second, China could escalate the dispute. It could set its own tariffs higher than those of the US, apply them to a larger range (and greater dollar value) of US exports, or offset the impact of US tariffs on Chinese exporters by allowing the renminbi to depreciate against the dollar. Alternatively, policymakers could look beyond trade in goods to consider capital flows and related businesses associated with US firms, effectively allowing the authorities to impede US financial and nonfinancial firms’ Chinese operations. As with the first option, this one seems unlikely, at least at this stage of the dispute.

So far, China has chosen the third option, which lies between capitulation and escalation. China has retaliated, but only on a like-for-like basis, matching US tariff rates and the dollar value of trade affected. At the same time, it has tried to claim the moral high ground, by eliciting international condemnations of protectionism and unilateralism. This hasn’t been difficult, given that several other major economies are currently facing US tariffs. Securing such third-party buy-in is critical for the Chinese leadership’s domestic position. If the government were perceived at home as being bullied by the US, it would have to take a much tougher line in the trade dispute.

For its part, the US actually has rather limited options, despite having initiated the dispute. Even for a notoriously unpredictable administration, a full and unconditional reversal on tariffs seems out of the question. But so is the status quo, now that China has already leveled the playing field by retaliating in kind. That leaves only escalation – a possibility that the Trump administration has already raised by threatening additional tariffs on all imports from China.

Global Quantitative Tightening to Start Next Year

The combined net asset purchases of the four central banks (CB) that engaged in quantitative easing (QE) will turn negative in 2019, one year earlier than Fitch Ratings previously estimated. This underscores the shift in global monetary conditions that is underway – as strong global growth continues and labour markets tighten – and could portend an increase in financial market volatility.

The four “QE” CBs – i.e. the Fed, European Central Bank (ECB), Bank of Japan (BOJ) and Bank of England (BOE) – made net asset purchases equivalent to around USD1,200 bilion per annum on average over 2009 to 2017. This is set to slow significantly this year to around USD500 billion as the Fed’s balance sheet shrinks, the BOJ engages in de facto tapering and ECB purchases are phased out by year-end. More significantly, combined net asset purchases are expected to turn negative next year as the decline in the Fed’s balance sheet will be larger in absolute terms than ongoing net purchases by the BOJ.

This shift to global quantitative tightening (QT) is now expected to happen a year earlier than previously estimated (see “Quantitative Easing – The Beginning of the End” – Fitch, November 2017) reflecting a downwardly revised forecast for BOJ purchases in 2019. The decline in combined CB asset holdings is expected to be around USD200 billion in both 2019 and 2020. The peak in QT is expected to occur in 2021 as the ECB and BOE start to unwind purchases, while the Fed is still in the process of normalising its balance sheet, albeit at a somewhat slower pace.

The impact of such a large turnaround in CB purchases on global financial markets is likely to be significant, despite it being widely anticipated and despite the smooth progress seen with the Fed’s balance sheet reduction since last October.

There is very strong empirical evidence to suggest that CB purchases have reduced bond yields, implying upward pressure on yields as purchases are unwound. The limited impact on US bond yields from the decline in Fed holdings since October 2017 may partly reflect international spill-overs from ongoing ECB and BOJ purchases, as existing holders of Japanese and eurozone government bonds have been forced to look for alternative ‘safe assets’ after selling bonds to the BOJ and ECB.

But private sector investors will be called upon to absorb a much greater net supply of government debt in the coming years as CB reduce holdings and government financing needs persist in Europe and Japan and rise sharply in the US.

CB purchases have likely been a factor dampening financial market volatility by providing a large and steady ‘bid’ for fixed-income assets and a bid that is not sensitive to market price fluctuations. In this context it is notable that financial market volatility has risen in 2018 as combined CB net purchases have slowed.

Trade War Escalation Would Knock 0.4% off World Growth

An escalation of global trade tensions that results in new tariffs on USD2 trillion in global trade flows would reduce world growth by 0.4% in 2019, to 2.8% from 3.2% in Fitch Ratings‘ June 2018 “Global Economic Outlook” baseline forecast. The US, Canada and Mexico would be the most affected countries.

The imposition of further tariff measures currently being considered by the US administration and commensurate retaliatory tariffs on US goods by the EU, China, Canada and Mexico would mark a significant escalation from tariff measures imposed to date, as noted in a recent Fitch Wire published on July 3 (“Risks to Global Growth Rise as Trade Tensions Escalate”).

Using the Oxford Economics Global Economic Model – a global macroeconomic model taking into account trade and financial linkages between economies – Fitch’s economics team assessed the economic impact of a scenario in which the US imposes auto import tariffs at 25% and additional tariffs on China, where trading partners retaliate symmetrically, and NAFTA collapses.

We factored in new tariffs on a total of USD400 billion of US goods imports from China in our simulations in light of recent statements from the US administration. This is twice as large as the scenario outlined in the aforementioned Fitch Wire. The tariffs under our new scenario would cover 90% of total Chinese goods exports to the US when added to tariffs on USD50 billion of exports already announced.

The tariffs would initially feed through to higher import prices, raising firms’ costs and reducing real wages. Business confidence and equity prices would also be dampened, further weighing on business investment and reducing consumption through a wealth effect. Over the long run, the model factors in productivity being affected as local firms are less exposed to international competition and so would face fewer incentives to seek efficiency gains. Export competitiveness in the countries subject to tariffs would decline, resulting in lower export volumes. The negative growth effects would be magnified by trade multipliers and feed through to other trading partners not directly targeted by the tariffs. Import substitution would offset some of the growth shock in the countries imposing import tariffs.

The US, Canada and Mexico would be the most affected countries. GDP growth would be 0.7% below the baseline forecast in 2019 in the US and Canada and 1.5% in Mexico. The level of GDP would remain significantly below its baseline in 2020. The results only consider tariff impacts, but the non-tariff barriers associated with the collapse of NAFTA could be equally if not more significant as supply chains are disrupted.

China would be less severely impacted, with GDP growth around 0.3% below the baseline forecast. China would only be affected directly by US protectionist measures in this scenario, whereas the US would be imposing tariffs on a large proportion of its imports while being hit simultaneously by retaliatory measures from four countries or trading blocs.

Most countries not directly involved in the trade war would see their GDP falling below baseline, though generally at a much lower scale. Net commodity exporters would be more severely hit, as slower world growth would push oil and hard commodity prices down. On the other hand, for some net commodity importers, the benefits from lower hard commodity prices would more than offset the impact of lower world growth.

Except in Canada and Mexico, a trade war scenario would ultimately be deflationary as lower growth and hard commodity prices would reduce inflation, outweighing the initial direct impact of higher tariffs in raising prices. The US Federal Reserve’s monetary tightening would be scaled back given lower growth and lower overall inflation in the US, with the level of the Fed Funds rate around 0.5pp below baseline.

US Corporate Trade Warnings Portend Softer Capex – Fitch

Growing concerns in the US business community about the potentially adverse effects of tariffs could cause modest deterioration in US manufacturing activity and capital spending by YE 2018, according to Fitch Ratings.

The escalation of the US-China trade dispute and the notable absence of constructive negotiations point to a continuation of trade-related uncertainty for US businesses through the second half of the year.

We expect approximately 3% growth in aggregate capital spending for Fitch’s universe of rated US corporates in 2018, following 6% growth in 2017, due in part to the cash benefits of tax reform. However, warnings that business strategies may be altered and capital projects delayed, along with potential pressure on exports, suggest capex trends could weaken. We currently expect aggregate capex to decline 0.8% in 2019. This may mark a potential inflection point in the current late-stage business cycle.

Several US companies, including Harley Davidson, Brown-Forman, and General Motors (GM), have spoken out on the potential adverse effects of escalating trade tensions. Harley-Davidson plans to move production of motorcycles for EU markets to its non-US plants to avoid retaliatory tariffs that would add an average of $2,200 to the cost of motorcycles exported to the region from the US. Brown-Forman cautioned that trade issues could negate benefits of a strong economy with the uncertainty making it difficult to accurately forecast earnings. GM indicated that potential US auto tariffs would raise prices of its vehicles, reduce its global competitiveness and lead to a loss of US jobs.

Comments by companies across various sectors, including electrical equipment, appliances and components, and food, beverage, and tobacco, were noted in the Federal Reserve’s June meeting minutes and the Institute for Supply Management’s (ISM) Purchasing Manager survey. This reflects broadening concern over the influence trade-related uncertainty is having on business sentiment and growth plans. Moreover, industry groups such as the US Chamber of Commerce and the Alliance of Automobile Manufacturers that support the business community are lodging complaints to the Trump Administration.

US leading economic indicators currently suggest overall business sentiment remains strong and manufacturing activity continues to expand due to a healthy growth outlook. The US Purchasing Manager’s Index (PMI) was near peak levels, rising to 60.2% in June from 58.7% in May. The index has only exhibited slight volatility in response to trade developments over the past year. The Philadelphia Fed’s survey of business intentions, a good bellwether of future capital spending plans, has recently declined slightly from very healthy levels, perhaps in response to protectionist threats.

Eurozone PMIs continue to signal expansion but have consistently declined since the beginning of 2018. Earlier in July, we noted increased trade tensions have raised the risk that additional tit-for-tat measures could have a greater impact on global economic growth than those seen so far. This would particularly be the case given the fact that investment and net exports are key components of GDP.

According to the ISM, expansion in new orders, production and employment drove the increase in the June US PMI reading. Inventories continue to struggle to maintain expansion levels, as a result of supplier deliveries slowing further. Labor constraints and supply chain disruptions continue to limit full production potential and price increases across all industry sectors remain on the rise. Additional rounds of tariffs could place further upward pressure on input costs, disrupt supply chains and weaken manufacturing activity in the near-term.

Risks to Global Growth Rise as Trade Tensions Escalate

Increased trade tensions have raised the risk that new measures may be taken that would have a much greater impact on global economic growth than those enacted so far, Fitch Ratings says.

The US investigation into auto tariffs, possible additional US tariffs on Chinese imports, and the likely reactions of other countries and blocs, point to a potential serious escalation, albeit with an impact that falls short of across-the-board tariffs imposed on all major trade flows.

The US administration’s continuing focus on reducing bilateral trade deficits and the response by China, the EU, Canada and Mexico to existing measures, have increased tensions. So far the scale of tariffs imposed has been too small to materially affect our forecasts for world growth, as we noted in our most recent “Global Economic Outlook”. The additional tariffs raised are very small relative to the GDP of the affected countries and regions.

However, further measures mooted by the US would mark a significant escalation. The initiation of a Section 232 investigation into whether auto imports weaken the US economy and impair national security affects US imports of new cars and car parts that were worth USD322 billion last year. The threat of an additional USD200 billion of tariffs on Chinese imports could prompt China to apply tariffs to all imports of goods and services from the US, which were worth USD188 billion in 2017. China could also retaliate with non-tariff barriers.

It remains to be seen whether US announcements are simply negotiating positions that may be modified. But the detailed preparation of, and justification for, such measures and the possibility of instant and strong retaliation by trading partners present growing risks to trade. If tensions rise further, the US hardens its stance and fully withdraws from NAFTA (which is not our base case), this would magnify the impact. The imposition of high tariffs on US auto imports would represent an existential threat to NAFTA.

Table 2 outlines a scenario in which the US imposes auto tariffs at 25% and additional tariffs on China. Trading partners retaliate symmetrically – in line with their recent responses to US steel tariffs – and NAFTA collapses. This scenario coupled with the existing measures would affect close to USD2 trillion of global trade flows.

Our calculations are not behavioural estimates of the impact of tariffs on GDP, which would be highly dependent on the effect on trade volumes. Nevertheless, scaling the measures relative to the size of the economy helps us to compare outcomes with the trade war scenario analysis we carried out in our study “Global Macro Scenario: US Trade Protectionism and Retaliation” last year.

In this scenario, our calculations would imply a shock to US import prices around 35% to 40% of the size of the shock examined in the trade war scenario, in turn suggesting a potential impact on US GDP growth of around 0.5pp. This would be broadly consistent with some other estimates. The US Tax Foundation estimates that if all tariffs announced by the US and other jurisdictions were fully enacted, US GDP would fall by 0.44% in the long run.

Our base case remains that blanket geographical tariffs between major countries are unlikely, and this was reflected in our unchanged forecasts for global growth in June’s “Global Economic Outlook”. But the downside risks to global growth from trade policy have increased.

A major global tariff shock would have adverse supply side impacts, raising costs for importers and disrupting supply-chains, while reducing consumers’ real wages. The global multiplier effect of lower US imports could be significant. US outward FDI (the largest source of FDI globally) would probably fall. Along with weaker confidence and lower investment, a global tariff shock would also hit job creation.

Too Soon to Call China’s RRR Cut a Clear Sign of Easing

China’s two recent reserve requirement ratio (RRR) cuts amid slowing economic growth and rising trade risks have prompted market speculation that a new cycle of monetary easing is underway, but Fitch Ratings believes it is too early to conclude recent policy actions mark a clear reversion in stance.

A return to policy settings that add to the economy’s imbalances and vulnerabilities, such as credit stimulus, nevertheless remains a risk and could put downward pressure on China’s sovereign rating, as Fitch has previously stated.

The decision by the People’s Bank of China over the weekend to implement another 50bp RRR cut across much of the banking sector follows a targeted 100bp cut in April. The latest cut will release around CNY700 billion in reserves, effective on 5 July, bringing the combined net reserve injection to CNY1.1 trillion this year. The government has stressed that funds released by the latest cut should be used to support implementation of the debt-to-equity swap programme and small and micro-sized enterprise lending.

Fitch believes that the recent RRR cuts should be viewed in the context of liquidity management measures to ensure interbank funding conditions remain stable amid the ongoing crackdown on shadow banking. The authorities have previously relied on liquidity tools such as the medium-term lending facility, the pledged supplementary lending facility and the standing lending facility to provide liquidity in the face of weak base money growth, but an RRR cut should provide more permanent (and lower-cost) support. This should reduce liquidity risks for smaller banks, in particular, which are net liquidity takers and generally more reliant on shadow financing.

RRR cuts have previously coincided with policy loosening, but periods of clear easing (2008-2009, 2011-2012 and 2015) have also been marked by cuts to benchmark interest rates and a sustained decline in interbank rates, which have so far been absent (see chart). Meanwhile, the authorities continue to maintain a tighter bias towards macro-prudential policies and other financial regulations that aim to close regulatory loopholes, many of which are unlikely to be unwound at this stage, given the prominence the deleveraging campaign has taken at major policy meetings.

For now, Fitch’s expectation is that regulatory tightening will have a more powerful impact on credit growth than the additional liquidity generated by recent RRR cuts. Additionally, while further cuts are still possible, Fitch does not believe banks have sufficient capital to support aggressive asset expansion. That said, these adjustments do suggest that the authorities’ deleveraging drive has likely moved past its apex, and the swift deceleration in credit growth over the past year or so should soon begin to moderate.

Our baseline forecast is that GDP growth will slow during the second half of this year, due to deceleration in credit growth and a softening in the property market. Trade tensions with the US have not so far had a noticeable impact on exports, but could soon become a key policy consideration, given that a buoyant external environment has been an important contributor to China’s strong growth over the past year. If this dissipates, the authorities could be tempted to fall back on domestic stimulus to meet growth targets.

The authorities do have other policy tools beyond credit stimulus to shore up growth. Other forms of stimulus, including an on-balance-sheet fiscal stimulus, would not necessarily be ratings negative. Fitch estimates gross general government debt at less than 50% of GDP, in line with ‘A’ rated peers, which provides some room for fiscal easing. A recent State Council decision to lower taxes, which included a cut to value-added-tax rates, and plans to increase personal income tax deductions perhaps signal an initial step in that direction.