US GDP Higher In Q3

Real US gross domestic product increased at an annual rate of 3.5 percent in the third quarter of 2016, according to the “third” estimate released by the Bureau of Economic Analysis. In the second quarter, real GDP increased 1.4 percent.

The GDP estimate released today is based on more complete source data than were available for the “second” estimate issued last month. In the second estimate, the increase in real GDP was 3.2 percent. With this third estimate for the third quarter, nonresidential fixed investment, personal consumption expenditures (PCE), and state and local government spending increased more than previously estimated, but the general picture of economic growth remains the same.

Real GDP: Percent Change from Preceding Quarter

Real gross domestic income (GDI) increased 4.8 percent in the third quarter, compared with an increase of 0.7 percent in the second. The average of real GDP and real GDI, a supplemental measure of U.S. economic activity that equally weights GDP and GDI, increased 4.1 percent in the third quarter, compared with an increase of 1.1 percent in the second.

The increase in real GDP in the third quarter primarily reflected positive contributions from PCE, exports, private inventory investment, nonresidential fixed investment, and federal government spending that were partly offset by negative contributions from residential fixed investment. Imports, which are a subtraction in the calculation of GDP, increased.

The acceleration in real GDP in the third quarter primarily reflected an upturn in private inventory investment, an acceleration in exports, a smaller decrease in state and local government spending, an upturn in federal government spending, and a smaller decrease in residential investment, that were partly offset by a smaller increase in PCE and an acceleration in imports.

Current-dollar GDP increased 5.0 percent, or $225.2 billion, in the third quarter to a level of $18,675.3 billion. In the second quarter, current dollar GDP increased 3.7 percent, or $168.5 billion.

The price index for gross domestic purchases increased 1.5 percent in the third quarter, compared with an increase of 2.1 percent in the second quarter (table 4). The PCE price index increased 1.5 percent, compared with an increase of 2.0 ercent. Excluding food and energy prices, the PCE price index increased 1.7 percent, compared with an increase of 1.8 percent.
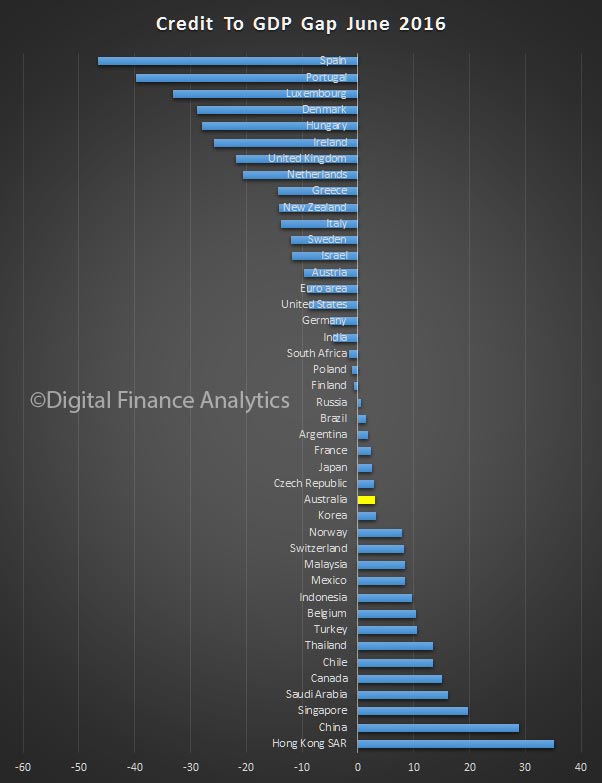
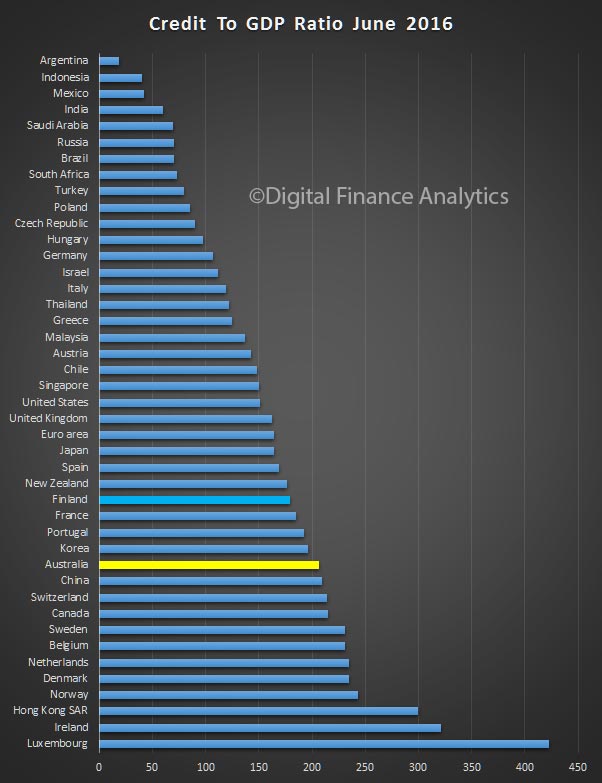
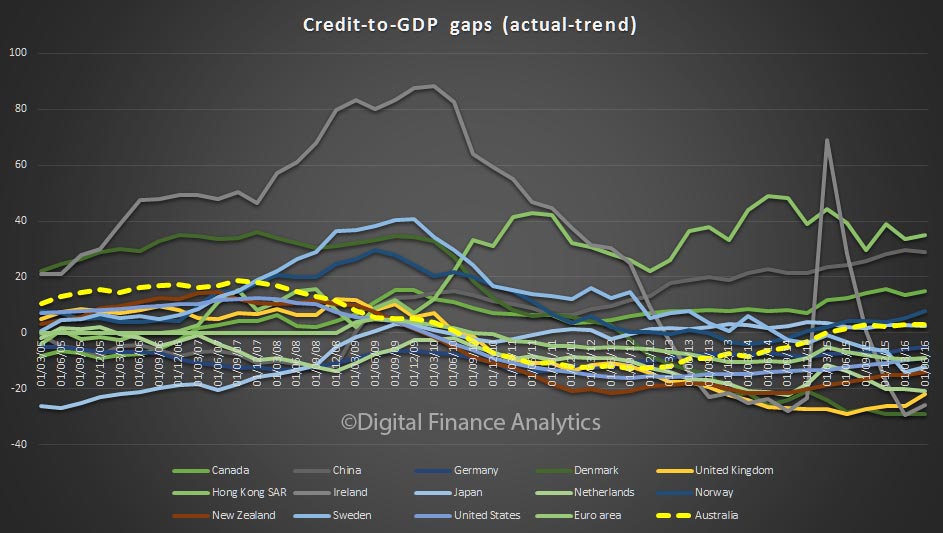
The Credit-to-GDP Gap – Early Warning Of Trouble Ahead?

The BIS has released their updated series on the Credit-to-GDP Gaps.  In essence, the bigger the gap the greater the concern. Specifically, the bigger the gap, the more likely it is regulators should be lifting counter-cyclical buffers when it comes to capital management and control.

The largest gaps are from Hong Kong, China. Singapore. Australia is up the list, behind Canada, but ahead of USA, UK and New Zealand.

Here are the raw GDP to Credit ratios. Australia sits behind China and Canada, but well ahead of USA, UK and New Zealand. We are at the higher risk end of the spectrum.

The Credit to GDP Gap trends over time also tell a story. Our gap is higher now, compared with the past few years. Again a signal of rising risks?

The BIS says:

The build-up of excessive credit features prominently in discussions about financial crises. While it is difficult to quantify “excessive credit” precisely, the credit-to-GDP gap captures this notion in a simple way. Importantly from a policy perspective, large gaps have been found to be a reliable early warning indicator (EWI) of banking crises or severe distress.

The published series cover 43 countries starting at the earliest in 1961.

The credit-to-GDP gap (gapt) is defined as the difference between the credit-to-GDP ratio (ct/yt) and its long-run trend tt.

Importantly, while the use of these total credit series as input data facilitates comparability across countries, it means that the credit-to-GDP gaps published by the BIS may differ from credit-to-GDP gaps considered by national authorities as part of their countercyclical capital buffer decisions. Given the EWI qualities of the gap, the indicator was adopted as a common reference point under Basel III to guide the build-up of countercyclical capital buffers (BCBS (2010)). Authorities are expected, however, to apply judgment in the setting of the buffer in their jurisdiction after using the best information available to gauge the build-up of system-wide risk rather than relying mechanistically on the credit-to-GDP guide. For instance, national authorities may form their policy decisions using credit-to-GDP ratios that are based on different data series from the BIS’s as input data, leading to credit-to-GDP gaps that differ from those published by the BIS.


Getting Government Debt In Perspective

A good piece in today’s The Conversation, examines the claim that the current government has lifted net government debt by $100 billion. This is proved to be correct, with caveats. However, some perspective is required in the debate. As highlighted in the piece, an important measure is debt to GDP. On that basis, on an international comparison, Australia is still well placed.

GDP Comparisons May 2016However, a recent report from LF Economics highlights that “while mainstream commentary and attention is firmly focused on public debt, the nation has accumulated a dangerously high level of private debt, including a moderately high level of external debt. Globally, Australia ranks near the top of indebted households. The exponential surge in mortgage debt issuance over the last two decades has generated the largest housing bubble in Australian economic history”. “Australia’s household debt ratio has grown above peaks established in countries where housing bubbles formed and burst, as in Ireland, Spain and the United States,” say report authors Philip Soos and Lindsay David. “So highly leveraged is the housing market that even small declines in residential land prices will have adverse consequences.”

Indeed, Australian households overtook the Swiss as the world’s most indebted this year, with outstanding debt equivalent to 125 per cent of GDP and no let up in sight. Combined owner-occupier and investor loans outstanding have risen from $1.2 trillion to $1.6 trillion in the past five years.

Here is the problem, the economic growth is being stoked by ever higher household debt, which is unsustainable. Why are we not getting better political discussion on this much more important issue during the election? The current economic path which has been set is unsustainable. The chart below makes the point – private debt should be the focus.

Australian Debt By CategoryAs we highlighted from the recent RBA chart pack, household debt to income is also sky high.

household-financesAnd here is data (from 2014) from the OECD showing the relative ratio of household debt to disposable income for Australia,  in comparison with other countries.

OECD-Debt-To-IncomeThe issue we SHOULD be talking about is the household debt overhang, and how we are going to deal with it. Government debt, in comparison is a side-show!

GDP 3.1% But…

Latest ABS data shows that growth in the quarter was a strong 1.1% making an annual seasonally adjusted rate of 3.1%. However, the Net National Disposable Income (NNDI) measure shows another fall.

GDP-and-NNI-March-2016In other words, whilst we are exporting more volume – and this quarter liquid natural gas was a stand-out, this greater activity did not translate to national or household income. In fact, this continues to fall, as previously shown by the stagnant growth in real incomes. The Australian economy may be running fast, but is not creating more wealth for its residents. Not a pretty picture.

Standing back, you have to question whether GDP is a very useful measure in the current environment. I am sure there will be many who will use it to “prove” the economic miracle continues, but the truth is much more complex. In addition, GDP is decoupled from inflation when the main driver is exports, so this gives the RBA a headache as well. Cutting rates further is unlikely to address this problem.

The ABS said that the March quarter 2016 National accounts show the Australian economy growing by 1.1% in seasonally adjusted chain volume terms. The major driver of economic growth this quarter came from Exports which contributed 1.0 percentage point and Household final consumption expenditure contributing 0.4 percentage points.

The increase in Exports is reflected in the growth observed in Mining production (6.2%). Growth was also observed in the service industries of Financial and insurance services (1.8%), Accommodation and food services (1.5%), and Arts and recreation services (0.9%).

The largest detractor from growth was Private gross fixed capital formation which fell 2.2%, this was driven by falls in New engineering construction (-6.4%) and New buildings (-6.9%).

The Terms of trade fell by 1.9%, reflecting a fall in the price of exports relative to the price of imports.


Upside To GDP Likely

Latest data suggests that the GDP number will be higher than expected – with a 1.1% growth, compared with an expected 0.7%. If so, then momentum is stronger than  many thought, and it may require some revisions to expectations.

The current account deficit decreased $1,837 million (eight per cent) to $20,794 million in the March quarter 2016 in seasonally adjusted, current price terms, according to latest figures from the Australian Bureau of Statistics (ABS).

Exports of goods and services fell $578 million (one per cent) and imports of goods and services fell $3,402 million (four per cent). The primary income deficit rose $979 million (nine per cent).

In seasonally adjusted chain volume terms, the net goods and services surplus rose $4,731 million (60 per cent) to $12,611 million in the March quarter 2016. This is expected to contribute 1.1 percentage points to growth in the March quarter 2016 volume measure of Gross Domestic Product.

Australia’s net International Investment Position was a liability of $1,012.1 billion at 31 March 2016. This was an increase of $51.4 billion (five per cent) on the revised 31 December 2015 position of $960.8 billion. Australia’s net foreign debt liabilities increased $9.2 billion (one per cent) to a net liability position of $1,027.8 billion. Australia’s net foreign equity assets decreased $42.2 billion (73 per cent) to a net asset position of $15.7 billion at 31 March 2016.

GDP Below Expectations At 0.2% SA In June

The ABS released their data today showing that in the June 2015 quarter national accounts, growth in the Australian economy slowing to 0.2% in seasonally adjusted chain volume terms and 2% over the past year. It was 0.5% in trend terms, our preferred measure (given recent statistical volatility), making an annual rate of 2.2%.

GDP-Trend-June-2015The ABS showed that reduced Mining and Construction activity, coupled with a decline in Exports were the main factors to the slowdown in economic growth. Positive contributions came from Domestic final demand, and the Financial, Transport and Health industries. Mining production fell significantly this quarter (-3.0%), although it is still positive through the year with growth at 2.1%. The decline in Mining production coincides with the fall in Exports. Net exports detracted 0.6 percentage points from GDP growth in the quarter, through the year they added 1.1 percentage points to GDP growth. This quarter continues to see the decline in mining related construction (Engineering construction -0.8%), which is reflected in the decline in Construction Gross value added (-0.6%).

There was positive growth in Domestic final demand with Household final consumption growing 0.5% this quarter and 2.5% through the year. Government final consumption had growth of 2.2% for the quarter and 4.0% through the year. Public gross fixed capital formation was up 4.0% for the June 2015 quarter, but remains subdued through the year with growth at 0.4%.


GDP Beats Expectations In March Quarter

Latest Australian Bureau of Statistics (ABS) figures show that GDP, in seasonally adjusted chain volume terms, grew 0.9 per cent in the March quarter 2015. The consensus expectation was 0.7%.

GDPMar2015Chain

Trend GDP growth was 0.6% in the last quarter, making an annual 2.2%.

GDPMarch2015Annual Net exports contributed 0.5 percentage points to GDP growth. Household final consumption expenditure and Changes in inventories each contributed 0.3 percentage points to GDP growth. This was offset by a -0.3 percentage point contribution from Gross fixed capital formation.

The industries which drove GDP growth in the March quarter were Mining and Financial and insurance services. Mining contributed 0.3 percentage points and Financial and insurance services contributed 0.2 percentage points.

The March quarter saw the Terms of trade decrease 2.9 per cent in seasonally adjusted terms.


GDP Trend Down to 0.4% In December Quarter

The ABS data shows that in trend terms, GDP increased 0.4% in the December quarter 2014. This gives an annual read of 2.3% in trend terms. We need policy changes to get industry to invest and grow. we cannot rely on household expenditure and property speculation to do the job. This gives weight to lower interest rates further, but only if the property sector can be controlled first.

GDPDec2014Gross value added per hour worked in the market sector grew 0.1% and the Terms of trade fell 1.9%. In seasonally adjusted terms, GDP increased by 0.5% in the December quarter, giving an annual rate of 2.5%. The Terms of trade decreased 1.7%, and Real gross domestic income increased 0.2%.

In seasonally adjusted terms, the main contributors to the increase in expenditure on GDP were Net exports (0.7 percentage points) and Final consumption expenditure (0.6 percentage points). The main detractor was Changes in inventories (-0.6 percentage points).

In seasonally adjusted terms, the main contributors to GDP growth were Construction and Health care and social assistance each contributing 0.1 percentage points to the increase in GDP. The main detractor to growth in GDP was Professional, scientific and technical services (-0.1 percentage points).

Why A Larger Finance Sector Is Killing The Economy

The Bank for International Settlements released a paper “Why does financial sector growth crowd out real economic growth?” The paper suggests that rather than encouraging a bigger banking sector, we should be careful because a larger finance sector actually kills growth in the real economy. That is an important insight, given that in Australia, the ratio of bank assets to GDP is higher than its ever been, and growing, at a time when economic growth in anemic.

GDP-to-Bank-Assets-Sept-2014Other countries have significantly higher ratios. The mythology that a bigger banking sector is good for Australia should be questioned. At a time when banks are growing in Australia, thanks to high house prices and lending, inflating their size, we should be looking hard at these findings, because if true, we are on the wrong track.

The purpose of this paper is to examine why financial sector growth harms real growth. We begin by constructing a model in which financial and real growth interact, and then turn to empirical evidence. In our model, we first show how an exogenous increase in financial sector growth can reduce total factor productivity growth. This is a consequence of the fact that financial sector growth benefits disproportionately high collateral/low productivity projects. This mechanism reflects the fact that periods of high financial sector growth often coincide with the strong development in sectors like construction,  where returns on projects are relatively easy to pledge as collateral but productivity (growth) is relatively low.

Next, we introduce skilled workers who can be hired either by financiers to improve their ability to lend, increasing financial sector growth, or by entrepreneurs to improve their returns (albeit at the cost of lower pledgeability). We then show that when skilled workers work in one sector it generates a negative externality on the other sector. The externality works as follows: financiers who hire skilled workers can lend more to entrepreneurs than those who do not. With more abundant and cheaper funding, entrepreneurs have an incentive to invest in projects with higher pledgeability but lower productivity, reducing their demand for skilled labour. Conversely, entrepreneurs who hire skilled workers invest in high return/low pledgeability projects. As a result, financiers have no incentive to hire skilled workers because the benefit in terms of increased ability to lend is limited since entrepreneurs’ projects feature low pledgeability. This negative externality can lead to multiple equilibria. In the equilibrium where financiers employ the skilled workers, so that the financial sector grows more rapidly, total factor productivity growth is lower than it would be had agents coordinated on the equilibrium where entrepreneurs attract the skilled labour. Looking at welfare, we are able to show that, relative to the social optimum, financial booms in which skilled labour work for the financial sector, are sub-optimalwhen the bargaining power of financiers is sufficiently large.

Turning to the empirical results, we move beyond the aggregate results and examine industry-level data. Here we focus on manufacturing industries and find that industries that are in competition for resources with finance are particularly damaged by financial booms. Specifically, we find that manufacturing sectors that are either R&D-intensive or dependent on external finance suffer disproportionate reductions in productivity growth when finance booms. That is, we confirm the results in the model: by draining resources from the real economy, financial sector growth becomes a drag on real growth.

Their conclusions are important.

First, the growth of a country’s financial system is a drag on productivity growth. That is, higher growth in the financial sector reduces real growth. In other words, financial booms are not, in general, growth-enhancing, likely because the financial sector competes with the rest of the economy for resources. Second, using sectoral data, we examine the distributional nature of this effect and find that credit booms harm what we normally think of as the engines for growth – those that are more R&D intensive. This evidence, together with recent experience during the financial crisis, leads us to conclude that there is a pressing need to reassess the relationship of finance and real growth in modern economic systems.


GDP 0.3% In Sept Quarter

The ABS published their data to September 2014 in the National Accounts. GDP, in seasonally adjusted chain volume terms, grew 0.3 per cent in the September quarter 2014.  This number is significantly below analysts’ expectations which was in the order of 0.7 per cent in the quarter and also is a drop from the relatively weak 0.5% growth recorded in June.This translates to 2.7 per cent for the 12 months to September 2014.

Net exports contributed 0.8 percentage points to GDP growth. Household final consumption expenditure contributed 0.3 percentage points to GDP growth and Government final consumption expenditure contributed 0.1 percentage points to GDP growth. This was offset by a -0.7 percentage point contribution to GDP growth from total Gross fixed capital formation and a -0.1 percentage point contribution from Changes in inventories.

The Terms of trade decreased 3.5%, and Real gross domestic income decreased 0.4%. In seasonally adjusted terms, the main contributors to the increase in expenditure on GDP were Net exports (0.8 percentage points) and Final consumption expenditure (0.4 percentage points) The main detractors were Private gross fixed capital formation (-0.5 percentage points) and Public gross fixed capital formation (-0.2 percentage points).

GDPSep2014In seasonally adjusted terms, the main contributor to GDP growth was Financial and insurance services (0.2 percentage points), with Mining and Information media and telecommunications each contributing 0.1 percentage points to the increase in GDP. The main detractors to growth in GDP were Construction (-0.2 percentage points) and Professional, scientific and technical services (-0.2 percentage points).

The AU – US rate dropped below 84c on the news.

USAUDDec2014