Households Under The Pump According To ABS

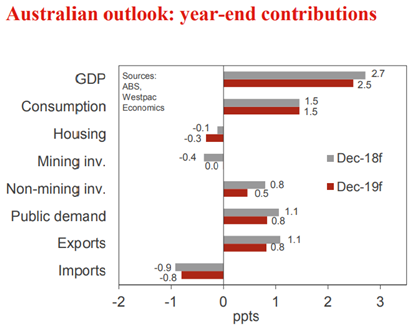
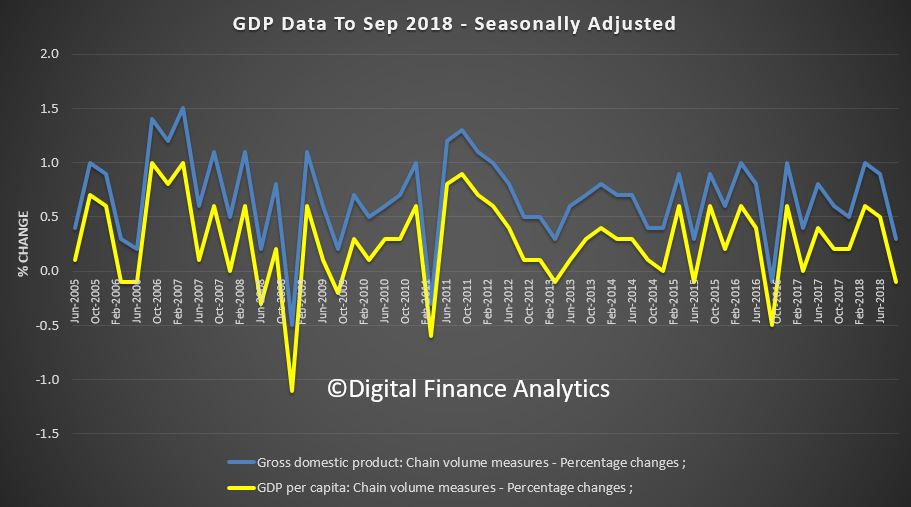
The Australian economy grew 0.3 per cent in seasonally adjusted chain volume terms in the September quarter 2018, according to figures released by the Australian Bureau of Statistics (ABS) today.  But this was below expectations, and confirms the weaker performance of the economy. The household sector contribution is weakening, on the back of the weaker housing market, weak wages growth and higher costs.  Government spending and commodity prices helped support the weaker numbers.

The RBA was forecasting an annual 3.5% to December 2018, based on the recent Statement on Monetary Policy. With the first three quarters of the year reaching just 2.2%, it would require a December quarter of 1.3%, which seems unlikely.   So they will need to adjust their forecasts down.

All this looks to signal RBA cash rate cuts ahead.

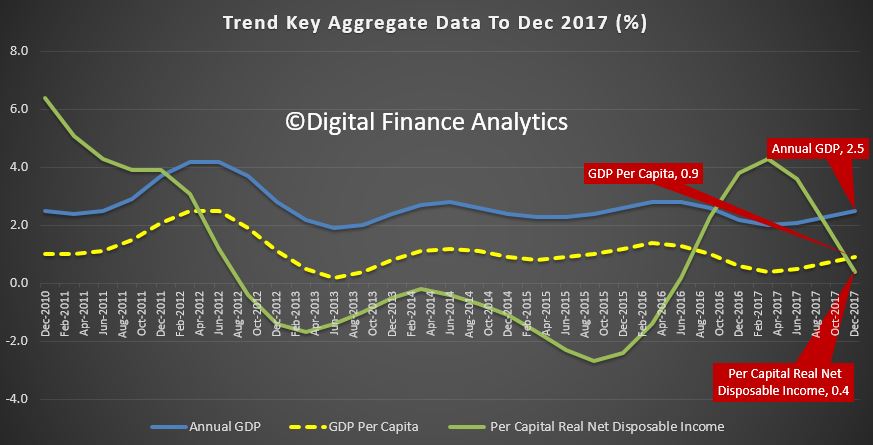
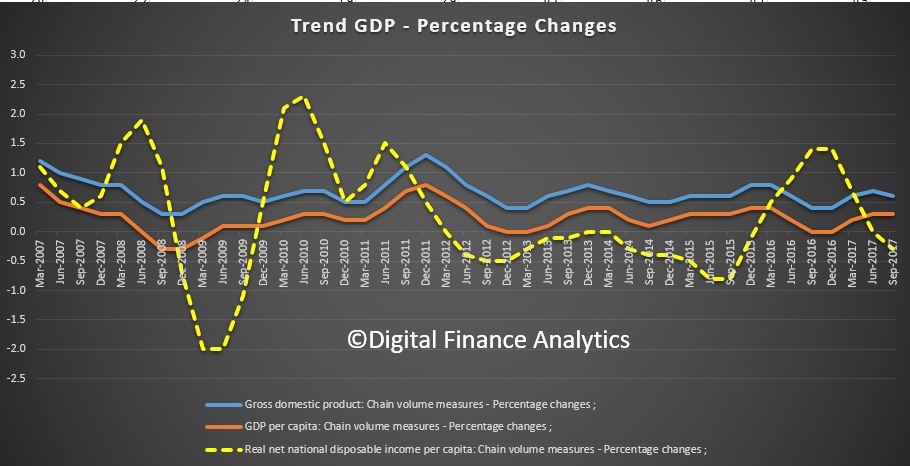
In addition, the per-capita data went negative in September at – 0.1 % meaning that it is population growth alone which is responsible for lifting the GDP.

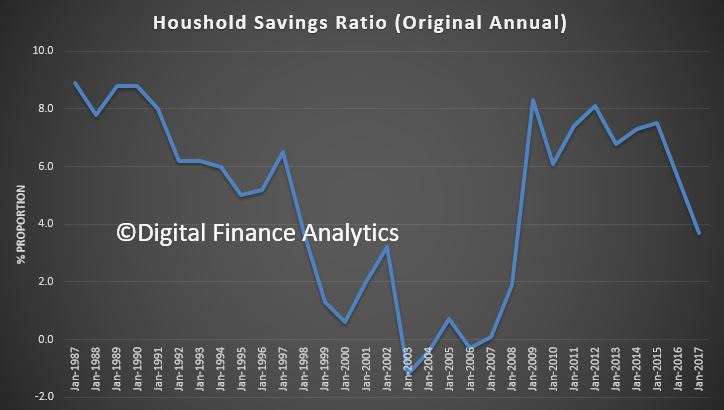
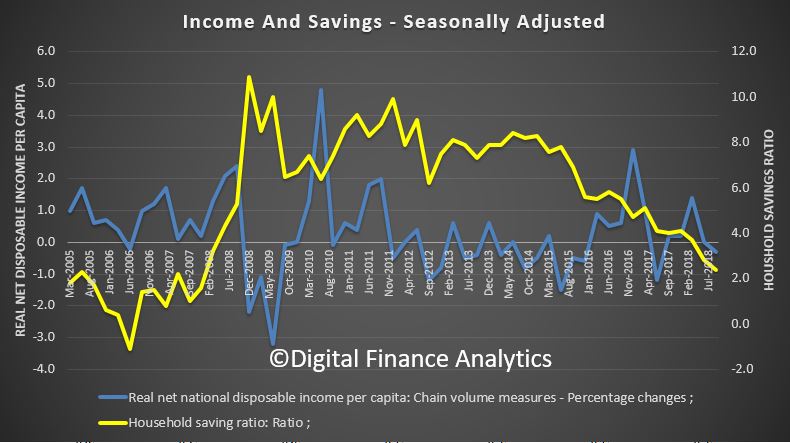
The per capita income and savings ratios also were negative, with the savings ratio back to lows not seen since 2007, as people dip into reserves to maintain lifestyle and pay the bills – as expected given our household financial confidence index.

And net disposable income per capita fell 0.3% in the last quarter.

We continue to see the economy quite differently from the RBA’s rose tinted windows in Martin Place.  Had it not been for strong commodity prices the story would have been worse still.  But the household sector growth engine is misfiring badly now, as the markets have recognised.

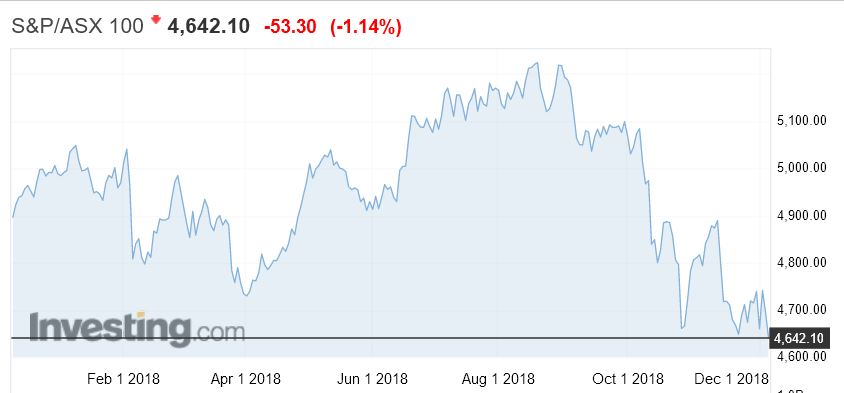
The ASX was down 1.14% at lunchtime to 4,642 on the back of the weak GDP and falls overnight on Wall Street.

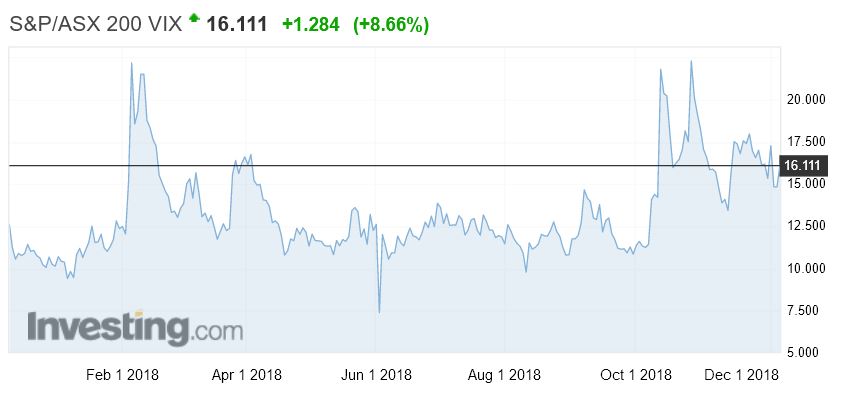
The local fear index was higher, up 8.66% t0 16.11, indicating increasing uncertainty.

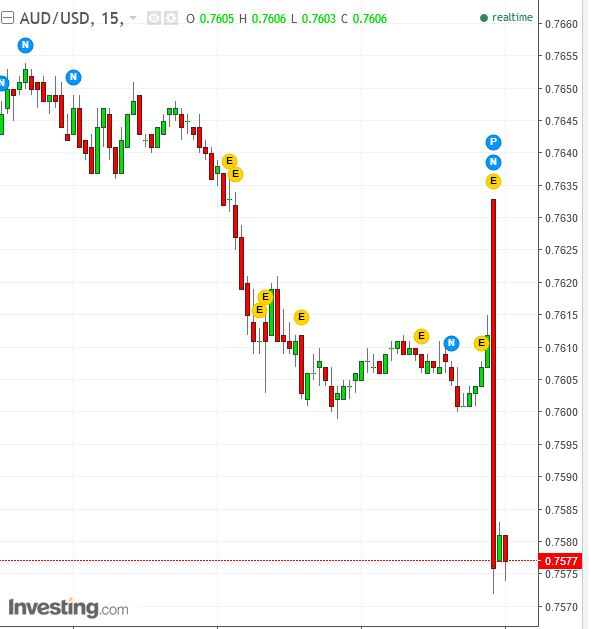
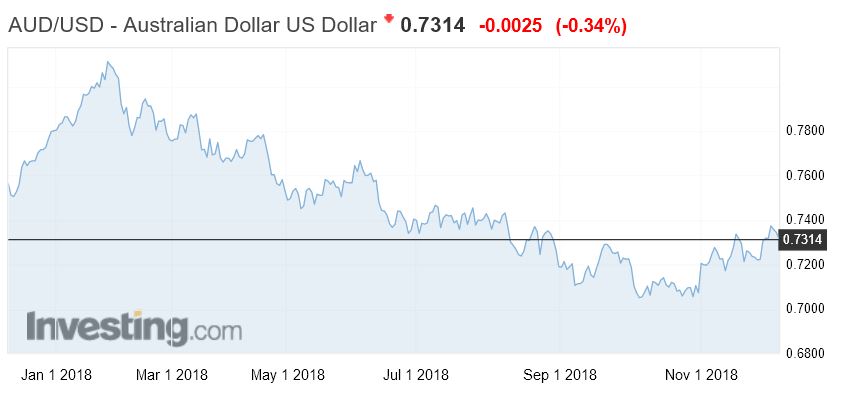
The Aussie slide against the USD, down 0.34% to 73.14.

And the DOW was down 3.1% overnight, on renewed fears about US recession as the yield curve inversion looks more likely, and trade talks with China continue, and Bexit uncertainty grows.

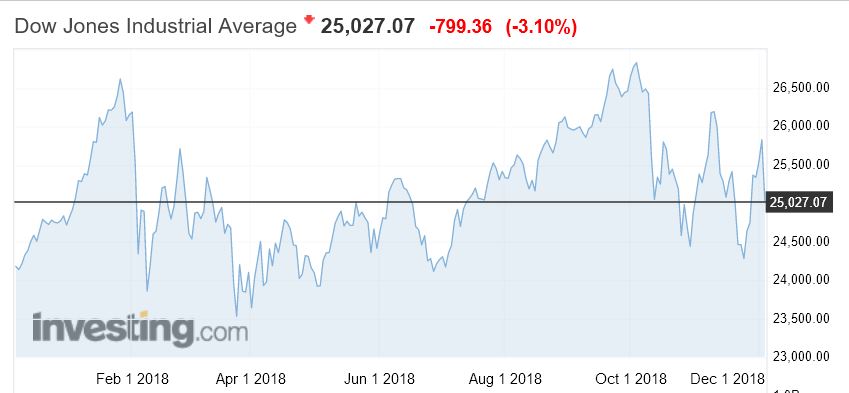
Signals from the Federal Reserve last week that it may be nearing an end to its three-year rate hike cycle has pushed the 10-year U.S. Treasury yield to three-month lows below 3 percent. The spread between the two-year and 10-year Treasury yields was at its flattest level in over a decade.

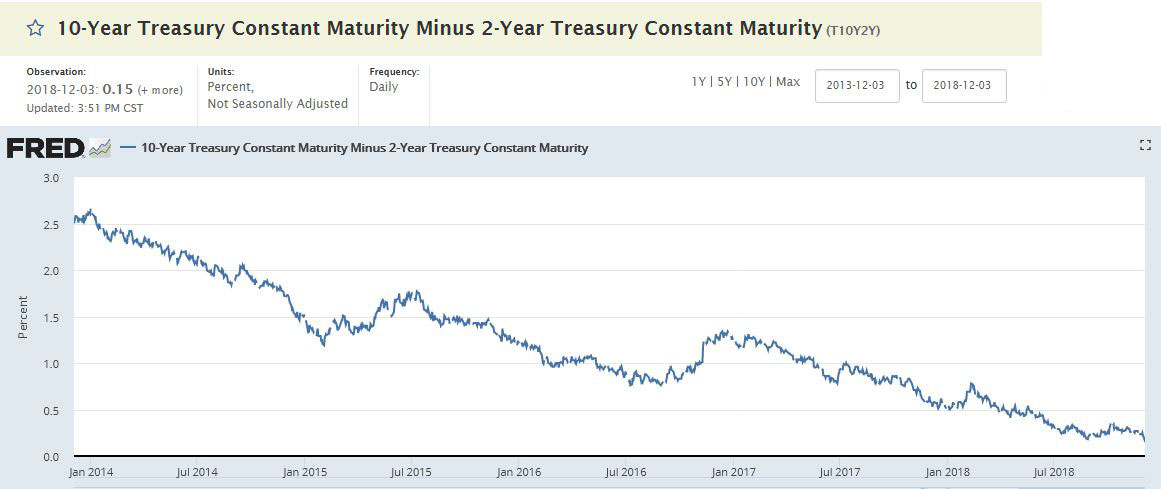
Concerns about slowing U.S. growth have accelerated the flattening of the yield curve, a phenomenon in which longer-dated debt yields fall faster than their shorter-dated counterparts.

A flatter curve is seen as an indicator of a recession, with lower longer-dated yields suggesting that the markets see economic weakness ahead.

This is what the ABS said:

ABS Chief Economist, Bruce Hockman, said: “The household sector drove domestic growth with increased consumption supported by moderate rises in household income.”

Household consumption rose 0.3 per cent driven by non-discretionary spending on food and housing. Spending on discretionary items slowed during the quarter. Household gross disposable income continued to grow at a slow pace due to moderate growth in household income being partially offset by a rise in income tax payable.

The subdued growth in gross disposable income coupled with an increase in household consumption resulted in the household saving ratio declining to 2.4 per cent in the September quarter. This is the lowest saving rate since December 2007.

Compensation of employees increased across all states and territories with the exception of the Northern Territory. “The increase in wages was consistent with strong employment growth as reported in the latest ABS Labour Force data, as well as a lift in wage rates.” Mr Hockman added.

Public spending was funded through increased revenue. General government final consumption expenditure increased 0.5 per cent underpinned by continued expenditure in health, aged care and disability services. Public investment remained at high levels with continued work on a number of large infrastructure projects around the nation.

Health care and social assistance output also recorded strong growth reflecting ongoing public investment in health care. Growth was also observed in services industries supporting infrastructure projects. Professional, scientific and technical services, Rental, hiring and real estate services and Administrative and support services all recorded growth during the quarter.

Economy grew 0.9 per cent in June quarter

The Australian economy grew 0.9 per cent in seasonally adjusted chain volume terms in the June quarter 2018, according to figures released by the Australian Bureau of Statistics (ABS) today.

New dwelling investment continued to prop up the numbers, along with government and domestic consumption.

But the two key, and concerning trends are a significant fall in the households savings ratio (as they dip into them to support their spending), and the slower GDP per capita growth, which shows that much of the GDP momentum is simply population related. This is based in trend data.

Plus, real national disposable income per capita fell by 0.2% over the quarter though it was up 2.1% over the year. And average remuneration per employee rose by only 1.7% in the year to June, so remains underwater after adjusting for inflation (2.1%).  Households remain under the gun.

Of course GDP is a really poor set of measures by which to assess the economy in any case….

Chief Economist for the ABS, Bruce Hockman, said: “Growth in domestic demand accounts for over half the growth in GDP, and reflected strength in household expenditure.”

Domestic demand increased 0.6 per cent for the quarter, driven by a 0.7 per cent growth in household consumption, with increased expenditure on both discretionary and non-discretionary goods and services.

General government final consumption expenditure increased 1.0 per cent in the June quarter. Public investment remained at elevated levels reflecting continued work on infrastructure projects across the nation.

Investment in new dwellings increased 3.6 percent for the quarter. with strength observed in Victoria and South Australia. This strength was reflected in the Construction industry, which grew 1.9 per cent for the quarter.

Compensation of employees (COE) grew 0.7 per cent for the quarter due to a rises in the number of wage and salary earners and wage rates. COE growth was prominent in the Health Care and Social Assistance industry.

Moderate growth in household disposable income coupled with strength in household consumption resulted in a decline in the household saving ratio to 1.0 per cent, recording its lowest rate since December 2007.

Strong Australian GDP growth won’t last

Though Australia’s economic growth is currently being buttressed by a number of global and domestic factors, a number of weaknesses will see GDP growth drop back below trend by the end of next year, says Westpac via InvestorDaily.

According to Westpac’s June market outlook report, the 1 per cent GDP growth recorded in the first quarter of 2018 was an “above trend outcome” and “further confirmation that the Australian economy performed solidly over the past year”.

But report co-author and senior economist Andrew Hanlan indicated that this growth would not be sustained in the years ahead.

“Areas of weakness persist and are likely to weigh on the outlook,” Mr Hanlan wrote.

The current growth was being sustained by a cluster of both global and domestic forces, such as global growth which grew 0.6 per cent to 3.8 per cent in 2017, “the strongest pace since 2011”.

“We expect world growth to hold around this 3.8 per cent pace in 2018, supported by the US. However, conditions in China are likely to moderate,” the senior economist noted.

Furthermore, drags on commodity prices and mining investment had minimised, though “not quite complete”.

Other growth drivers such as public demand (that is, activity or investment undertaken by the public sector or government), business construction and exports had also pushed up growth, according to Mr Hanlan.

However, a number of weaknesses persist, particularly regarding consumer spending – which was “choppy”, “slightly below trend” and unsustainable – and housing.

“The consumer is vulnerable at a time of weak wages growth, high debt levels and slipping house prices,” with falling house prices potentially resulting in “negative spill-overs for consumer demand”.

“The housing sector is cooling as lending conditions tighten, with prices easing back from recent highs,” Mr Hanlan added.

Furthermore, jobs growth has slowed and home building activity shrank by 5 per cent in 2017.

“We expect GDP growth to moderate to 2.7 per cent in the year to December 2018 and then slip to a below trend 2.5 per cent for December 2019.”

Economy Grows 0.4 per Cent in December Quarter

The ABS has released the account aggregates to December 2017.  Overall the trend data on an annualised basis is still pretty weak. GDP has moved up just a tad, but GDP per capital is growing at 0.9% per annum, and continues to fall. Much of the upside in to do just with population growth. But net per capital disposable income rose at just 0.4% over the past year. Housing business investment and trade were all brakes on the economy.

These are not indicators of an economy in prime health!

Real remuneration is still growing at below inflation, so incomes remains stalled. More than two in three households have seen no increase. It rose by 0.3% in the December quarter and was up just 1.3% over the year to December 2017, compared with inflation of 1.9%.

In fact households continue to raid their savings to support a small increase in consumption, but this is not sustainable.  The household savings ratio recovered slightly to 2.7% from 2.5% in seasonally adjusted terms. Debt remains very high.

The Australian economy grew 0.4 per cent in seasonally adjusted chain volume terms in the December quarter 2017, according to figures released by the Australian Bureau of Statistics (ABS) today.

Chief Economist for the ABS, Bruce Hockman, said: “Growth this quarter was driven by the household sector, with continued strength in household income matched by growth in household consumption.”

Compensation of employees (COE) increased 1.1 per cent in the December quarter, the fourth consecutive quarter of solid growth. “The increase in wages is consistent with stronger employment data reported in Labour Force, as well as a lift in the growth rate in the wage price index observed over the past two quarters.” Mr Hockman added.

Household consumption rebounded to 1.0 per cent this quarter with strength recorded in discretionary spending on hotels, cafés and restaurants and recreation and culture. Private investment detracted from growth due to a decline in dwellings and a sharp fall in new engineering construction. However, private investment in machinery and equipment remained strong, as did construction of non-residential buildings.

Net trade detracted from growth due to declines in exports of rural goods, transport equipment and travel services. This is reflected in the Agriculture and Manufacturing industries which were the largest detractors from GDP this quarter. Healthcare and service based industries continued to grow reflecting increased demand from the household sector.

GDP – Not Fit For Purpose In The Digital Era

From The IMF Blog.

Gross domestic product, or GDP, has been used to measure growth since the Second World War when economies were all about mass production and manufacturing. In this podcast, economist Diane Coyle, says GDP is less well suited to measure progress in today’s digital economy.

“I think the issue for GDP comes if the pace or scope of innovation is changing as much as it seems to be at the moment,” says Coyle. “So, that gap between what we’re measuring and the welfare effect seems quite large.”

Coyle, Professor of Economics at the University of Manchester in the United Kingdom, says while economists argue GDP was never meant to measure welfare, nearly everyone assumes it does just that.

“GDP is shorthand for welfare,” says Coyle. “So, if it’s becoming a less good indicator, that really matters.”

Another aspect of the economy that Coyle says GDP misrepresents is productivity. With all the technological advances in recent years one would expect that economies have become more productive. But GDP suggests the opposite is true. Coyle refers to this phenomenon as the productivity puzzle and says the mismeasurement of digital activities within the economy has a lot to do with it.

Coyle also emphasizes the role of official statistics in measuring productivity and growth. She says companies that are making huge profits from mining big data have a responsibility to share their data with governments. Because the purpose of official statistics is to enable governments to better run their countries.

“It’s part of the social contract,” says Coyle. “If you are a successful company taking advantage of the legal system, the infrastructure and public facilities in a country, then it’s just part of the deal that you cooperate with the statistical agencies.”

You can listen to the podcast HERE

You can also watch the webcast of Diane Coyle speaking at the IMF Statistical Forum on Measuring the Digital Economy.

Diane Coyle is author of GDP A Brief but Affectionate History

GDP Sags Below Expectation In September 2017

The ABS released the National Accounts to September 2017 today.  The expectation was a 0.7% lift in GDP, but it came in 0.6%. This gives an annual read of 2.3%, well short of the hoped for 3%+. Seasonally adjusted,  growth was 2.8%. Business investment apart, this is a weak and concerning result.  The terms of trade fell.

The GDP per capita and net disposable income per capita both fell, which highlights the basic problem the economy faces.  The dollar fell on the news.

Actually, we need to reboot our thinking on economic progress, as a quest for continual growth on the current settings will lead us into the gutter. Time for some fresh ideas. But then it seems that the alignment between potential growth, and lifts in tax take which follow makes this difficult.

The Australian economy grew 0.6 per cent in seasonally adjusted chain volume terms in the September quarter 2017, according to figures released by the Australian Bureau of Statistics (ABS) today.

Chief Economist for the ABS, Bruce Hockman, said: “Increased activity in both private business investment and public infrastructure underpinned broad growth across the industries.”

Compensation of employees (COE) increased in all states and territories, resulting in a national quarterly growth of 1.2 per cent and growth of 3.0 per cent since the September quarter 2016. Despite higher household income, household consumption was weak at 0.1 per cent, in line with the retail trade estimates. This weak household spending combined with growth in household income resulted in an increase in the household saving ratio for the first time in five quarters.

Mr Hockman added: “The increase in wages was consistent with the stronger employment and hours worked data that has been reported in the labour force survey.”

Net exports contribution to growth was flat this quarter despite higher Mining production and exports of coal and iron ore. The terms of trade fell 0.4 per cent on the back of lower export prices.

17 out of 20 industries recorded positive growth this quarter driven by Professional, Scientific and Technical Services, Health Care and Social Assistance and Manufacturing. A longer-term analysis of the changing drivers of the economy, from an industry perspective, is provided in a feature article included in this quarter’s publication.

Current account deficit increases to $9.6 billion

Lower export commodity prices contributed to the widening of the current account deficit in the June quarter 2017, according to latest figures from the Australian Bureau of Statistics (ABS).

The seasonally adjusted current account deficit rose $4,808 million to $9,562 million in the June quarter 2017. In seasonally adjusted terms, the balance on goods and services surplus in the June quarter 2017 was $3,070 million. Exports of goods and services fell $2,693 million (3 per cent) and imports of goods and services rose $1,640 million (2 per cent). The primary income deficit widened $499 million.

In volume terms, exports grew faster than imports this quarter and as a result international trade is expected to contribute 0.3 percentage points to growth in the June quarter 2017 Gross Domestic Product. In seasonally adjusted chain volume terms, the balance on goods and services deficit decreased $1,363 million to a deficit of $196 million.

Australia’s net international investment position was a liability of $1,000.3b at 30 June 2017, a decrease of $24.4 billion (2 per cent) on the revised 31 March 2017 position of $1,024.6 billion.

Australia’s net foreign debt liability decreased $21.2 billion (2 per cent) to a net liability position of $990.6 billion. Australia’s net foreign equity liability decreased $3.2 billion (25 per cent) to a net liability position of $9.7 billion at 30 June 2017.

Hard Data, Soft Data and Forecasting

From The St. Louis Fed on The Economy Blog.

People frequently scour economic data for clues about the direction of the economy. But could the many types of data cause confusion on what exactly the state of the economy is? A recent Economic Synopses essay examined some of this potential confusion.

Business Economist and Research Officer Kevin Kliesen noted that data essentially fall into two camps:

  • Hard data, such as that from government statistical agencies used in constructing real gross domestic product (GDP)
  • Soft data, such as business, consumer confidence and sentiment surveys, financial market variables, and labor statistics

Kliesen crafted two index measures of these types of data, which can be seen in the figure below.1 He noted that these indexes could be useful for quantitatively showing how different types of data can influence forecasts of real GDP and, in turn, the expectations of policymakers.

hard soft data

“The indexes exhibit the normal cyclical behavior one would expect in the data: They increase in expansions and decrease in recessions,” Kliesen wrote.

He also noted that the hard data index showed stronger economic conditions from around the beginning of the recent recovery until late 2013. More recently, however, the soft data index is showing stronger economic conditions.

Effect on Forecasts

To show the possible effects of favoring one type of data when forecasting, Kliesen ran forecasts of monthly real GDP growth using only hard data and using only soft data:

  • Forecasting growth using the hard data resulted in projected growth of a little more than 2 percent per quarter through the end of 2019.
  • Using soft data, however, resulted in a peak of a little more than 4 percent in early 2018.

He then compared the results with the consensus forecasts found in the Federal Reserve Bank of Philadelphia’s Survey of Professional Forecasters (SPF) and the Federal Open Market Committee’s (FOMC’s) Summary of Economic Projections (SEP). The results are in the table below.

Forecasts for Real GDP
Percent Changes, Q4/Q4
Hard Data Soft Data SPF SEP
2017:Q4 1.9 3.9 2.3 2.1
2018:Q4 2.2 2.9 2.4 2.1
2019:Q4 2.4 2.5 2.6 1.9
NOTES: The SEP values are taken from the March 15 release and are Q4/Q4. The SPF values use average annual data and are taken from the Feb. 10 issue.
Federal Reserve Bank of St. Louis

Kliesen concluded by saying that most forecasters and FOMC policymakers have relied more on hard data when forecasting. He wrote: “This is probably prudent, since the hard data flows are used in most macroeconomic forecasting models.”

He also noted: “However, as the upbeat forecasts from the soft data show, there appears to be some upside risk to the near-term forecast for real GDP growth. This upside risk likely reflects the widespread expectation of expansionary fiscal policy and a strengthening in global growth.”

Economy grows 1.1 per cent in December quarter

So Australia dodged the “recession bullet” thanks to a rebound in the December quarter. It was helped by resources sector income from higher prices especially coal and iron ore,  households who raided their savings to lift expenditure over the Christmas season, and Government sector infrastructure spending.

But the underlying contribution from business excluding resources looks weak, and it seems the whole confection of managing the mining sector slow-down by stoking the housing sector is to be questioned.  Growth at 2.4 per cent is lower than the 3 per cent plus target.  Low interest rates are not encouraging business to invest. Even lower rates won’t help.  Low wage growth is part of the problem, but it is a symptom of underlying disease.

Data from the Australian Bureau of Statistics (ABS) shows that the Australian economy recorded broad-based growth of 1.1 per cent in seasonally adjusted chain volume terms in the December quarter 2016, a rebound from the previous quarter’s decline of 0.5 per cent,  Australia’s Gross Domestic Product (GDP) has now grown 2.4 per cent through the year.

Growth was recorded in 15 out of 20 industries. Strongest growth was observed in Mining, Agriculture, forestry and fishing, and Professional scientific and technical services, each industry contributed 0.2 percentage points to GDP growth.

Household final consumption expenditure contributed 0.5 percentage points to GDP growth. Net exports contributed 0.2 percentage points. Public and private capital formation both contributed 0.3 percentage points this quarter after both detracted from GDP growth last quarter.

The Terms of trade grew by 9.1 per cent in the December quarter due to strong price rises in Coal and Iron ore. The terms of trade is now 15.6 per cent higher than December quarter 2015. Nominal GDP grew by 3.0 per cent to be 6.1 per cent higher through the year. Real net national disposable income increased by 2.9 per cent for the quarter.

The strength in commodity prices helped drive a 16.5 per cent increase in Private non-financial corporation’s Gross operating surplus. Compensation of employees decreased 0.5 per cent for the quarter to be 1.5 per cent higher through the year. This is in line with the subdued wage price index (1.9 per cent through the year) and employment growth (0.7 per cent through the year) previously published by the ABS.

Real US GDP Drops in 4Q – Initial Estimate

US Real gross domestic product (GDP) increased at an annual rate of 1.9 percent in the fourth quarter of 2016 (table 1), according to the “advance” estimate released by the Bureau of Economic Analysis. In the third quarter, real GDP increased 3.5 percent.

The Bureau emphasized that the fourth-quarter advance estimate released today is based on source data that are incomplete or subject to further revision by the source agency. The “second” estimate for the fourth quarter, based on more complete data, will be released on February 28, 2017.

Real GDP: Percent Change from Preceding Quarter

The increase in real GDP in the fourth quarter reflected positive contributions from personal consumption expenditures (PCE), private inventory investment, residential fixed investment, nonresidential fixed investment, and state and local government spending that were partly offset by negative contributions from exports and federal government spending. Imports, which are a subtraction in the calculation of GDP, increased.

The deceleration in real GDP in the fourth quarter reflected a downturn in exports, an acceleration in imports, a deceleration in PCE, and a downturn in federal government spending that were partly offset by an upturn in residential fixed investment, an acceleration in private inventory investment, an upturn in state and local government spending, and an acceleration in nonresidential fixed investment.

Current-dollar GDP increased 4.0 percent, or $185.5 billion, in the fourth quarter to a level of $18,860.8 billion. In the third quarter, current dollar GDP increased 5.0 percent, or $225.2 billion.

The price index for gross domestic purchases increased 2.0 percent in the fourth quarter, compared with an increase of 1.5 percent in the third quarter (table 4). The PCE price index increased 2.2 percent, compared with an increase of 1.5 percent. Excluding food and energy prices, the PCE price index increased 1.3 percent, compared with an increase of 1.7 percent.

Personal Income

Current-dollar personal income increased $152.0 billion in the fourth quarter, compared with an increase of $172.3 billion in the third. The deceleration in personal income primarily reflected a deceleration in wages and salaries.

Disposable personal income increased $130.2 billion, or 3.7 percent, in the fourth quarter, compared with an increase of $141.5 billion, or 4.1 percent, in the third. Real disposable personal income increased 1.5 percent, compared with an increase of 2.6 percent.

Personal saving was $791.2 billion in the fourth quarter, compared with $818.1 billion in the third. The personal saving rate — personal saving as a percentage of disposable personal income — was 5.6 percent in the fourth quarter, compared with 5.8 percent in the third.

2016 GDP

Real GDP increased 1.6 percent in 2016 (that is, from the 2015 annual level to the 2016 annual level), compared with an increase of 2.6 percent in 2015.

The increase in real GDP in 2016 reflected positive contributions from PCE, residential fixed investment, state and local government spending, exports, and federal government spending that were partly offset by negative contributions from private inventory investment and nonresidential fixed investment. Imports, which are a subtraction in the calculation of GDP, increased.

The deceleration in real GDP from 2015 to 2016 reflected a downturn in private inventory investment, a deceleration in PCE, a downturn in nonresidential fixed investment, and decelerations in residential fixed investment and in state and local government spending that were offset by a deceleration in imports and accelerations in federal government spending and in exports.

Current-dollar GDP increased 2.9 percent, or $530.3 billion, in 2016 to a level of $18,566.9 billion, compared with an increase of 3.7 percent, or $643.5 billion, in 2015.

The price index for gross domestic purchases increased 1.0 percent in 2016, compared with an increase of 0.4 percent in 2015.

During 2016 (that is, measured from the fourth quarter of 2015 to the fourth quarter of 2016), real GDP increased 1.9 percent, the same rate as during 2015. The price index for gross domestic purchases increased 1.5 percent during 2016, compared with an increase of 0.4 percent during 2015.