RBA Highlights Housing Supply Issues And Lending Regulation

The RBA made a statement today to the Inquiry into Affordable Housing. Several points to note:

1. They recognise the high price to income ratio we currently have, but also state that low rates make larger mortgages affordable.

  • the ratio of housing prices to incomes is at the top of its historical range; but
  • over time, this has been more than offset by falls in financing costs, so that the typical repayment burden as a share of income is not particularly high. This of course does not rule out affordability problems in particular market segments or for particular types of households.

The recent data from the Economist shows the relative data of prices against average income in different countries.EconomistAug2014-IncomeTrend2000s

2. Supply of mortgages is not a constraint

there is no shortage of housing finance in Australia. Housing loan interest rates are currently as low as they have been in a generation, and households are not artificially constrained from borrowing as much as they can reasonably be expected to repay. I have already made the point that perceptions of affordability will differ across different types of households; but, if there is a perceived affordability problem in Australia, it is not due to a lack of finance.

3. There are property supply problems

It is the supply response that determines the extent to which additional demand results in higher prices over time. Our submission highlights that Australia faces a number of longstanding challenges in this area, including regulatory and zoning constraints, inherent geographical barriers and the cost structure of the building industry. There are also obstacles to affordable housing created by Australia’s unusually low-density urban structure, though this is gradually changing.

4. Lending practice reinforcement and other measures are on the cards

the Bank said in its Financial Stability Review last week that the composition of housing and mortgage market activity is becoming unbalanced. The review also indicated that we are discussing with APRA steps that might be taken to reinforce sound lending practices, particularly for investor finance, though not necessarily limited to that.

I want to emphasise that the banks in Australia are resilient, and mortgage lending in this country has historically been relatively safe. APRA has, however, noted a trend to riskier lending practices, and over the past couple of years has been seeking to temper these through its supervisory activities. There are also broader concerns with the macroeconomic risks associated with excessive speculative activity, since this activity can amplify the property price cycle and increase risks to households.

Our discussions with APRA and other agencies on these matters are ongoing, and there will be more to say about them in due course

My Recent Thoughts On House Prices

I did an interview for the ABC, on the RBA Financial Stability Review. Here is the transcript, courtesy of the ABC. The link to the interview, and my longer interview can be found at the ABC site.

By way of context, a quick reminder of current house price trends from the Economist:

EconomistAug2014-Trend2000sCHRIS UHLMANN: The Reserve Bank (RBA) has given its strongest warning yet that a dangerous property price bubble in Sydney and Melbourne could destabilise the economy.

It’s now ramping up talks with other regulators to introduce lending controls to head off the risk of a damaging correction in prices.

With more I’m joined by our business editor, Peter Ryan.

And Peter, these warning have been around for the past year. Is the Reserve Bank starting on the back foot?

PETER RYAN: Well, this was certainly very strong language from the RBA yesterday that investment in Australian property is now becoming “unbalanced” and that the speculation increases the potential for current stellar prices to fall.

Now the RBA is now worried about the broader impact of any correction or a hard landing and how that would hurt not just the speculators but average Australians whose biggest single investment is usually the family home.

The property analyst Martin North says unless the RBA intervenes with tighter controls, there could be a correction in the range of 20 to 25 per cent and that some borrowers could find themselves overwhelmed in debt – in other words facing negative equity.

MARTIN NORTH: Property prices have been high for a long period of time so this is not just a little bubble. This is a long term systemic issue.

So what’s been happening is it’s been sucking a lot of money from people’s pockets out to pay the mortgage, right? Secondly, people have been committing to buy at the top of the market and so if prices were to move down, a lot of people who’ve bought relatively recently would be out of the money and that’s very significant.

A lot of those are investors – and investors will change their tune quite quickly, you know, particularly if capital growth is no longer in the sector. So yeah, this is a very unstable situation.

Also, the banks have a huge exposure to property, probably one of the highest exposures in the world and that means that whatever happens to the property market is going to impact not only individuals but also the banks as well.

PETER RYAN: If there was a correction and those property speculators decided to sell while they could and the market was flooded with properties, what impact would that have on the general market?

MARTIN NORTH: We will probably see a downward swing and that downward swing would gain quite a lot of momentum. I wouldn’t be surprised to see prices slipping by 20 to 25 per cent. It will probably self-correct a little bit beyond that but it’s that, it’s that sort of slide down and then up which is the problem.

PETER RYAN: And that of course is a huge problem for borrowers who bought at the top of the market, borrowed too much and are now over their heads in debt.

MARTIN NORTH: The real issue there of course is all the people will find that they’re in negative equity at a point. In other words, they can’t then sell. So we could find the situation where people are trying to sell, are being forced to sell. That will tend to drive prices further down, probably languish for quite some time because we have to correct back to long term averages between income and property prices in my view.

So this is more like I think the early signs of some of the things that happened in the US prior to the GFC.

CHRIS UHLMANN: Property analyst Martin North.

So Peter, can we expect to see action on lending controls from the Reserve Bank?

PETER RYAN: Well, the RBA governor Glenn Stevens is speaking in Melbourne later today and as always his comments will be scrutinised on perhaps when and how the RBA might intervene to prevent any property bubble bursting.

CHRIS UHLMANN: Business editor Peter Ryan, thank you.

RBA And Property Speculation

The RBA published the notes from their last meeting today. The theme was similar to previous ones, “Members considered that the most prudent course was likely to be a period of stability in interest rates,” but in the variations, there was a sub-text relating to property prices. I have extracted just those paragraphs:

Members noted that Australian banks continued to report improving asset performance and strong profits, which had contributed to further increases in their capital ratios. Australian banks and non-banks had both benefited from easier wholesale funding conditions globally. This in turn had encouraged stronger competition in lending for housing and to large businesses, but members noted that this had not, to date, led to a general easing in mortgage lending standards and policies. For investors in housing, the pick-up in housing credit growth had been more pronounced than for owner-occupiers, with investor demand particularly strong in Sydney and, to a lesser extent, Melbourne.

Members further observed that additional speculative demand could amplify the property price cycle and increase the potential for property prices to fall later. The main risks in such a scenario would likely be to the stability of the macroeconomy rather than the financial system, particularly if households were to react to declines in their wealth by cutting back on their spending. Members were also updated on some of the recent actions by the Australian Prudential Regulation Authority in this area.

Members noted that commercial property markets in Australia had also been quite buoyant recently. Australian property had been yielding higher rental returns than were available overseas, which had attracted strong demand from both local and foreign investors. This had boosted prices even though rents for some types of commercial property had declined. In contrast, demand for finance from other parts of the business sector remained subdued, although business credit growth had picked up a little in recent months.

Members noted that the current setting of monetary policy was accommodative. Interest rates remained very low and had declined a little for borrowers since the cash rate was last changed. Investors continued to look for higher returns in response to low rates on safe instruments and were accepting more risk in doing so. Credit growth had picked up, including to businesses. Credit growth for investor housing was running at around 10 per cent per annum. Housing prices were continuing to increase in the larger cities and members considered that the risks associated with this trend warranted ongoing close observation. On the other hand, the exchange rate remained above most estimates of its fundamental value, particularly given the declines in key commodity prices and, overall, had offered less assistance to date than would normally be expected in achieving balanced growth in the economy.

I would tell the story rather different:

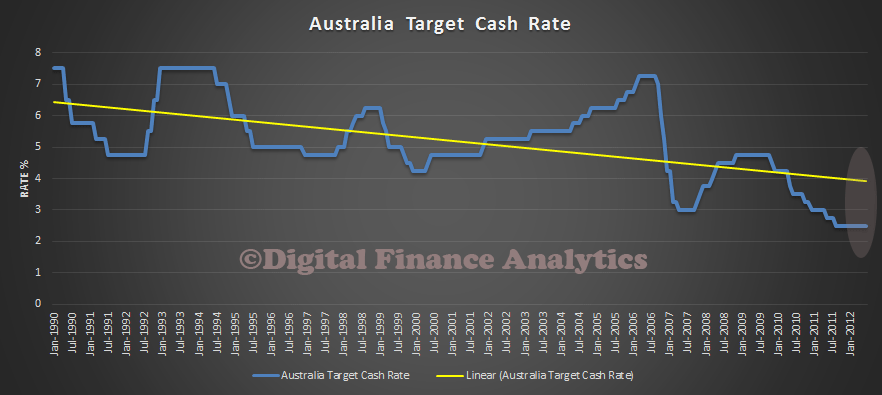
Banks have reduced the capital held against their growing pool of mortgage debt, so we hope the new advanced methods of capital calculation will support any risk of a down-turn. Still, the growth in investment lending at 10% is probably not an issue, after all, banks lending standards are just fine, no concerns apparently about the fact that half of new lending in the month was for investment purposes, nor the rise in interest only loans, or loans outside normal approval criteria. House prices continue to rise fast in (some of the cities) but we will just watch what happens, despite all the data showing prices are out of kilter with income, and other measures. Remember that interest rates are at rock bottom, well below the long term trend. They will correct at some point, and when the average mortgage rate is 7%, the chickens are likely to come home to roost. This is the key to potential falling prices later as with income growth below inflation, any lift in rates would have direct macroeconomic effects on borrowing households.

RateTrend


Further High House Price Evidence – BIS

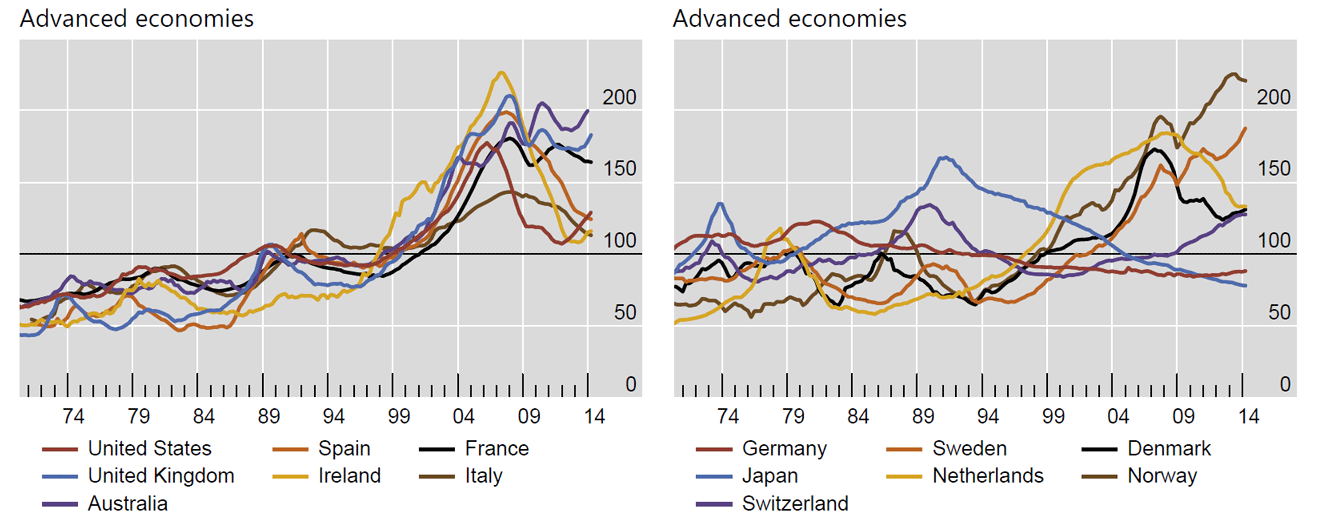
The BIS has published the latest data from their analysis of house prices across countries. “The BIS currently publishes more than 300 price series for 55 countries, among which it has selected one representative series for each country. For 18 countries, it also publishes series that span the period back to the early 1970s. House prices can serve as key indicators of financial stability risks, as property booms are often the source of vulnerabilities that lead to systemic crises.”

They show that in trend terms, after correcting for inflation and seasonality, Australian prices are relatively higher than other advanced countries. This is consisted with data from the IMF, Economist, and DFA’s own analysis. “Year-on-year residential property prices, deflated by CPI, rose by 9.5% in the United States and 6% in the United Kingdom. Real house prices also grew, by 7% in Canada, 7.7% in Australia and 2.2% in Switzerland, three countries that were less affected by the crisis, as well as in some countries that were severely affected by the crisis, such as Ireland (+7.2%) and Iceland (+6.4%)”.

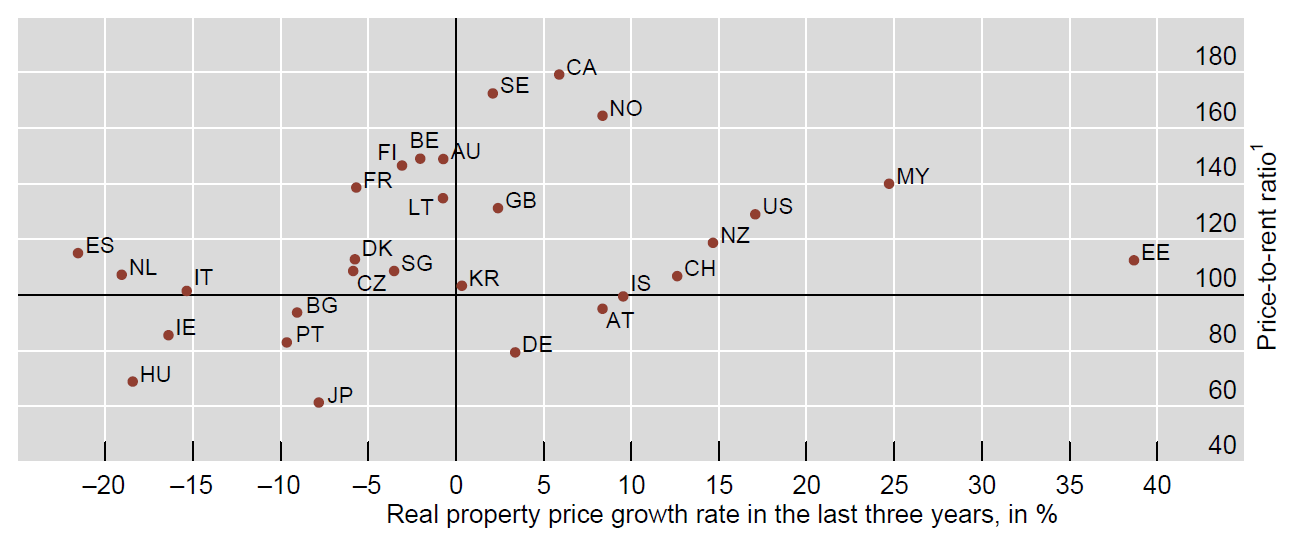
BISHousePricesSept2014They also show the relative benchmark between house price growth and price to rent. Here, overall average house price growth, after inflation, in Australia is close to zero over the last three years (because of averages across the states, the ABS shows how prices vary state by state), and Australia has high price to rent rations, but not the highest. This is because rents are more linked to interest rates and income growth than house prices directly.

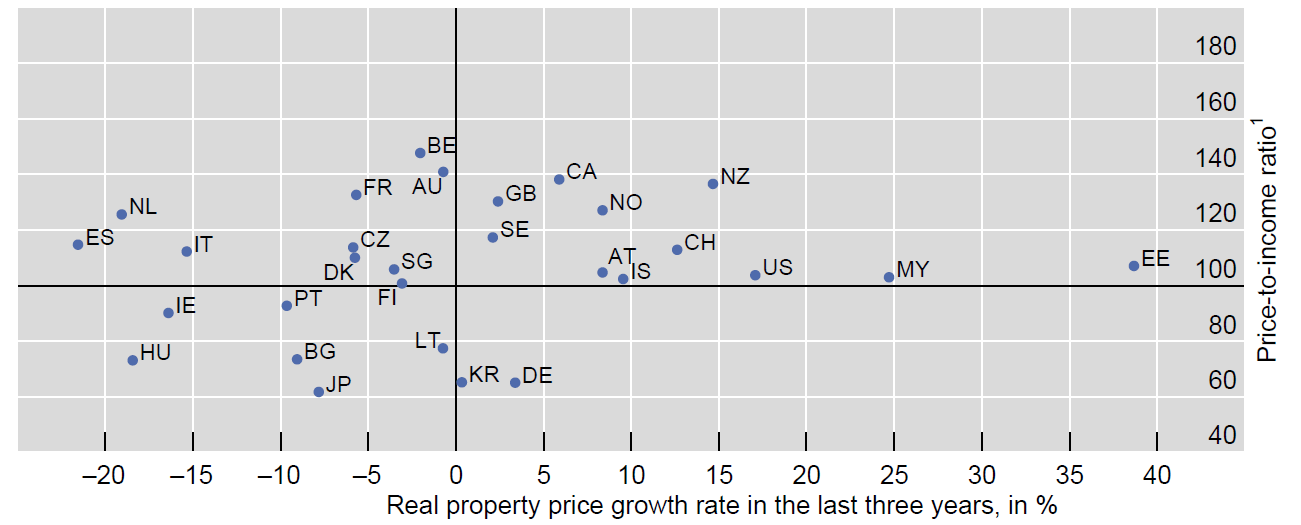
BISPricetoRentRatioSept2014Turning to their other measure, comparing house prices to income ratios (the measure we prefer as the best judge of house prices), we find that Australia is shown as the second highest, after Belgium, despite the close of zero growth in absolute prices, after inflation, in the past 3 years.

BISPricetoIncomeSept2014The codes for the various countries are listed below:

BISCountryList2014Their comments are important:

Work at the BIS has pointed to the early warning indicator properties of real estate prices. Leverage fuelled housing booms that turn into busts have so often been at the very heart of episodes of systemic distress. Historical experience has demonstrated that the interactions between rapidly growing house prices and excessive credit expansion are a tell-tale sign of the build-up of vulnerabilities in the household sector and the source of future losses for banks.


RP Data Weekly Property Trends

RP Data just released their latest weekly trends data. First the data shows a weekly fall overall in capital city house prices, with Sydney and Adelaide the only centres showing an uplift. Sydney prices continue their run ahead of other states.

RPDataData7Sep2014ValueChangesMedian house and unit prices are highest in Sydney, with Perth, Darwin and Canberra ahead of Melbourne. The statistics are calculated across houses and units sold over the most recent four week period.RPDataData7Sep2014Prices‘Time on market’ is simply the average number of days between when a property is first listed for sale and the contract date. The rate of vendor discounting is the average percentage difference between the original listing price and the final selling price.

RPDataData7Sep2014Time

Finally, RP Data monitors more than 100,000 mortgage activity events every month across their industry platforms. Monitoring the activity events across this platform provides a unique and timely lead indicator to housing finance commitments. We continue to see a cooling in mortgage demand in every state other than Victoria.

RPDataData7Sep2014Mortgages

The Current State Of Play In The Property Market

An extract from the latest edition of the DFA report, the Property Imperative, released last week.

The Australian Residential Property market is valued at over $5.2 trillion and includes houses, semi-detached dwellings, townhouses, terrace houses, flats, units and apartments. In the past 10 years the total value has more than doubled. It is one of the most significant elements driving the economy, and as a result it is influenced by state and federal policy makers, the Reserve Bank, Banking Competition and Regulation and other factors. Residential Property is therefore in the cross-hairs of many players who wish to influence the economic fiscal and social outcomes of Australia.

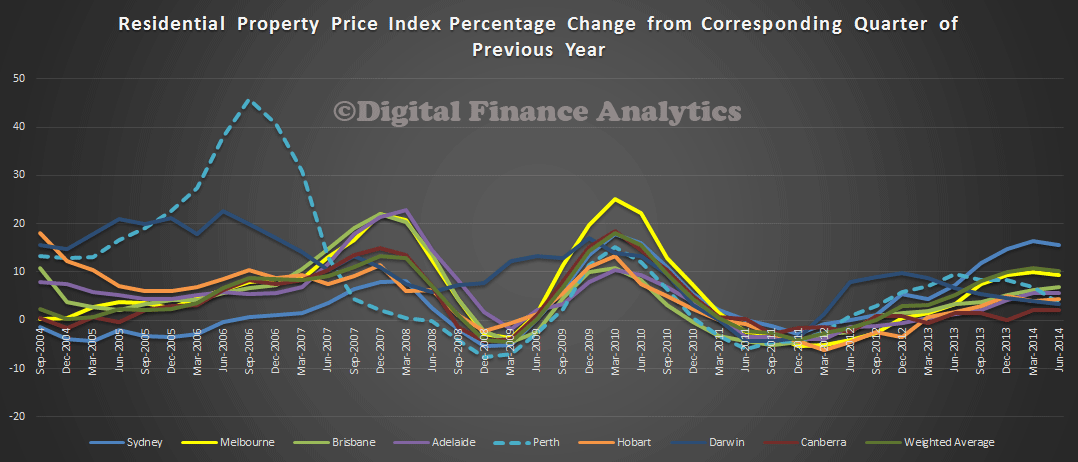
ResidentialPricesYOYJune2014
According to the Reserve Bank (RBA), as at July 2014, total ADI housing loans were a record $1.382 trillion , an increase of 8.5% in investor loans and 4.8% in owner occupied loans over the past year. There were more than 5.08 million housing loans outstanding with an average balance of about $237,000 . Approximately two-thirds of total loans were for owner-occupied housing, while one-third was for investment purposes. 43.2% of new loans issued were interest-only loans , this is a record.

After a significant credit fueled boom in 2002-2007, momentum slowed after 2007 as a result of the Global Financial Crisis (GFC). The RBA dropped rates directly after the immediate crisis, but then lifted them again to a peak of 4.5% in 2011 in response of a property rebound and the mining sector investment sector boom. In 2013 its benchmark rate was cut to an all-time low of 2.5% which has stimulated further property demand, as the resource sector transitions from an investment to exploit phase. Through 2014, rates have remained at 2.5%, and in the latest RBA minutes, they suggest a continuation for some time at this level .

The Australian Bureau of Statistics says property prices have risen in every capital city in the past year to June 2014. Annually, residential property prices rose in Sydney (+15.6%), Melbourne (+9.3%), Brisbane (+6.8%), Adelaide (+5.6%), Hobart (+4.3%), Perth (+3.6), Darwin (+3.4%), and Canberra (+2.2%) . The Residential Property Price Index (RPPI), a measure including houses and attached dwellings, for the weighted average of the eight capital cities rose 1.8% this quarter, for a total rise of 10.1% over the last year.

Capital City Dwelling Values Strongest Capital Gain since 2007 – RP Data

RP Data released their August Hedonic Home Value Index showing that capital city dwelling values moved 4.2% higher over the three months to the end of August, the strongest capital gain over the three months of winter since 2007. You can read the full release here.

RPDATAAugust2014RPDATAAugust22014

Where Capital Growth In Property Lives

In the Opening Statement to House of Representatives Standing Committee on Economics today, Glenn Stevens made the following points:

  • not only are funding costs low, but banks want to lend and are competing to do so more actively than they have for some years;
  • net worth per household has risen by about $120,000 over the past two years;
  • the community’s monetary assets have risen by around 13 per cent – over $180 billion – over the same period;

It is worth reflecting on the fact the main reason for the increase in net worth is a bounce in the stock market, and lift in capital values of property, thanks to rising prices. After all real income is falling for many. In addition, the average hides the differences.

We have been looking at capital growth for the average household, across the states, and between the main urban centres and the rest of rest of the state. From our surveys we have been able to assess the relative growth in the value of property, over time, by marking property to market and comparing that with its purchase price. The chart below shows the relative growth in net capital value of property since 2004 (where our surveys start). It subtracts the original purchase price from the current value, to give a theoretical capital or wealth value. It shows that in the early 2000’s there was a similar level of growth in the cities and regional centres, but that more recently it has diverged. In the past 2 years, the average capital appreciation in the urban centres was $79,000, whereas in the regional centres, it was just $18,000.

AverageCapitalGrowthAllHowever there are significant variations across the states. In Sydney, households in the past 2 years, have on average enjoyed a lift in net worth of more than $230,000 thanks to price hikes, whereas Brisbane, Adelaide, and regional areas in SA and TAS have not experienced much of an increase at all.

AverageCapitalGrowth2YearsLooking at the longer term trends, across states, the situation gets even more interesting. Of course people have bought in at different times, but we can plot the overall capital growth trend. For example, In NSW, a household who bought in Sydney in 2004 and held the property would on average be nearly $300,000 better off now. If they had bought in early 2012, though they could have nearly earnt the same gain! All the action has been in the last couple of years, in Sydney itself. There have been a more gentle lift in regional NSW. Note that I have not corrected for inflation in any of the current calculations, if I did, the regional centres in NSW would have stood still.

AverageCapitalGrowthNSWIn VIC, the situation is somewhat similar. It is worth noting that compared to NSW, the correction in 2009 was less severe.

AverageCapitalGrowthVICTurning to QLD, there has been no capital growth in either Brisbane, or the regional centres since 2010. If you were to correct for inflation, it would be going backwards.

AverageCapitalGrowthQLDIn WA, growth peaked in 2010 in Perth, with a further small peak recently, whilst in the regional centres, values are falling in real terms, before inflation. We compared Perth and Sydney recently, in more detail.

AverageCapitalGrowthWALooking at SA, growth in Adelaide is back to 2011 levels, but in the regional areas, growth is still lower than in 2010.

AverageCapitalGrowthSAIn TAS, since a peak in 2010, both Hobart and regional centres are flat, before inflation.

AverageCapitalGrowthTASFinally, we look at the remaining states. Growth in Darwin has been sustained, whilst regional NT and Canberra are flatter since 2011.

AverageCapitalGrowthOtherSo, my conclusion is simple, some households especially in Sydney and Melbourne, may be experiencing the wealth effect halo of smugness, but many households across other states and regional centres are not enjoying capital growth. Indeed, for many there has been a reduction in true value, before inflation since 2011. It is unlikely therefore that we will see a sudden surge of consumer spending activity in response to the housing boom (which is not uniform across the country as we have shown). It is really a Sydney and Melbourne boom. The RBA may be waiting for a long time if they are expecting households to start spending big.


A Tale Of Two Cities – Demand and Supply In Action

Last week we reported on the ABS house stock data, which valued property at more than 5.2 trillion in Australia. We have been looking in more detail at this data, and cross relating it to information from our own household surveys. Today we compare the markets in NSW and WA, because there are some interesting observations to note. First, NSW and WA have the highest mean dwelling prices in Australia. NSW stands at more than $650,000 and WA $595,000, ahead of VIC and ACT. TAS has the lowest mean at just over $300,000.

DwellingPricesByStateJune2014In addition, when we look at the decomposition of the $5.2 trillon by state, NSW has the largest share, WA has a smaller, but significant share, behind VIC and QLD.

TotalValueDwellingsByStateJune2014But, there are some interesting differences between NSW and WA. Population growth, from all sources (migration, births, and interstate movements), shows that WA is growing faster than NSW. So, from the demand perspective, we would expect prices in WA to be responding to that demand.StatePopulationGrowthNSWandWAJune2104In fact, dwelling prices in WA have been growing at a significantly lower speed than in NSW. In fact, most recent data suggests prices in WA are going slightly backwards.

DwellingPricesNSWandWAJune2014So, whats making this happen? We need to look at the supply side of the equation. WA have been building more properties, significantly more, than NSW. So demand and supply in WA are more in balance, even taking the faster population growth into account.

ChangeInDwellingsNSWandWAJune2014We also checked out the status of property purchase by SMSF’s and the like, and there are similar trends in the two states, so that element can be discounted from the analysis. We have previously highlighted the shrinking average plot size for new developments, and noted that WA has been allowing plot sub-division and new builds on sub-250 sqm plots. So it is interesting to note NSW’s recent announcement to release land in the west for smaller development plots. Supply and demand are clearly in action, and NSW house prices won’t adjust from their stratospheric levels until substantial supply side issues are addressed.  The way to address Australia’s housing issues is to release more land, and build more houses.

House Price Momentum Slowing As Value Reaches $5.2 Trillion

The ABS released their latest data on Residential Property Prices today. The total value of residential dwellings in Australia was $5,196,355.9 m at the end of June quarter 2014, rising $112,598.5 m over the quarter. The mean price of residential dwellings rose $9,900 and the number of residential dwellings rose by 37,600 in the June quarter 2014. The price index for residential properties for the weighted average of the eight capital cities rose 1.8% in the June quarter 2014 and rose 10.1% through the year to the June quarter 2014. The capital city residential property price indexes rose in Sydney (+3.1%), Melbourne (+1.3%), Brisbane (+1.8%), Adelaide (+1.0%), Canberra (+0.8%), Darwin (+0.7%) and Hobart (+0.3%) and fell in Perth (-0.2%). Recent data suggest momentum is slowing, a little.

ResidentialPricesQOQJune2014Annually, residential property prices rose in Sydney (+15.6%), Melbourne (+9.3%), Brisbane (+6.8%), Adelaide (+5.6%), Hobart (+4.3%), Perth (+3.6), Darwin (+3.4%), and Canberra (+2.2%).

ResidentialPricesYOYJune2014The median price of established houses exceeds $700,000 in Sydney. Hobart and Adelaide have the lowest values. Looking at the rest of the states, beyond the capital cities, NT has the highest value, and QLD exceeds NSW and VIC. Note this data is to December 2013 only, as the ABS does not yet reprot the latest data for the past 6 months.

MedianEstablishedPricesDec2013Looking at attached dwellings, again Sydney is highest, on average, at over $550,000, whereas away from the capital cities, prices are higher in NT and QLD.

MedianHousePricesAttachedDec2013Looking at the number of transfers, momentum is clearly in Sydney and Melbourne. Brisbane is showing signs of upward movement. Note again this data is to December 2013.

NumberofTransfersDec2013Property is too highly priced, compared with income measures, and international comparisons. The long term chronic problem of poor supply, easy loans and high demand continues to be a brake on the broader economy. Household confidence is not buttressed by rising prices. Many continue be be excluded from the market.