Bloomberg’s Summary Of The Australian Housing Market.

Bloomberg Australia has published a compelling overview of the housing market in Australia. They underscore the relatively myopic stance of the regulators. DFA was cited in the article.

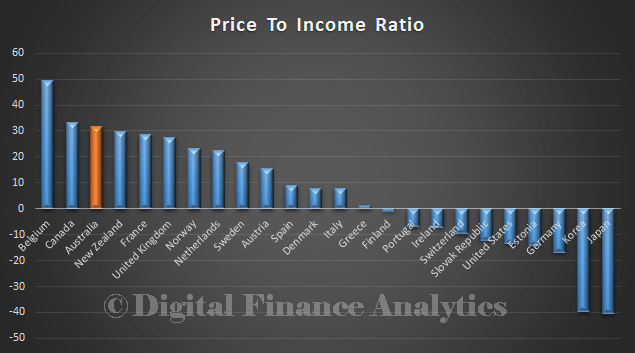
Australia has the third-most overvalued housing market on a price-to-income basis, after Belgium and Canada, according to the International Monetary Fund. The average home price in the nation’s eight major cities rose 16 percent as of June 30 from a May 2012 trough, the RP Data-Rismark Home Value Index showed.

In Sydney, the most populous city, where price growth has been strongest, values soared 15 percent over the past 12 months. That compares with a 5.4 percent increase in New York City in April from a year earlier and a 26 percent jump in London prices in June quarter from a year ago.

“There’s definitely room for caps on lending,” said Martin North, Sydney-based principal at researcher Digital Finance Analytics. “Global house price indices are all showing Australia is close to the top, and the RBA has been too myopic in adjusting to what’s been going on in the housing market.”

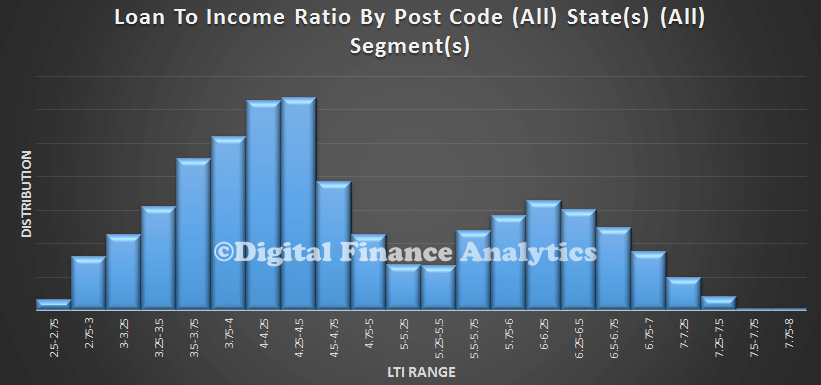
Worth recalling the chart we published recently on Loan to Income By Post Code.

LTIAllStates

No Housing Bubble In Australia – RBA

The RBA today published a discussion paper entitled Is Housing Overvalued?

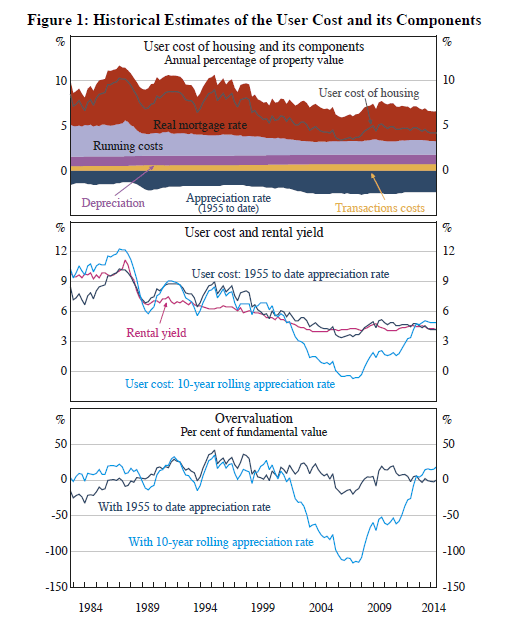
This is an important question, given The Economist (2013) and the OECD (2013) report that Australian house prices are 24 per cent and 21 per cent ‘overvalued’, respectively. The report makes the point cost to income ratios are meaningless unless you know the cost of the alternative!

Their approach is to examine whether it is more expensive to own a house or to rent. They assess houses as ‘overvalued’ if home buyers pay too much, in the sense that they would be better off renting than buying. This involves comparing the financial cost of renting a home with the cost of owning a similar dwelling, where the latter depends on the purchase price, interest rates, repairs, council rates and so on.

They conclude that real house prices have increased at an average annual rate of slightly less than 2½ per cent since 1955. If this rate of appreciation is expected to continue then houses are fairly valued. Many observers have suggested that future house price growth is likely to be somewhat less than this historic average. In that case, at current prices, rents, interest rates and so on, the average household is probably financially better off renting than buying.

RBAPricesInterestingly, there is no direct discussion in the paper on housing bubbles, though there is a throw away line in the abstract “Recent data do not show signs of a bubble”.

Now, we agree that there is not a housing bubble in Australia, rather thanks to macroeconomic policies over a long period, poor land release, and freely available credit, house prices are out of kilter, based on loan to income, loan to value, and on other metrics. In fact, the best approach is to use a range of measures to baseline the position of house prices, across countries. The weakness in the RBA analysis is that house prices and rental costs are connected, so they will tend to move together. Therefore, relatively speaking the fact that rents are tracking prices are not a good indicator of whether house prices are over valued. It is a closed system, and self fulfilling.

How Household Property Buying Intentions Have Changed Since 1995

Today we continue our series on the latest results from our households surveys. Following our recent posts, we had several people ask about trends around some of the metrics we use. We have been running these surveys since 1995. So in this post we present a summary of trends from 1995 onwards. It provides an interesting perspective on how households have changed their behaviour in recent years.

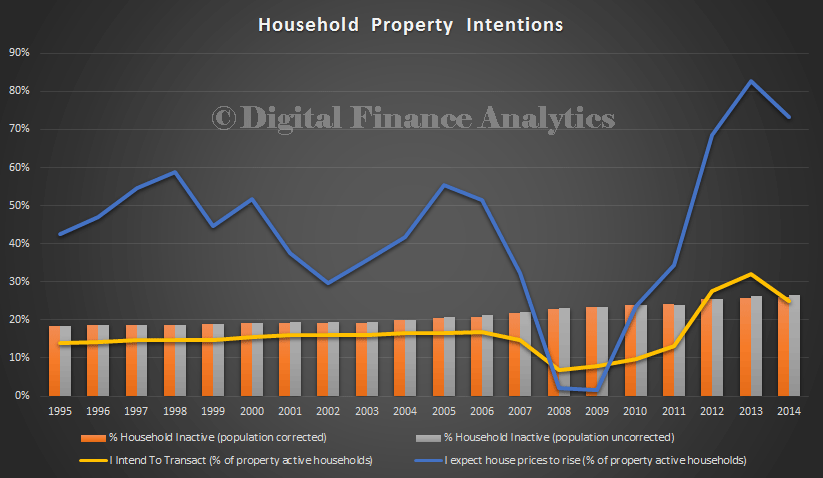
IntentionsDFAJun14To explain the data, the bars show the rising trend in those households who are property inactive (inactive because they do not own property, and do not intend to in the foreseeable future). We show the percentage as a raw split, and also an adjusted split, to take account of population growth across states. The ratio of active to inactive households varies across individual states, and across geographic bands within states.

We also show the proportion of households who said they intended to transact in the next 12 months, and also their expectations, at the time, of house price movements for the next 12 months. Intention to transact was sitting at around 15% of households, until it fell as a result of the GFC. Since that time, it has powered ahead, and is significantly above long term trend – though note the recent fall. Turning to the proportion of households expecting property prices will rise in the coming 12 months, this is more variable, although the long term average prior to the GFC was close to 50%. If fell significantly in 2008 and 2009, before recovering, and reaching a high of 80% in 2013. It is still above long term trend, though falling slightly.

This data highlights the significant demand pressures on the property market, and helps to explain the high prices being achieved, although our interpretation is that the peak is now passed.

Next time we will consider households considering investment property.


IMF Warns On Housing, Launches New Index

The IMF has launched its Global Housing Watch, a selected set of data highlighting potential pressures in the housing market across countries. “Housing is an essential sector of every country’s economy, but it has also been a source of instability for financial institutions and countries. Understanding the drivers of house price cycles, and how to moderate these cycles, is important for economic stability.In its first release, they warn of high prices, and tensions between central bank policies and broader economic issues”. They argue that housing has been the subject of “benign neglect”.

Here are the initial findings, with Australia highlighted where appropriate.

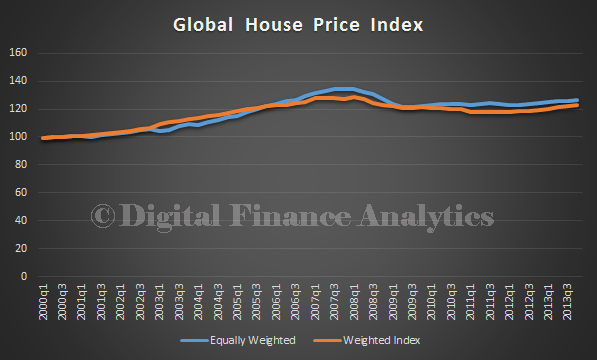
First, the Global House Price Index is a compilation of average housing prices in different countries that tells us if prices are going up globally. The global house price index highlights the fact that after the GFC in 2007, there was only a minor correction, so house prices remain high by historic standards.
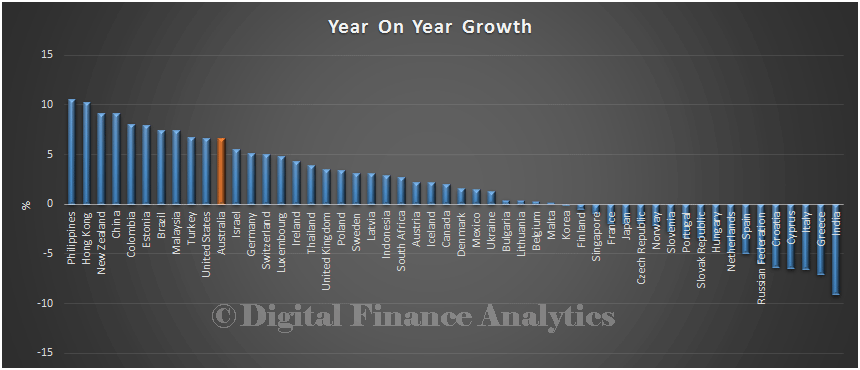
IMFJun14-0Year on year growth in prices does vary by country, Australia is towards the top of the growth trend, although New Zealand is even higher, and the Philippines is top.
IMFJun14-3Looking at relative price to income, Australia is on average third highest (they do not split out specific markets in countries). Belgium is the most expensive, Japan the least.
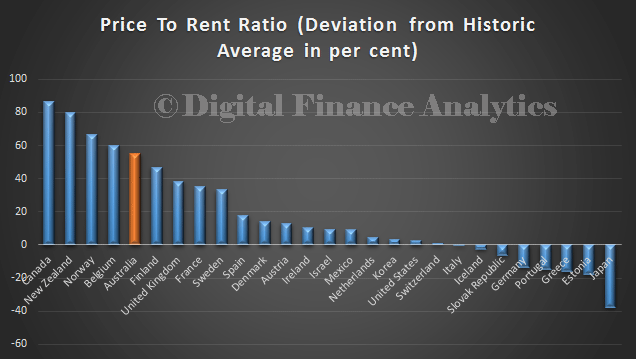
IMFJun14-2Finally, the ratio of house prices to rent also highlight that Australia is at the high end, behind Canada, New Zealand, Norway and Belgium. Japan is the lowest.
IMFJun14-1They conclude:

We do have a set of policy tools that can help – sometimes these are referred to as “Mip-Map-Mop.” Microprudential (Mip) policies look at an individual bank’s balance sheet, for example to determine if it is making too many real estate loans. But it could be that the individual banks are doing what seems healthy for them, but what the banking system as a whole is doing needs results in an unhealthy growth in lending.

So, in addition, macroprudential regulations (Map), operating at the level of the financial sector as a whole, come into play. The most commonly used measures cap how much individuals may borrow relative to their income. These prudential measures are being increasingly used by countries to prevent an unsustainable build-up in debt.

Finally, there is the monetary policy (Mop) that involves the central bank raising interest rates if they want to cool off the housing sector. This can be tricky, because sometimes the economy is weak but the housing sector is booming, and raising the interest rate can harm the overall economy.

We have argued for some time that Australia need to use macroprudential  policies to help to bring the run-away housing market under control. Focus on investment lending should be first priority. Over emphasis on lending for housing sucks the air from the broader economy and makes it harder for potentially productive businesses to get the lending support they need. Households servicing larger debts have less spending power, which dampens economic activity.