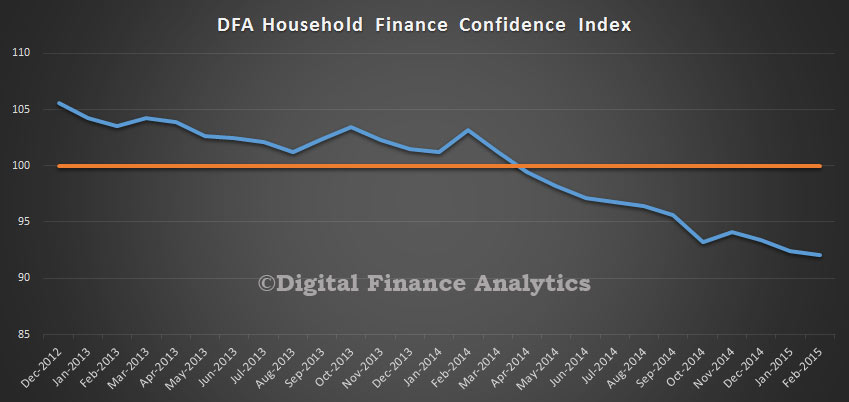
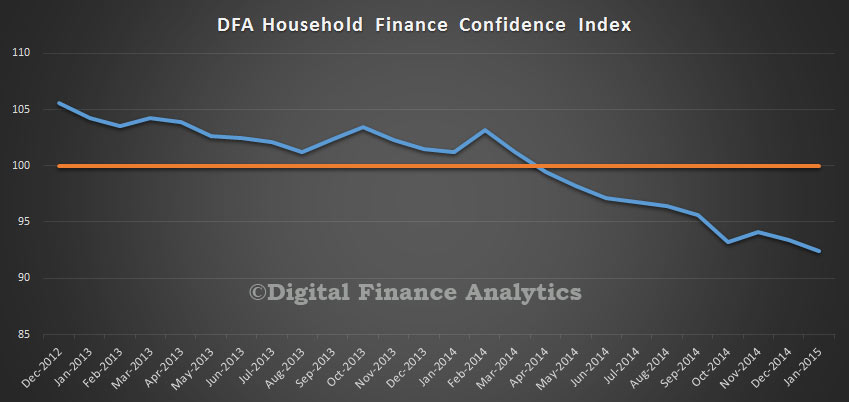
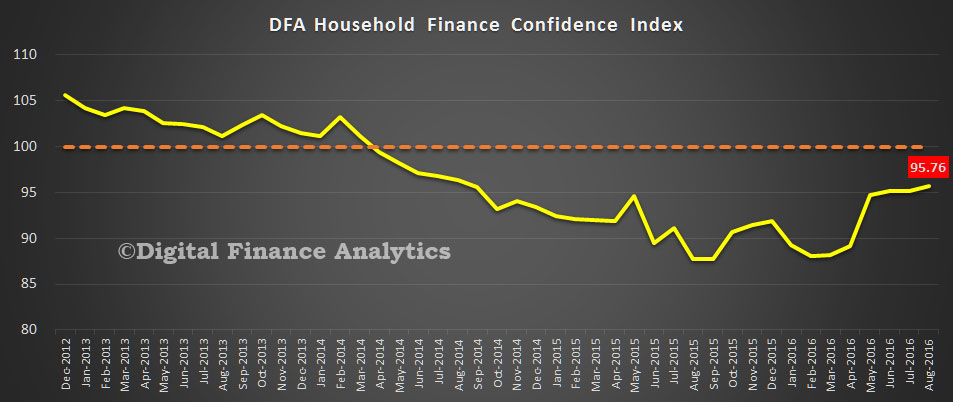
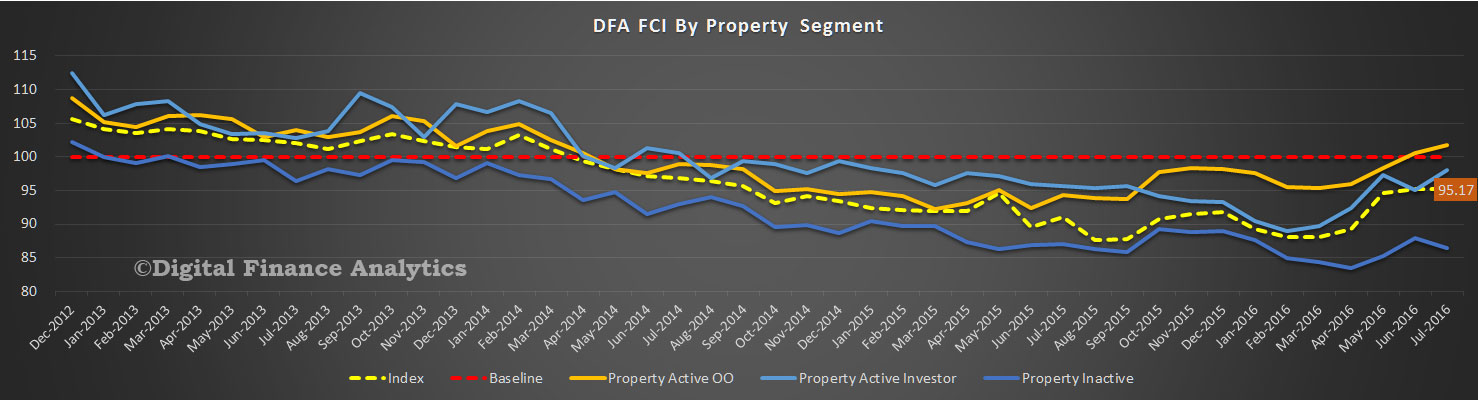
The latest edition of the Digital Finance Household Finance Confidence Index, to end August is released today. Overall the index rose again, from 95.1 to 95.8.
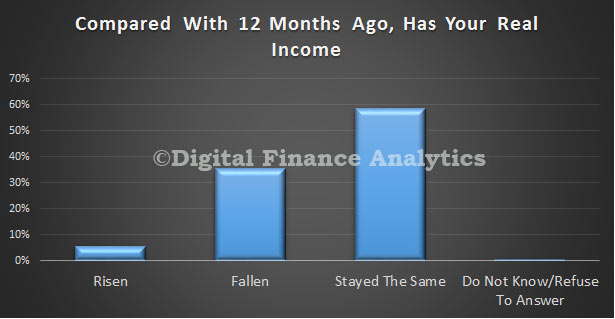
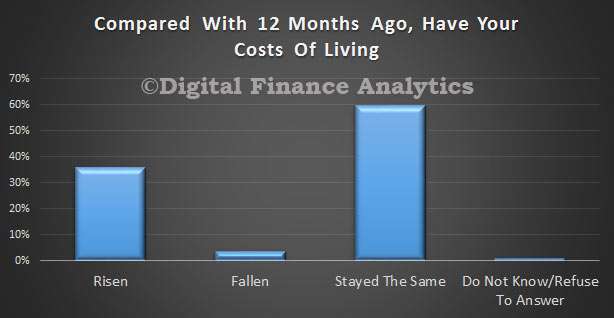
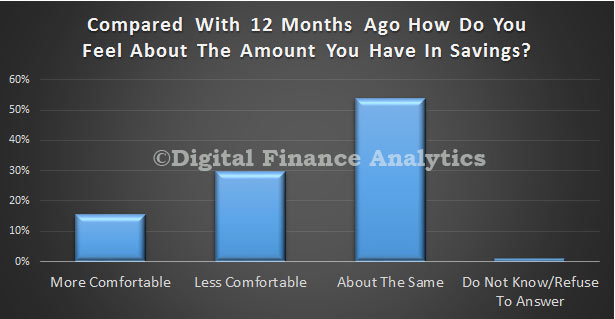
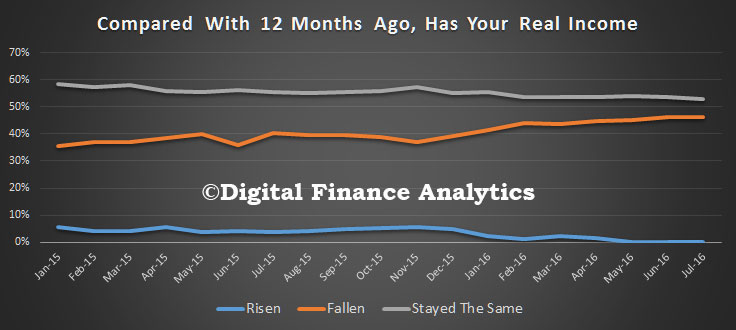
Household costs were relatively contained, whilst many received a boost from the RBA cash rate cut. Some savers were able to take advantage of higher term deposit rates, although others saw their returns on cash deposits falling further. Income growth remained static, but net worth improved thanks to rises in the value of property and shares. Overall the index remains below a neutral setting, but some households in some states are now well into positive territory.
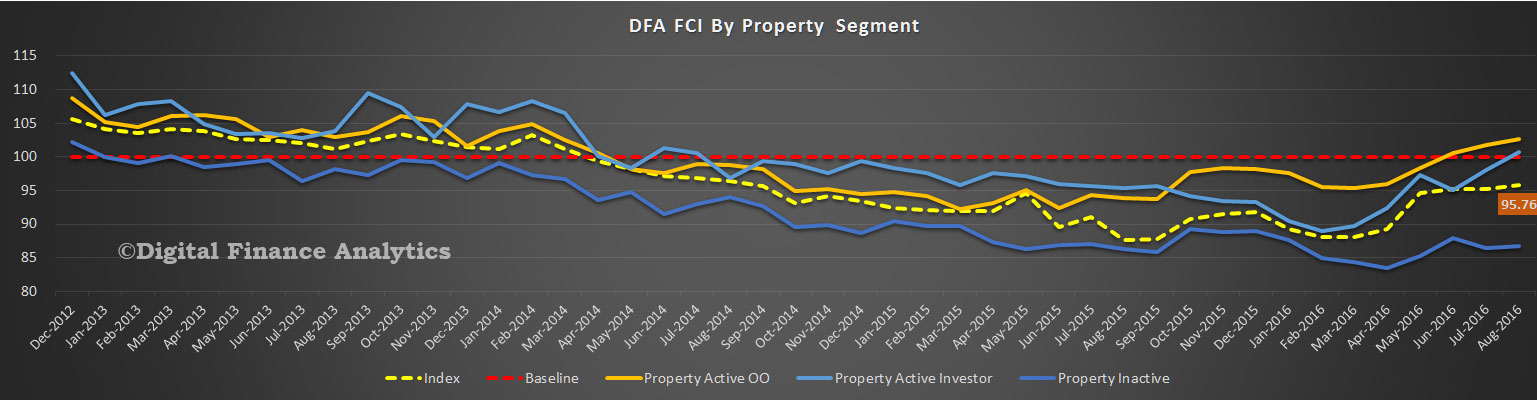
 The cash rate cut helped to propel the confidence of those with owner occupied and investment property, while those who are property inactive did not show the same rise. In addition, the more recent positive home price rises bolstered property investors.
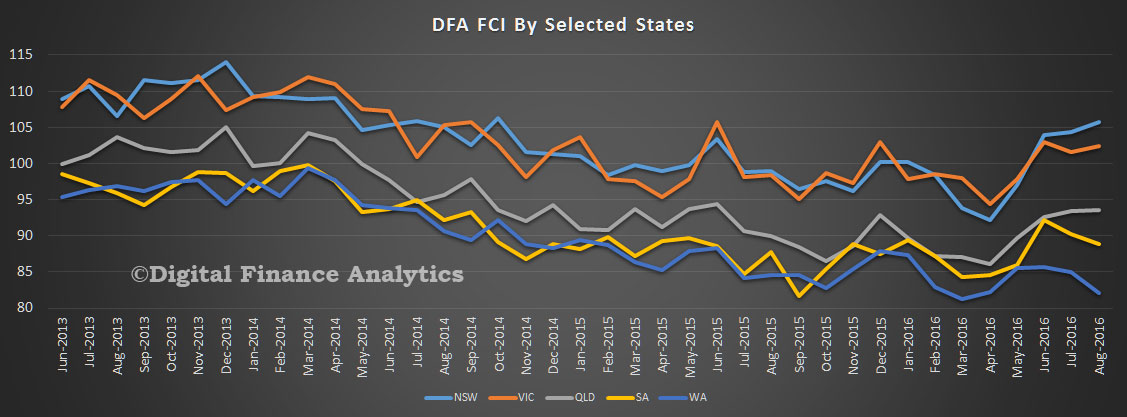
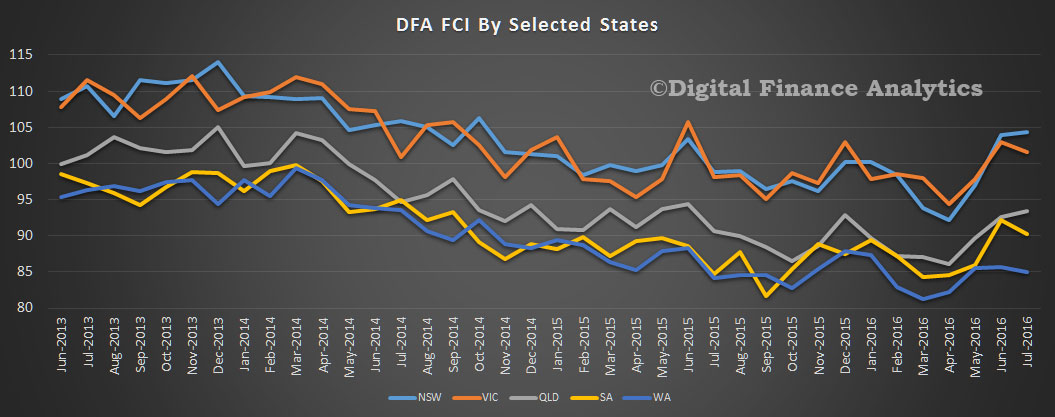
 The state variations continue to widen, with households in NSW and VIC well into positive territory, whilst those in WA languish.
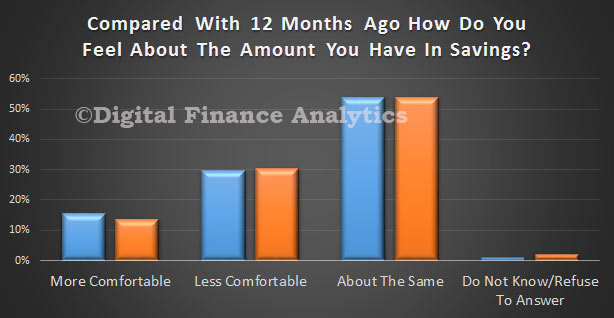
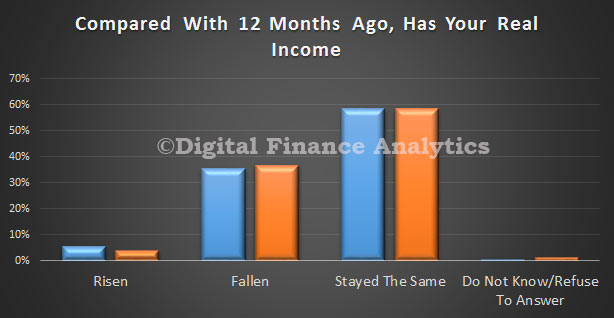
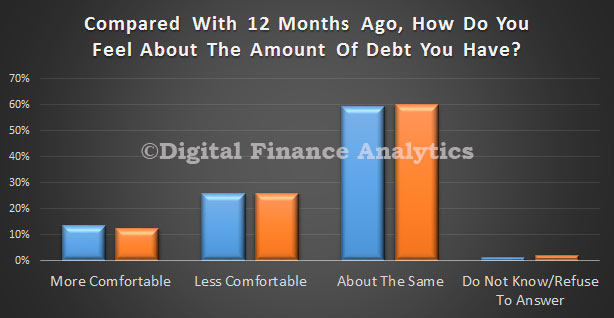
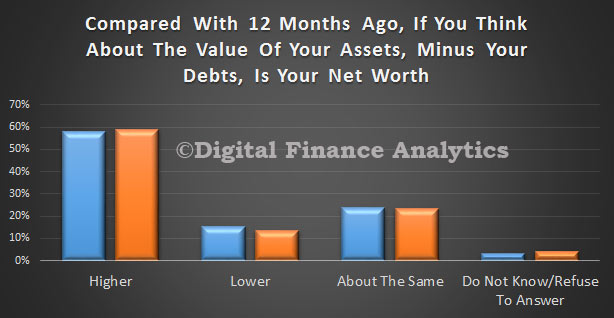
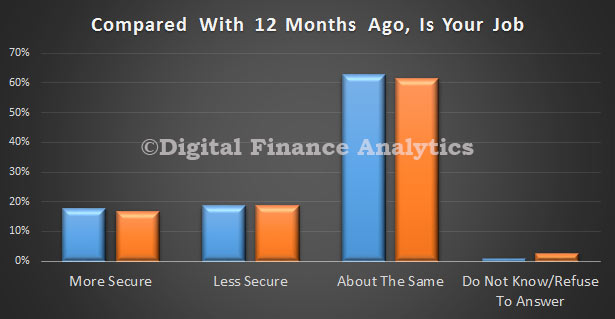
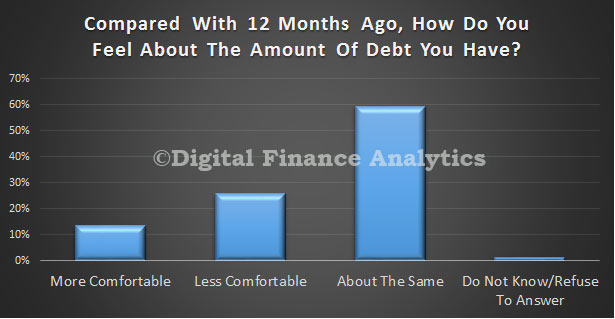
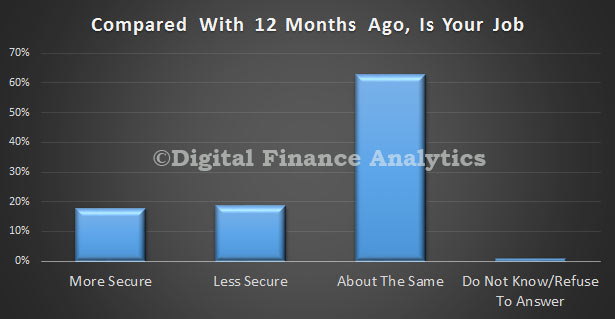
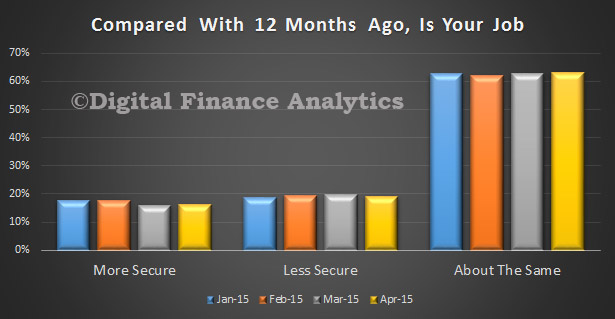
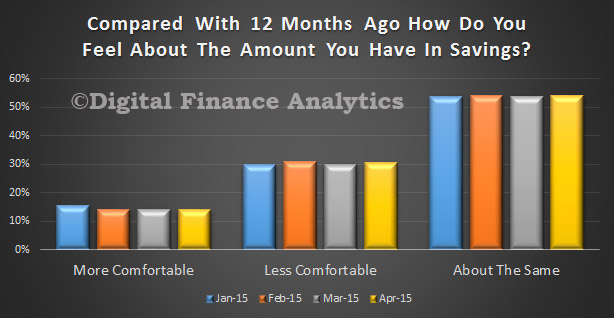
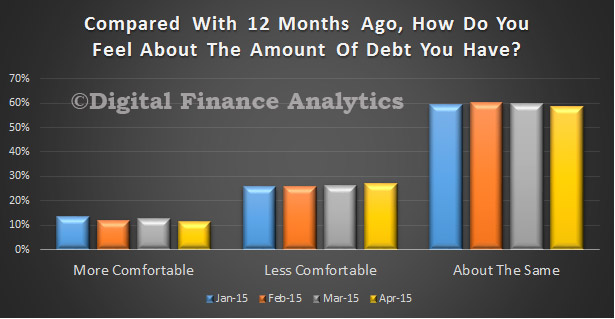
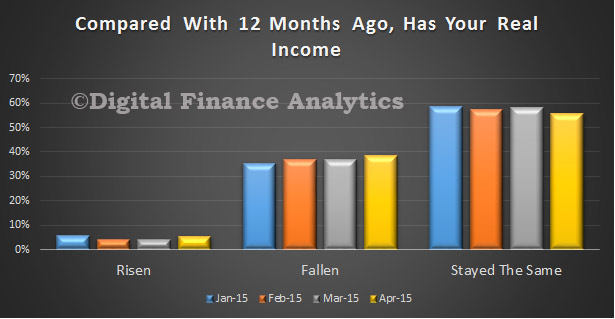
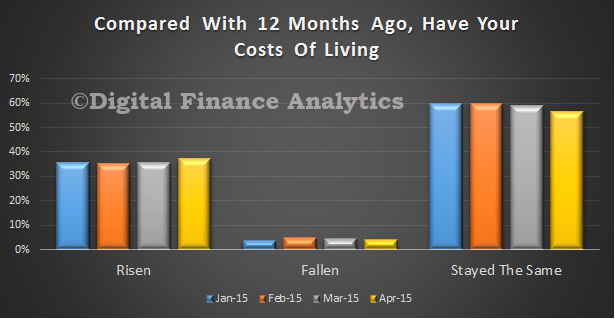
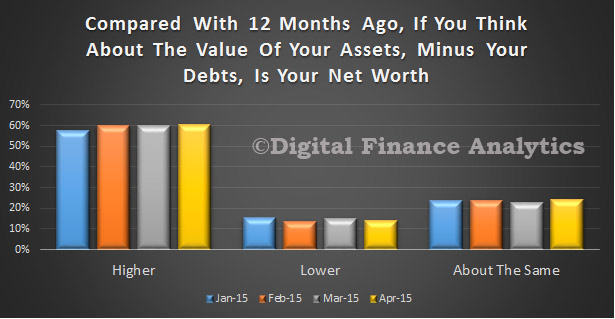
 By way of background, these results are derived from our household surveys, averaged across Australia. We have 26,000 households in our sample at any one time. We include detailed questions covering various aspects of a household’s financial footprint. The index measures how households are feeling about their financial health. To calculate the index we ask questions which cover a number of different dimensions. We start by asking households how confident they are feeling about their job security, whether their real income has risen or fallen in the past year, their view on their costs of living over the same period, whether they have increased their loans and other outstanding debts including credit cards and whether they are saving more than last year. Finally we ask about their overall change in net worth over the past 12 months – by net worth we mean net assets less outstanding debts.

 Go here to request a copy.