

/
RSS Feed
Digital Finance Analytics (DFA) Blog
"Intelligent Insight"

We discuss the latest results from our household surveys
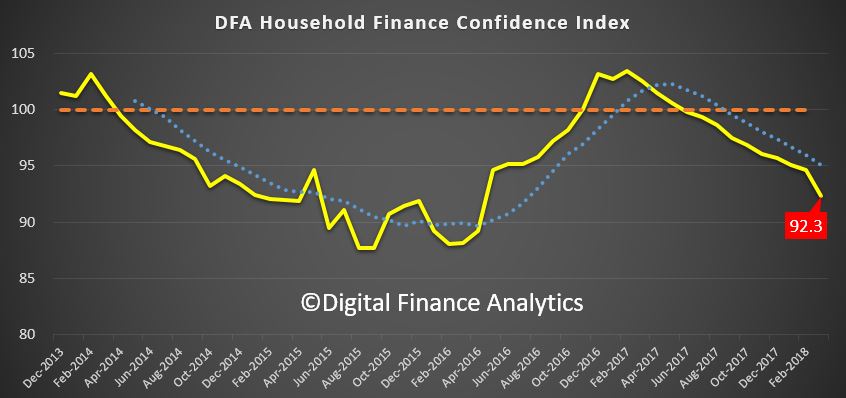
The latest Digital Financial Analytics Household Financial Confidence Security Index for May 2018 is released today. The index tests households attitudes to their finances, based on our 52,000 rolling household survey.
The index dropped to 90.2, down from 91.7 last month. This is below the neutral setting of 100.
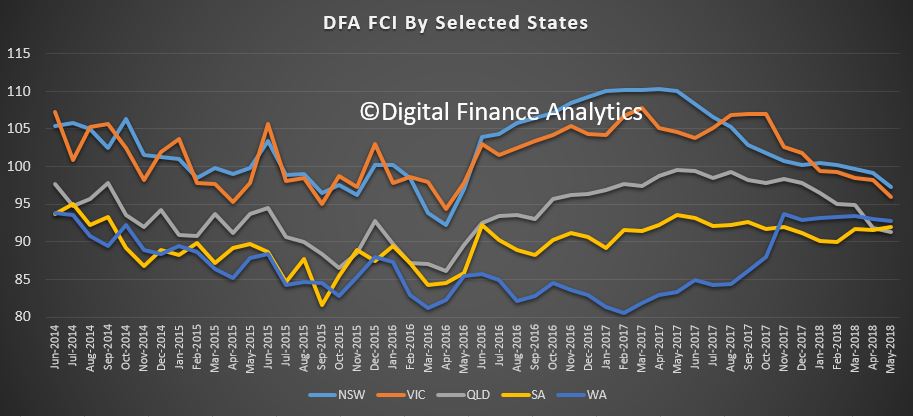
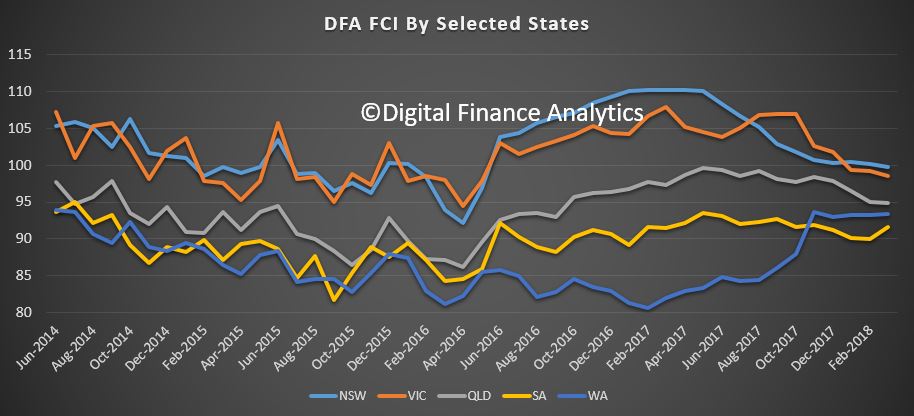
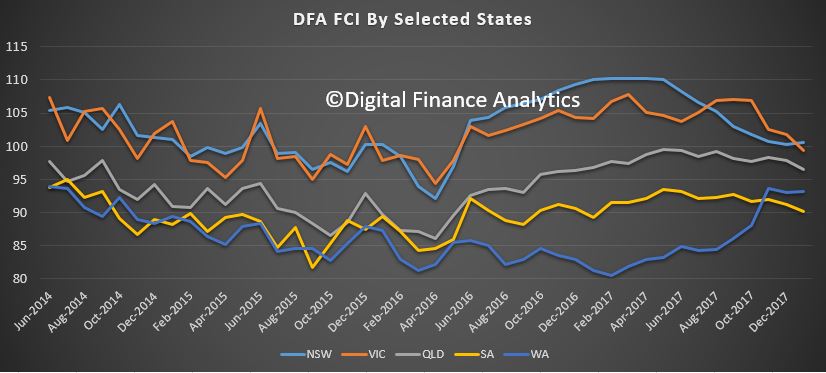
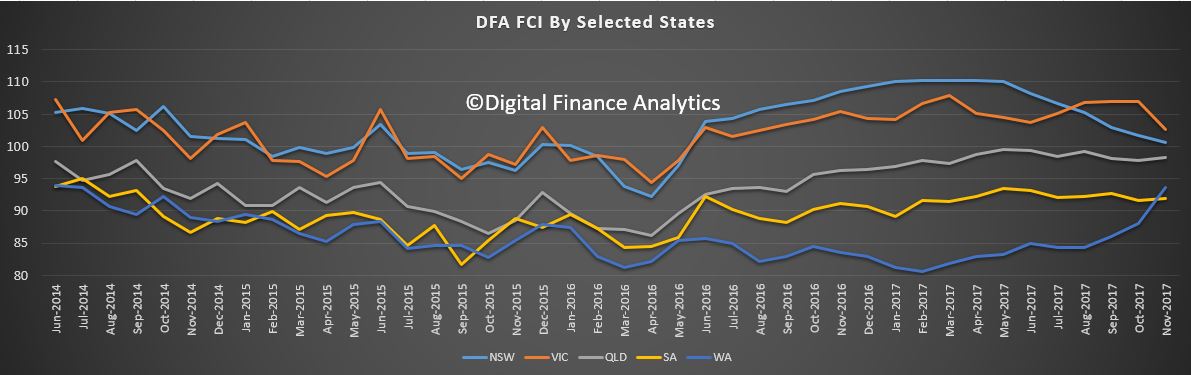
 Property-related sentiment is hitting hard, especially in New South Wales and Victoria where price falls are most evident. In Western Australia and South Australia, the index hardly moved compared with last month, and in Queensland it slid just a tad.
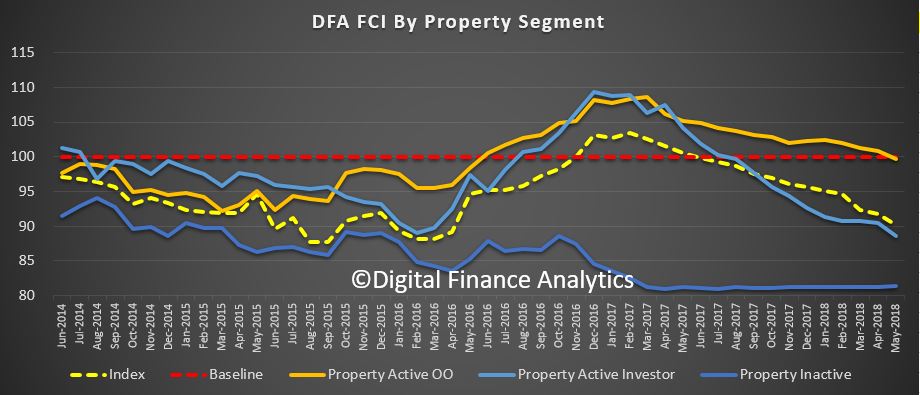
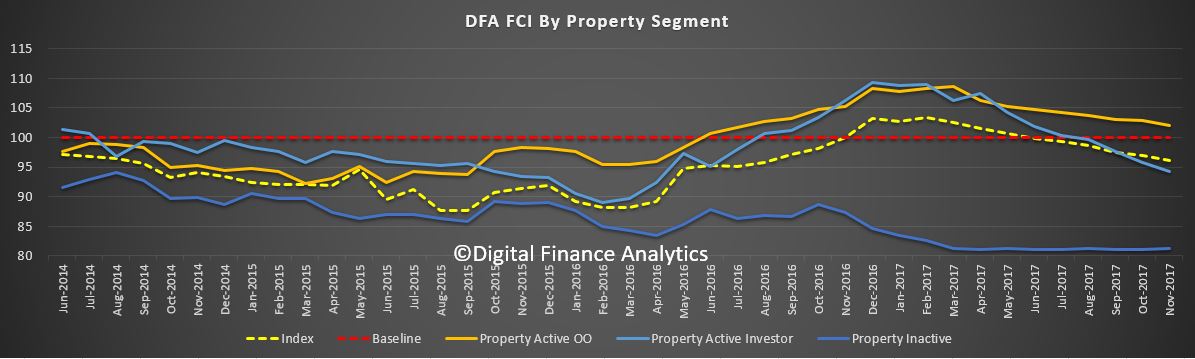
 Looking across our property segments, those not in the property game, and renting or living continue to languish. But we also are tracking falls among property investors, reflecting difficulty in obtain finance, higher interest rates, and falling property prices, and now, also those who are owner occupiers. Both of these property owning segments slid again, mirroring falls in property prices, and the slowing auction clearance rates. That said, those owning property are still relatively more confident about their finances, compared with renters, so the property effect continues.
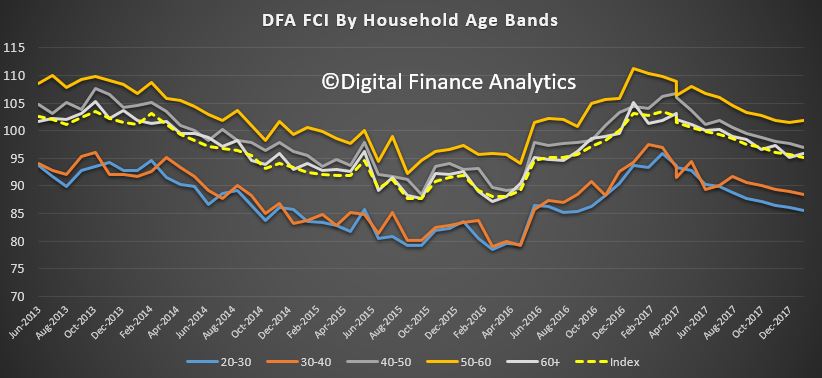
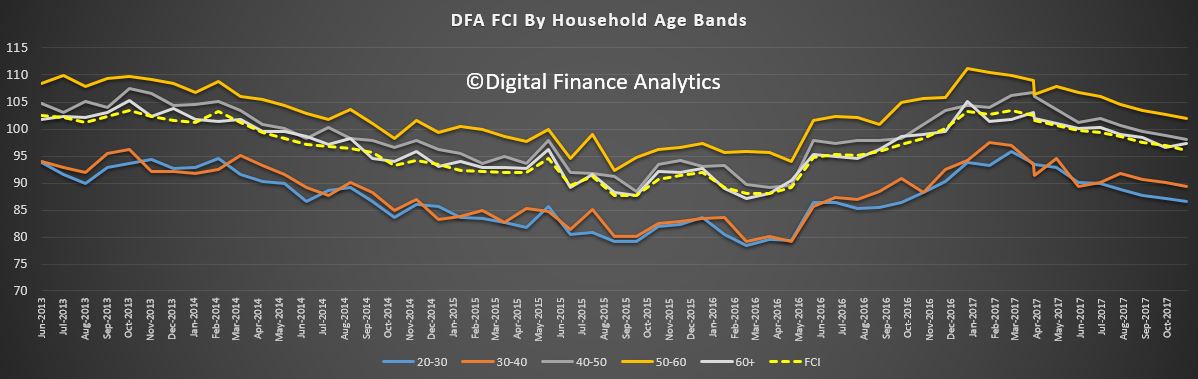
 Across the age bands, those aged 40-50 were a little more confident, reflecting recent stock market progress, especially among those without mortgages (yes, some have paid down their loans completely), while levels of employment remain pretty good. But for younger households the budget pressure on them remains severe, especially those paying rent, or mortgages. Those entering the retirement phase, 60+ continue to wrestle with outstanding mortgages (many hold these loans into retirement now) and also lower returns from deposits.
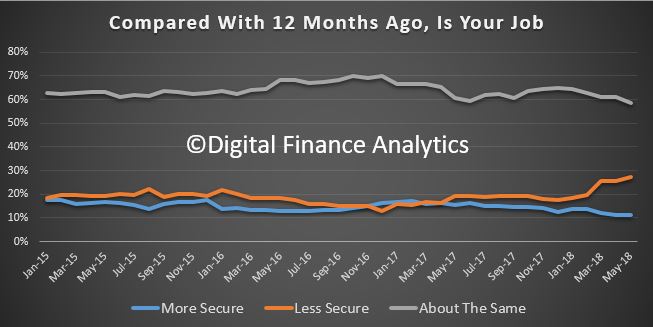
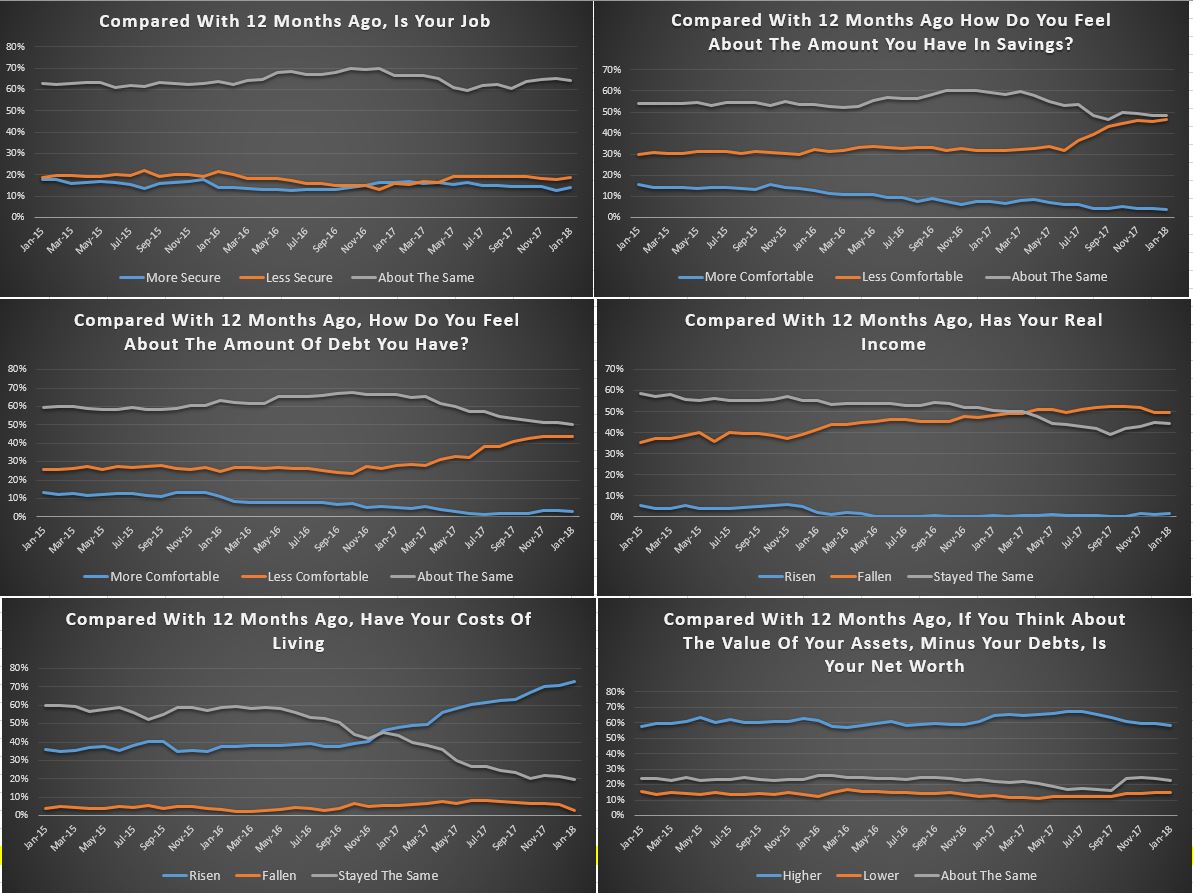
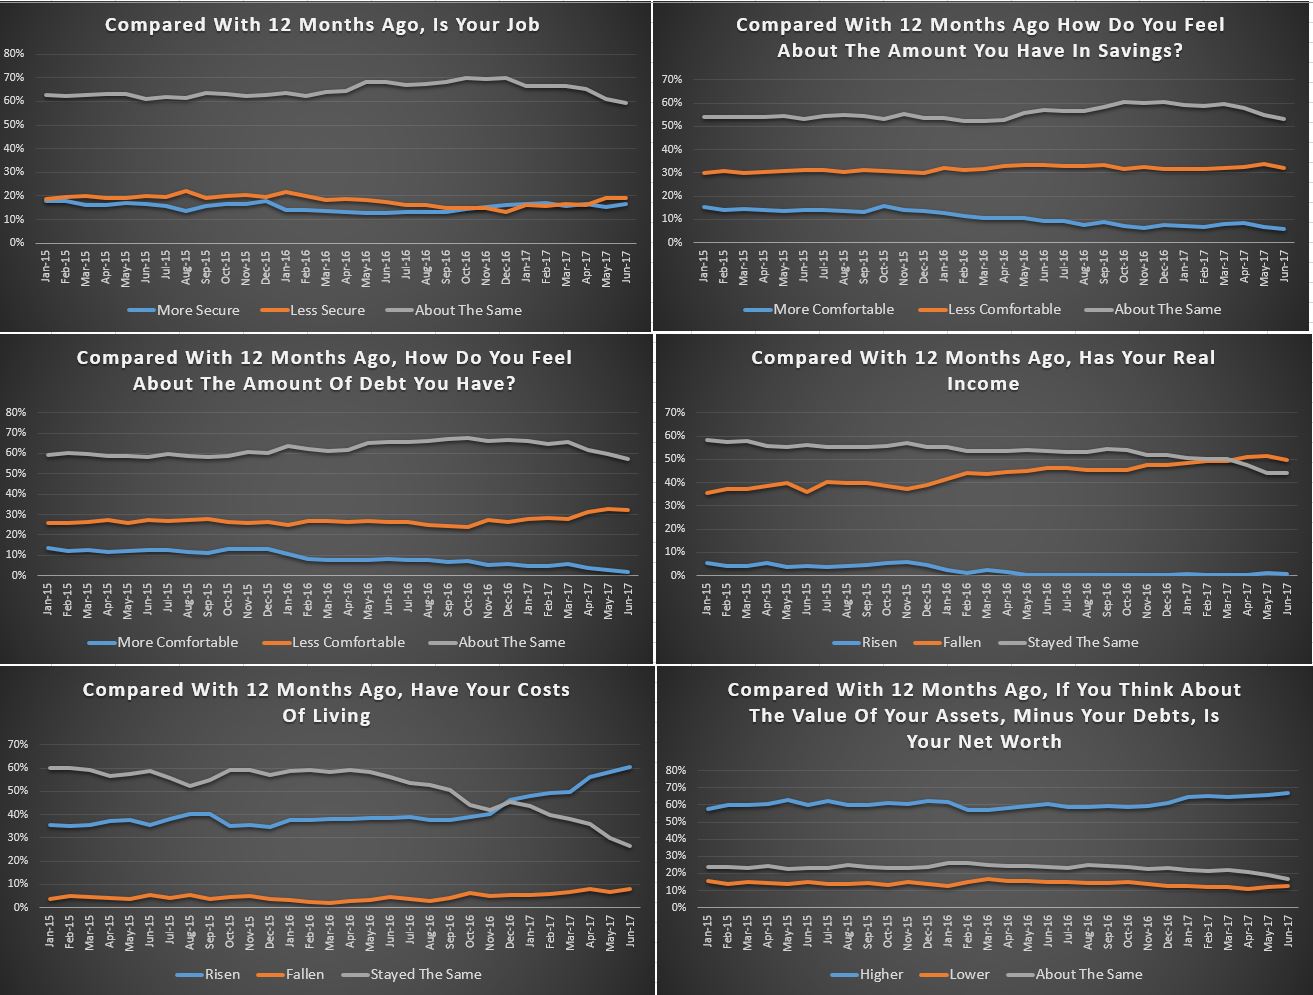
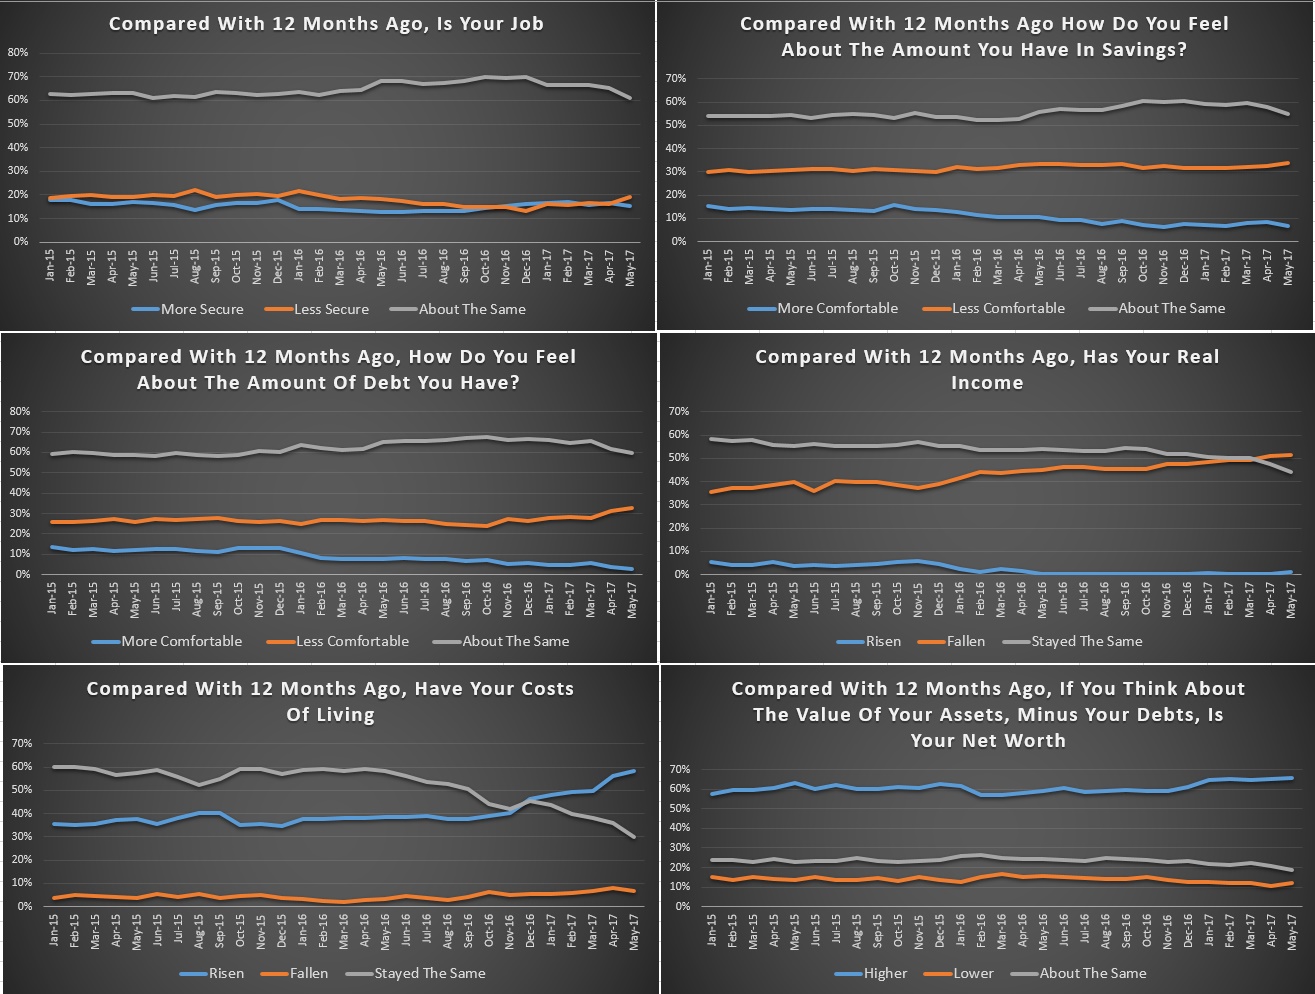
 We can examine the moving parts within the index, to get a sense of what is driving the results. First we look at job security. Something appears to be happening here, as the proportion feeling less secure is rising, up 1.7% compared with last month. There was also a fall by 2.4% of those reporting no change in sentiment compared with last month. Below the hood, it appears that more are involved in multiple part-time jobs, and becoming swept up in the gig economy. Zero-hours contracts appear to be on the rise in some industry sectors. So, while the number of jobs created may be north of one million as the Government often says, we question the quality of these jobs, and their security. Our index reveals another perspective.
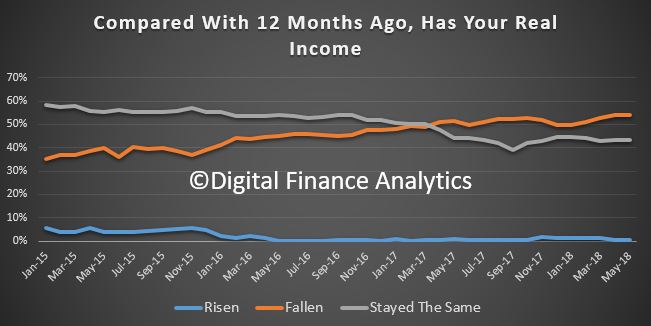
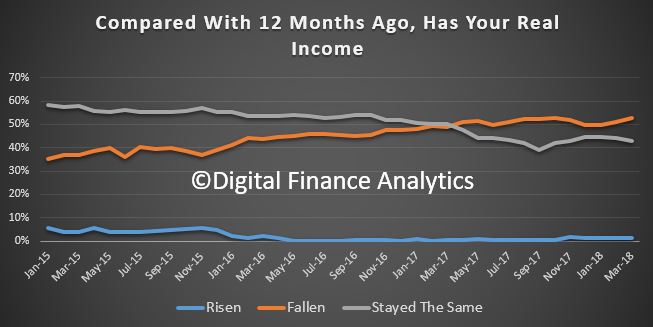
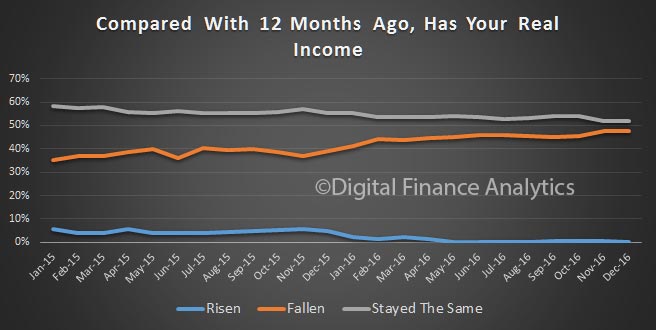
 This may also help to explain the fall in real income (after inflation) many households are experiencing. 54% of households said their incomes had fallen in the past year, and only a small fraction report a rise. 43% say there has been no change since June 2016. There are a number of drivers here, but the main one is simply no, or low pay rises, adjustments to overtime rates, and lower returns from bank deposits. Many older households rely on income from savings and this in under pressure with the current low interest rates, and banks trimming their deposit rates too boot.
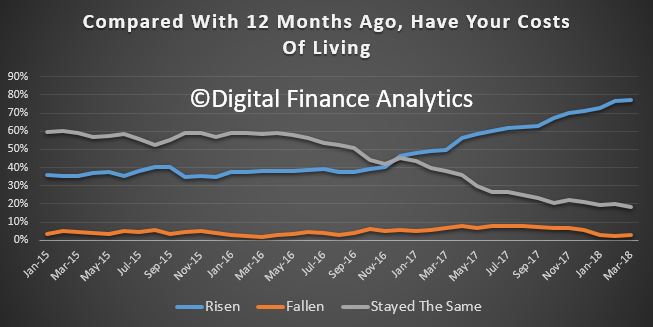
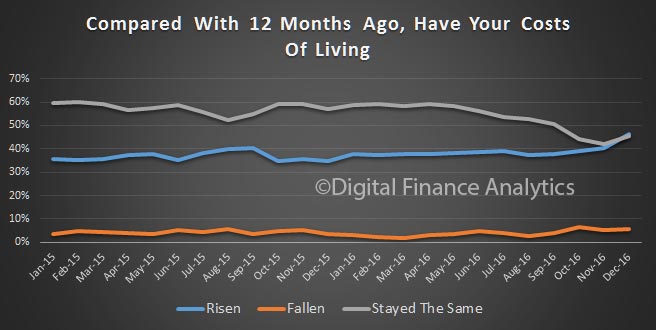
 On the other hand, the costs of living continue higher. Nearly 81% of households say their costs are higher than a year ago, up 2% on last month. The litany of rising categories includes electricity, fuel, health care costs, school fees and child care costs. But households are also reporting higher costs at the supermarket, and a tendency to eat in, rather than out, to keep costs under control. More also turning to credit cards, or pulling equity from their properties to keep the household afloat.
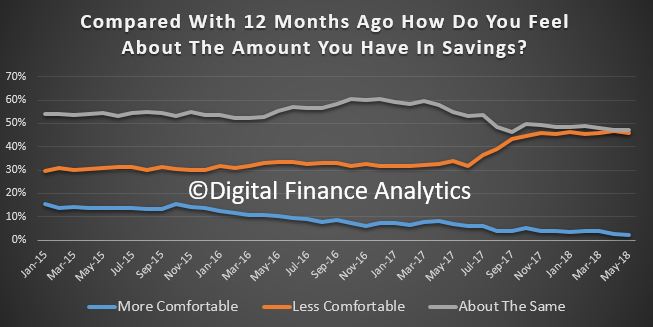
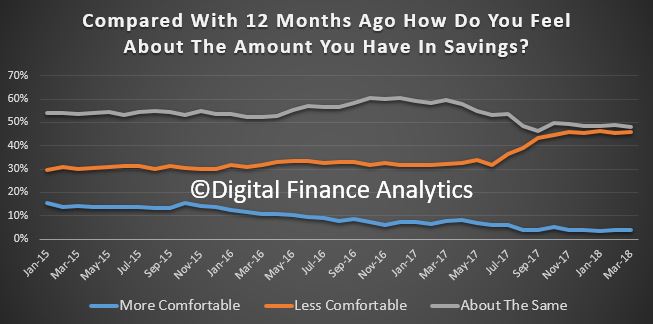
 On the savings front, more are concerned about the amount they have for emergencies. Just 2% are more comfortable compared with last month, while 46% are less comfortable, up 1% on last month. The interest rates offered on bank deposits continue to fall, and this is impacting many who rely on a regular savings generated income. Those who are in the stock market are a little more positive, but the recent crash in bank shares following the revelations from the Royal Commission, and other adverse events, translates to lower confidence. Its worth remembering that nearly half of dividends paid last year came from the financial sector.
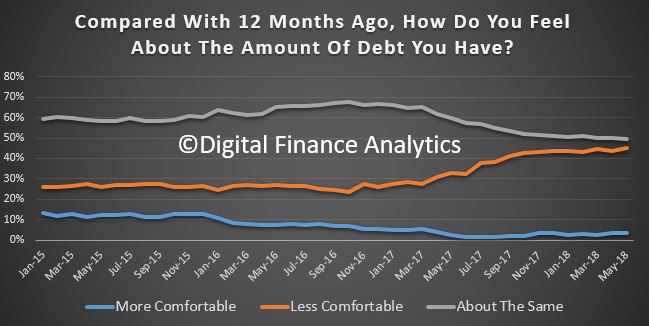
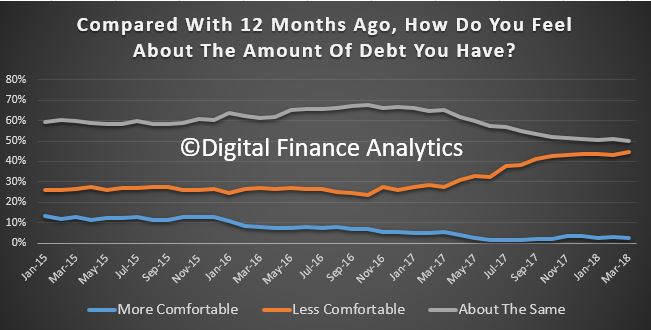
 Households continue to feel the pressure from debt. 45% of households are less comfortable with the debt they owe, up 0.6% from last month. Around 49% remain the same as a year ago, and 3% are more comfortable. The drivers relate to larger mortgages, and higher real mortgage rates (despite some refinancing to gain a lower rate); the inability to get mortgage funding due to tighter lending standards, and a rise in equity withdrawals and some areas of personal credit. While personal credit balances overall are falling, personal debt is concentrated in households with larger mortgages and here it is rising. Payday lending is also on the rise. In addition, households are concerned about the prospect of higher interest rates ahead. Many are stuck in the debt machine.
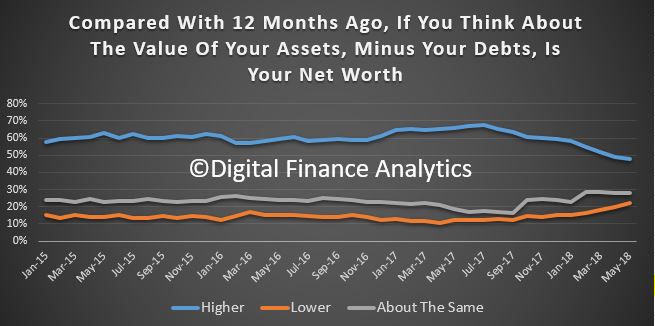
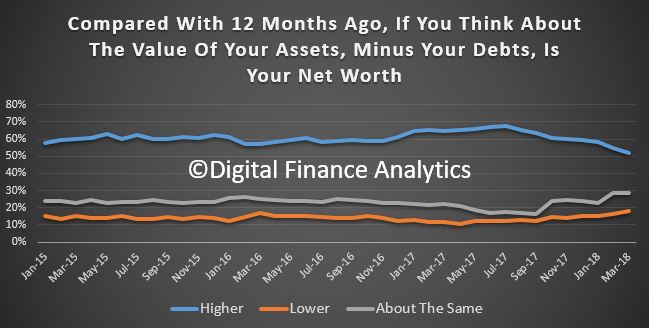
 Finally, and putting the data together, we look at net worth – defined as assets less loans outstanding. 47% of households say their net worth has improved over the past year, down 4% on last month, as property values slide and household debt rises. 22% reported their net worth was lower, up 2% compared with last month and 28% said there was no change in the past year.
 So, the pressures on household finances are clearly visible in these results, and bearing in mind the expected continued fall in home prices, and the prospect of interest rate hike, plus flat incomes, we expect the trend to continue to weaken in the months ahead.
This is certainty a different read compared with the recent headlines of jobs and GDP growth, and it shows the disconnection between the top-line narrative, and the real experiences of households across the country.
Whilst banks have reduced their investor mortgage interest rates to attract new borrowers, we believe there will also be more pressure on mortgage interest rates as funding costs rise, and lower rates on deposits as banks trim these rates to protect their net margins. In the last reporting round, the banks were highlighting pressure on their margins as the back-book pricing benefit from last year ebbs away.

By way of background, these results are derived from our household surveys, averaged across Australia. We have 52,000 households in our sample at any one time. We include detailed questions covering various aspects of a household’s financial footprint. The index measures how households are feeling about their financial health. To calculate the index we ask questions which cover a number of different dimensions. We start by asking households how confident they are feeling about their job security, whether their real income has risen or fallen in the past year, their view on their costs of living over the same period, whether they have increased their loans and other outstanding debts including credit cards and whether they are saving more than last year. Finally we ask about their overall change in net worth over the past 12 months – by net worth we mean net assets less outstanding debts.
We will update the index next month.
The latest Digital Finance Analytics Household Finance Confidence Index for March 2018 shows a further slide in confidence compared with the previous month.
 The current score is 92.3, down from 94. 6 in February, and it has continued to drop since October 2016. The trend is firmly lower.
Across the states, confidence is continuing to fall in NSW and VIC, was little changes in SA and QLD, but rose in WA.
 Across the age bands, there were falls in all age groups.
 Turning to the property-based segmentation, owner occupied householders remain the most confident, while property investors continue to become more concerned about the market. Those who are property inactive – renting, or living with parents or friends remain the least confident. Nevertheless those who are property owners remain more confident relative to property inactive households.
 We can look at the various drivers which underpin the finance confidence index.
We start with job security. This month, there was a rise 6% in households who are less confident about their job security compared with last month, up to 25.8%. Those who felt more secure fell by 1.5% to 12.1% while 61% saw no change. Availability of work was a primary concern, but the security concerns were more around job terms and conditions, and the requirement to work unsocial hours and weekends.
 Turning to concerns about levels of debt, 44.5% of households were more concerned about their outstanding loans, up 1.5% from last month. Under 3% of households were more comfortable with the debt they hold. 49% reported no change this month. Those who were more concerned about debt highlighted concerns about higher interest rates, and the ability to service their current loans in a flat income environment.
 52% of households reported their incomes had fallen in the past month, in real terms. This is up 1.5% this month. Just over 1% of households reported a pay rise, and 43% reported no change in real incomes. More households comprise of members who are working multiple jobs to maintain income.
 In contrast, cost of living continues to rise faster than incomes for many households. 77% of households said their costs had indeed risen, up slightly from last month. 18% of households said costs had stayed the same and 3% said costs had fallen. Households said the costs of electricity, petrol, school fees and child care costs all hit home. Health care costs, and especially the costs of private health care cover also figured in their responses. More households are seriously considering terminating their health insurance cover due to the rising expense.
 Turning to savings, 46% of households were less comfortable with their savings a rise of 1.5% compared with last month. 4% were more comfortable. 50% were about the same. There were ongoing concerns about further falls in interest rates on deposit accounts, and the need to continue to raid savings to support ongoing household budgets.
 Finally, we look at household overall net worth. Despite the volatility seen in the financial markets, the main concern captured in answers to this question related to potential falls in property values. 52% said their total net worth was higher, down 3% from last month. 18% said their net worth was lower, a rise of 2% compared with last month. 28% remained the same. Both those with higher levels of education, and males tended to report more of a rise in net worth. Women were considerable more concerned about the current trajectory of home prices, and the risks relating to future falls. Households in regional centres remained more concerned about their net worth, not least because in many areas home prices have risen less strongly in recent years.
 So in conclusion, based on the latest results, we see little on the horizon to suggest that household financial confidence will improve. We expect wages growth to remain contained, and home prices to slide, while costs of living pressures continue to grow. There will also be more pressure on mortgage interest rates as funding costs rise, and lower rates on deposits as banks trim these rates to protect their net margins.
By way of background, these results are derived from our household surveys, averaged across Australia. We have 52,000 households in our sample at any one time. We include detailed questions covering various aspects of a household’s financial footprint. The index measures how households are feeling about their financial health. To calculate the index we ask questions which cover a number of different dimensions. We start by asking households how confident they are feeling about their job security, whether their real income has risen or fallen in the past year, their view on their costs of living over the same period, whether they have increased their loans and other outstanding debts including credit cards and whether they are saving more than last year. Finally we ask about their overall change in net worth over the past 12 months – by net worth we mean net assets less outstanding debts.
We will update the index next month.
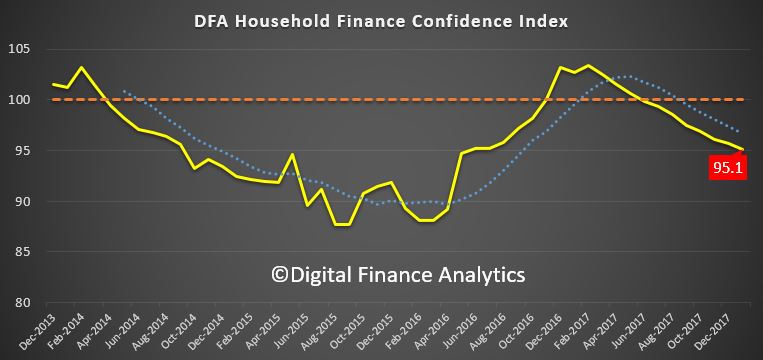
Digital Finance Analytics has released the January 2018 update of our Household Financial Confidence Index, using data from our rolling 52,000 household surveys.
The news is not good, with a further fall in the composite index to 95.1, compared with 95.7 last month. This is below the neutral setting, and is the eighth consecutive monthly fall below 100.
 This result highlights the ongoing disconnect between business confidence, and consumers who are still reeling from rising costs of living, flat incomes and high debt.
Across the age bands, there was a small rise in those older than 50 years, but younger households, from 20 -50 all tracked lower.
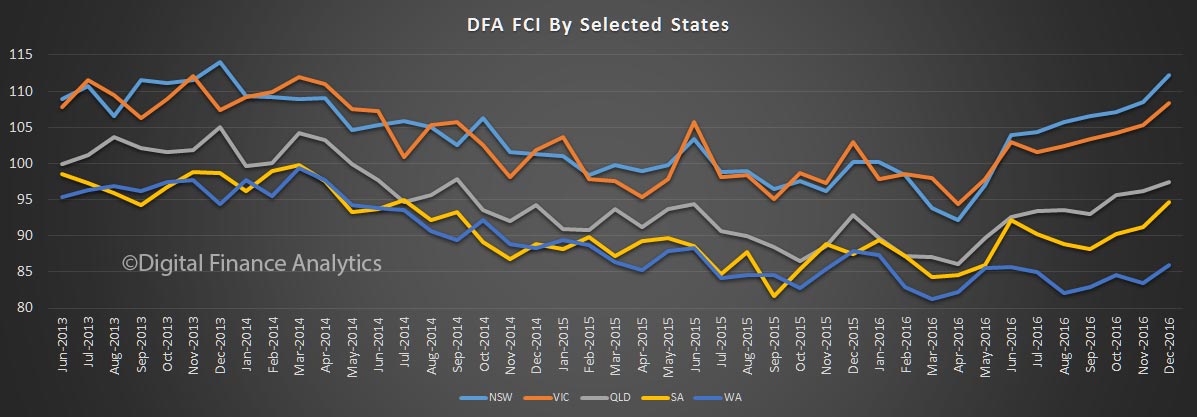
 There was a significant drop in confidence in Victoria, which has now been overtaken again by New South Wales as the most confident state. Confidence fell in South Australia and Queensland, whilst there was little change in Western Australia, which recovered somewhat earlier in the year.
 Household’s property footprint impacts confidence levels significantly, with those who are not property active and so living in rented accommodation sitting significantly below those who own property. Owner occupied property holders saw a small uplift this month, reflecting the lower refinancing rates available, and more first time buyers. However, property investors, traditionally the more bullish, continues to languish, dragging the whole index lower.
 The segmental scorecard shows that whilst job security rose a little, pressure from large levels of debt rose further, with 44% of households less comfortable than a year ago, and only 3% more comfortable. Pressure on savings continues, with lower returns on deposits, and more dipping into savings to pay the bills. 46% of households were less comfortable with their savings, compared with a year ago, and 4% only were more comfortable.
Costs of living pressures are very real, with 73% of households recording a rise, up 1.5% from last month, and only 3% a fall in their living costs. A litany of costs, from school fees, child care, fuel, electricity and rates all hit home.
On the other hand, only 1% of households records a real rise in incomes compared with a year ago, while 50% said their real incomes had been eroded, and 45% stayed the same. More evidence that incomes are rising more slowly than costs. Those employed in the private sector are particularly hard hit, with many recording no pay rises for the past 2 years.
Finally, household net worth is under pressure for some, as property prices slide, and savings are being eroded (despite high stock market prices). Whilst 58% said wealth had improved, 15% recorded a fall, and 23% said there was no change. A further fall in property prices was the overwhelming concern of those holding real-estate, with more than half now expecting a fall in the months ahead. This expectation is already impacting their spending patterns, and have reduced their prospect of buying more property.
 So, overall we see the ongoing slide in household financial confidence, and there is nothing on the horizon which is likely to change momentum. We expect wages growth to remain contained, and home prices to slide, while costs of living pressures continue to grow.
By way of background, these results are derived from our household surveys, averaged across Australia. We have 52,000 households in our sample at any one time. We include detailed questions covering various aspects of a household’s financial footprint. The index measures how households are feeling about their financial health. To calculate the index we ask questions which cover a number of different dimensions. We start by asking households how confident they are feeling about their job security, whether their real income has risen or fallen in the past year, their view on their costs of living over the same period, whether they have increased their loans and other outstanding debts including credit cards and whether they are saving more than last year. Finally we ask about their overall change in net worth over the past 12 months – by net worth we mean net assets less outstanding debts.
We will update the results again next month.
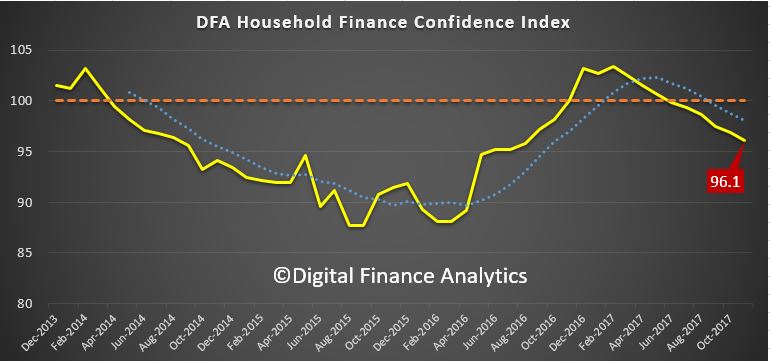
Digital Finance Analytics has released the November 2017 results from our Household Financial Security Index. The index uses data from our household surveys to assess households level of financial comfort.
The index fell to 96.1, which is below the 100 neutral metric, down from 96.9 in October 2017. This is the sixth month in succession the index has been below the neutral point.
 Watch the video or read the transcript.
Owner Occupied households are the most positive, scoring 102, whilst those with investment property are at 94.3, as they react to higher mortgage repayments (rate rises and switching from interest only mortgages), while rental yields fall, and capital growth is stalling, especially in Sydney). Households who are not holding property – our Property Inactive segment – will be renting or living with friends or family, and they scored 81.2. So those with property are still more positive overall.
 Looking across the states, households in NSW and VIC are just above the neutral setting, but continue to slipping lower. Households in QLD are below the 100, but up a little, as are those in SA and WA. Western Australian households are the least positive, but somewhat improved.
 Looking across the age ranges, younger households are the least positive, and all ages banks fell, other than those over 60 years which saw a small rise.
 Looking at the FCI score card, job security is on the improve, reflecting rising employment participation, and the lower unemployment rate. Around 20% of households feel less secure, especially those with multiple part time jobs.
Savings are being depleted to fill the gap between income and expenditure – as we see in the falling savings ratio. As a result, nearly 40% of households are less comfortable with the amount they are saving. This is reinforced by the lower returns on deposit accounts as banks seek to protect margins.
More households are uncomfortable with the amount of debt they hold with 40% of households concerned. The pressure of higher interest rates on loans, tighter lending conditions, and low income growth all adds to the discomfort. More households reported their real incomes had fallen in the part year, with 50% seeing a fall, while 40% see no change. Only those on very high incomes reported real income growth.
 More households reported a rise in their costs of living, and this month this included higher school fees and child care costs, energy bills and fuel costs. The average cpi of around 2% appears to understate the real life experience of many households.
Finally, household net worth improved for more than 60% of households, but there is a rise in those seeing no growth, mainly as home price growth eases back. Those with share market investments have done quite well in recent months.
Looking ahead, we expect the overall index to trend lower, as incomes remain constrained, and costs of living grow. The property market has a big impact on households level of confidence and the leading indicators are flagging lower outcomes ahead. However, home prices would need to fall significantly to allow many of those currently unable to afford to buy in to the market.
By way of background, these results are derived from our household surveys, averaged across Australia. We have 52,000 households in our sample at any one time. We include detailed questions covering various aspects of a household’s financial footprint. The index measures how households are feeling about their financial health. To calculate the index we ask questions which cover a number of different dimensions. We start by asking households how confident they are feeling about their job security, whether their real income has risen or fallen in the past year, their view on their costs of living over the same period, whether they have increased their loans and other outstanding debts including credit cards and whether they are saving more than last year. Finally we ask about their overall change in net worth over the past 12 months – by net worth we mean net assets less outstanding debts.
We will update the results again next month.
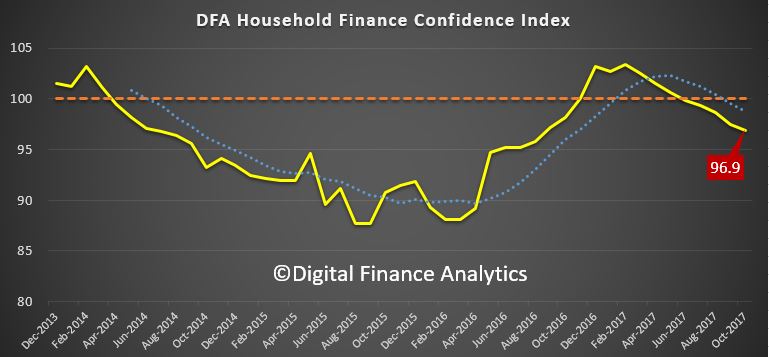
The latest edition of the Digital Finance Analytics Household Financial Security Confidence Index to end October shows households are feeling less secure about their finances than in September. The overall index fell from 97.5 to 96.9, and remains below the 100 neutral setting. We use data from our household surveys to calculate the index.
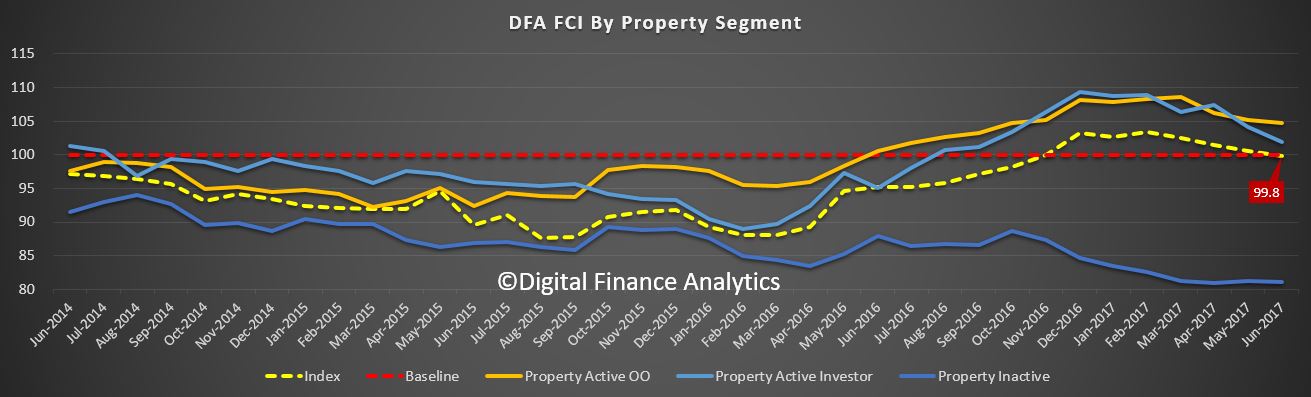
 While households holding property for owner occupation remain on average above the neutral setting, property investors continue to slip further into negative territory, as higher mortgage rates bite, rental returns slide and capital growth in some of the major markets stalls. Those property inactive households remain the most insecure however, so owning property in still a net positive in terms of financial security.
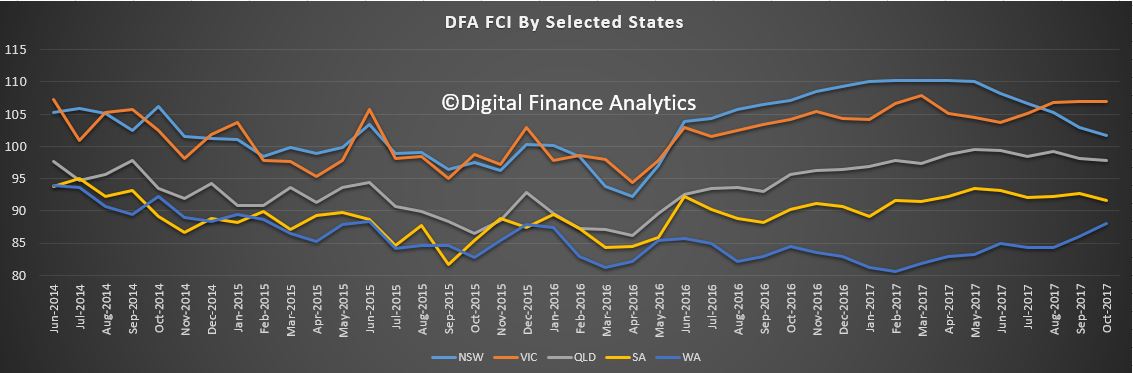
 There are significant variations across the states. VIC households continue to lead the way in terms of financial confidence, and WA households are moving up from a low base score. However, households in NSW see their confidence eroded as prices slide in some post codes (the average small fall as reported does not represent the true variation on on the ground – some western Sydney suburbs have fallen 5-10% in the past few months). Households in QLD and SA on average have held their position this month.
 Confidence continues to vary by age bands, although the average scores have drifted lower again. Younger households are consistently less confident, compared with older households, who tend to have smaller mortgages relative to income, and more equity in property and greater access to savings.
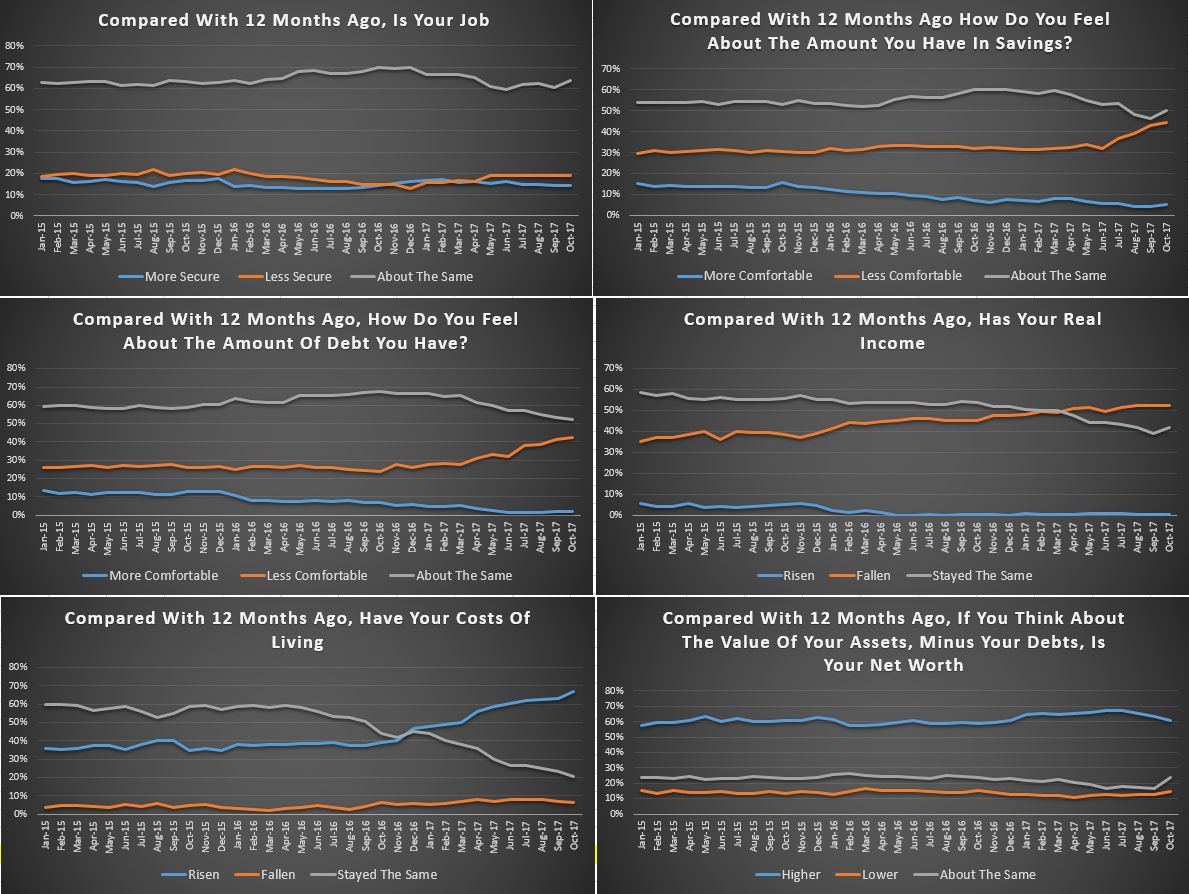
 Looking in more detail at the FCI scorecard, 63% of household saw no change in their job prospects last month, while 19% felt less secure, especially in WA and SA. Those with savings were a little less comfortable, reflecting both a net reduction in the amount saved (more households are raiding their savings to cover their costs of living) and lower interest rates on deposits. Those with shares and other investments benefited from higher stock prices.
The burden of debt weighed heavy on many households with 42% of households less comfortable with their debt, a rise of 1.4% in the month. Some were concerned about potential interest rate rises, while others, especially those on interest only loans, were exercised by the prospect of having to refinance down the track.
More than half of households say their real incomes have fallen in the past year, and 67% said their costs of living have risen, up 4.1% from last month. Utility bills are higher, as are child care costs and school fees. We see more household relying on multiple part-time jobs to bring in sufficient income to pay the bills, and even then many are having to tap into savings to keep afloat.
 We see little evidence of income growth in real terms, while credit growth continues at more than three time income. Given the recent slide in property values, and continued rises in living costs, we do not expect the index to move back into positive territory in the next few months.
By way of background, these results are derived from our household surveys, averaged across Australia. We have 52,000 households in our sample at any one time. We include detailed questions covering various aspects of a household’s financial footprint. The index measures how households are feeling about their financial health. To calculate the index we ask questions which cover a number of different dimensions. We start by asking households how confident they are feeling about their job security, whether their real income has risen or fallen in the past year, their view on their costs of living over the same period, whether they have increased their loans and other outstanding debts including credit cards and whether they are saving more than last year. Finally we ask about their overall change in net worth over the past 12 months – by net worth we mean net assets less outstanding debts.
We will update the results again next month.
Digital Finance Analytics has today released the Household Finance Confidence index to June 2017, and the news is not good. Overall the index has dropped below the neutral setting and appears to be trending lower. The current reading is 99.8% compared with 100.6 in May.
 The fall is being driven by a confluence of issues, none new, but now writ large. Households are seeing the costs of living rising (especially power costs, child care costs and council rates), whilst household income remains depressed and is falling in real terms. Returns on deposits actually fell as well, so mortgage repricing is not being matched by better saving rates. The costs of mortgage repayments rose.
The most significant fall in confidence was in the property investor segment, where loan repricing has been more pronounced, whilst rental incomes are hardly growing. They are also concerned about slowing capital appreciation. However it is still true that property owners have their confidence buttressed relative to property inactive households who are more likely to be renting, and see no rise in their net worth.
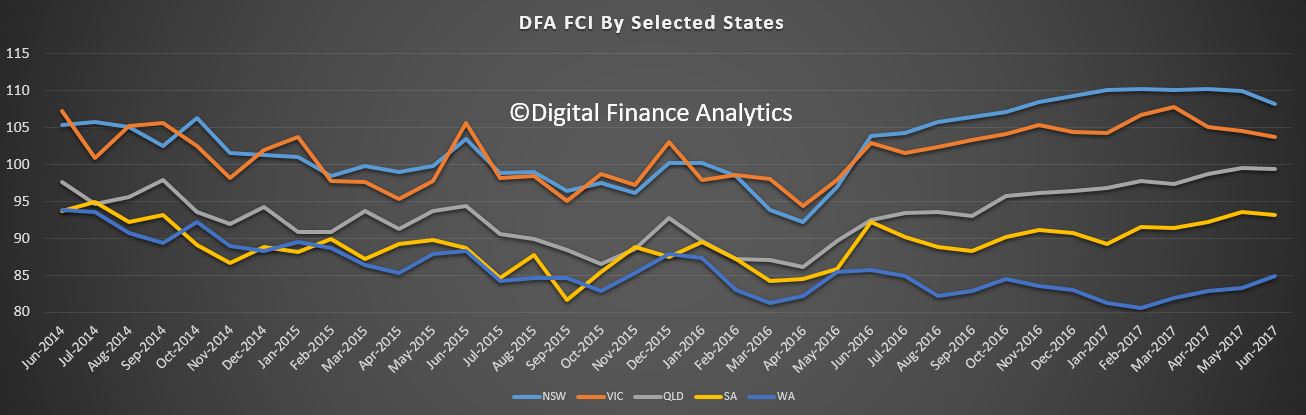
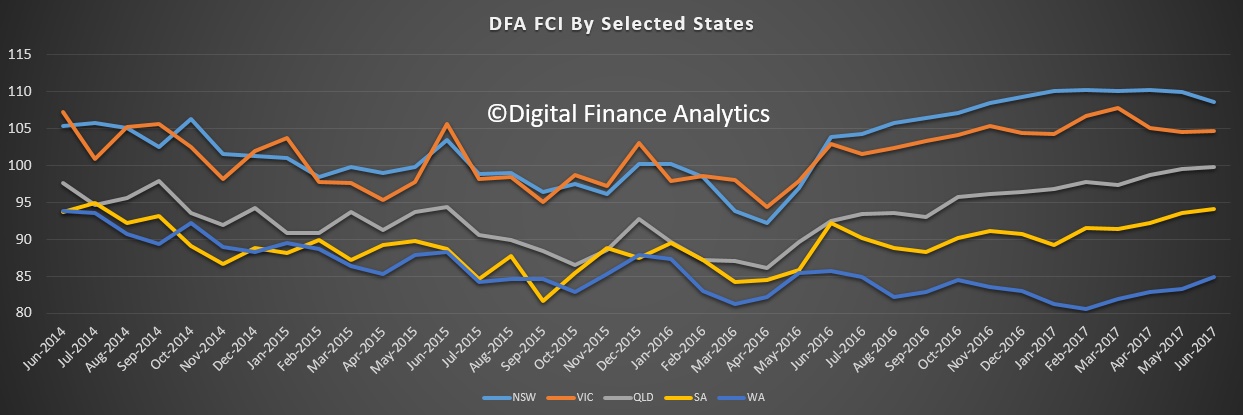
 Looking across the states, confidence is still highest in the booming states of NSW and VIC, though down a bit; whilst WA is recovering a little from lows earlier in the year.
 Looking at the scorecard, households are more concerned about the amount of debt they hold, real incomes continue to fall and costs of living continue to rise. This despite job security not being a major concern. Take home pay however is.
 We expect to see the index fall further as we move into spring, as more price hikes come though (e.g 20% uplift in electricity for many). The raft of mortgage rate repricing still has to work though and income growth will remain contained. Sentiment in the property sector is clearly a major influence on how households are felling about their finances, but the real dampening force is falling real incomes.
By way of background, these results are derived from our household surveys, averaged across Australia. We have 52,000 households in our sample at any one time. We include detailed questions covering various aspects of a household’s financial footprint. The index measures how households are feeling about their financial health. To calculate the index we ask questions which cover a number of different dimensions. We start by asking households how confident they are feeling about their job security, whether their real income has risen or fallen in the past year, their view on their costs of living over the same period, whether they have increased their loans and other outstanding debts including credit cards and whether they are saving more than last year. Finally we ask about their overall change in net worth over the past 12 months – by net worth we mean net assets less outstanding debts.
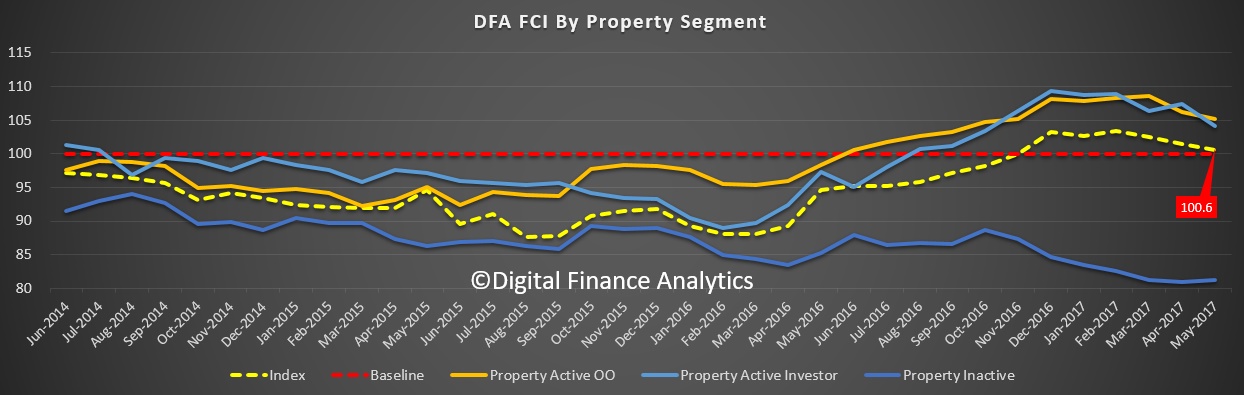
The results from the latest Digital Finance Analytics Household Finance Confidence Index to end May 2017 is released today, and shows a lower overall score of 100.6, down from 101.5 last month. This is firmly in the neutral zone, but households with mortgages are feeling the pinch and the index is set to go lower in months ahead.
 Both property investors and owner occupiers are more concerned about rising mortgage interest rates, and potentially falling property prices. There was less change in households who are property inactive, which shows how the dynamics of property is directly influencing confidence, but this group has a lower level of confidence to start with.
 The biggest slide was in NSW, where the overall score is still the highest across the states, but is turning lower. Talk of lower prices, is hitting confidence. WA confidence is rising a little, but from a low baseline and there were small rises in QLD and SA.
 Looking at the scorecard which drives the index, we see households have become a little more concerned about future job prospects, are less comfortable with savings returns, but significantly more concerned about the debt burden they are carrying in the context of falling real incomes, whilst costs of living continue to spiral higher. This despite net worth still rising for many.
 Sentiment in the property sector is clearly a major influence on how households are felling about their finances, but the real dampening force is falling real incomes. This is unlikely to correct any time soon, so we expect continued weakness in the index as we go into winter.
By way of background, these results are derived from our household surveys, averaged across Australia. We have 52,000 households in our sample at any one time. We include detailed questions covering various aspects of a household’s financial footprint. The index measures how households are feeling about their financial health. To calculate the index we ask questions which cover a number of different dimensions. We start by asking households how confident they are feeling about their job security, whether their real income has risen or fallen in the past year, their view on their costs of living over the same period, whether they have increased their loans and other outstanding debts including credit cards and whether they are saving more than last year. Finally we ask about their overall change in net worth over the past 12 months – by net worth we mean net assets less outstanding debts.
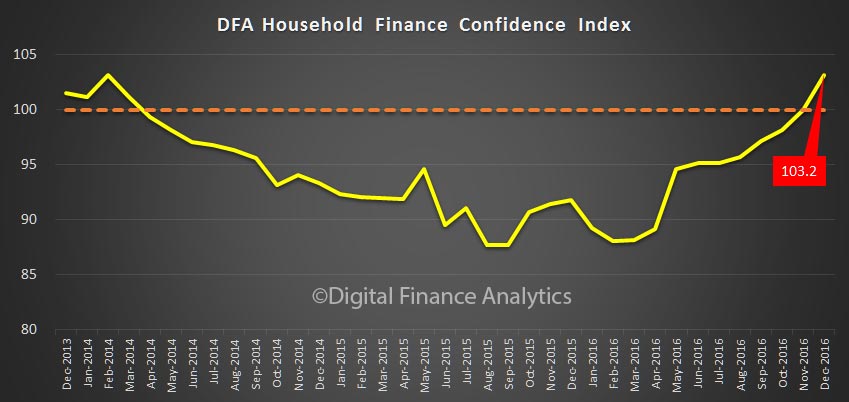
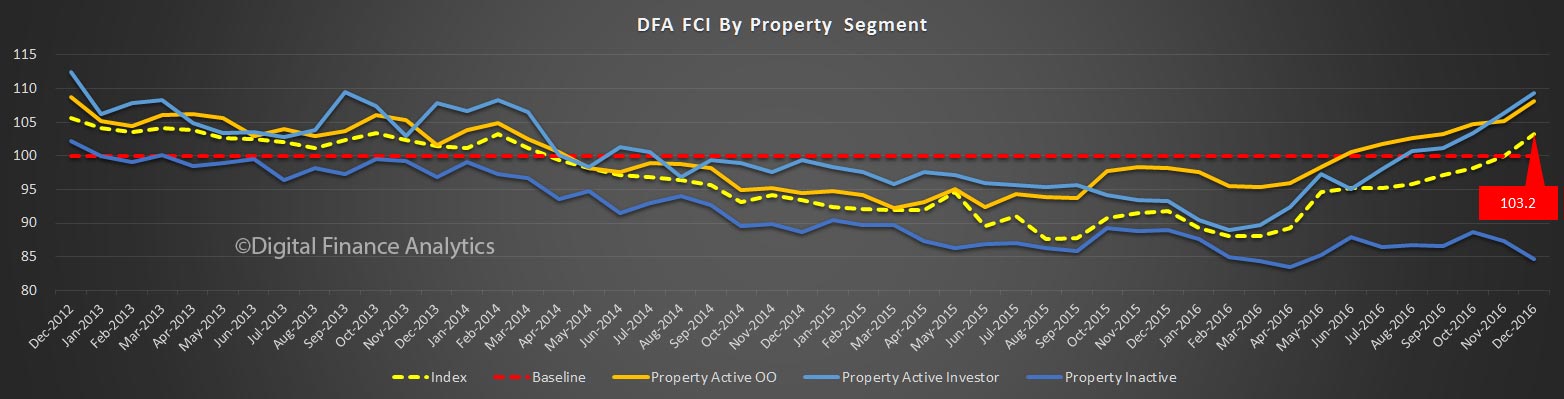
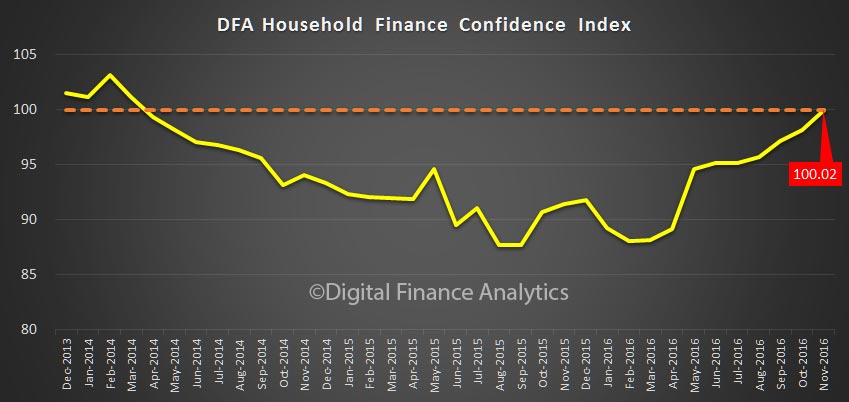
The latest Digital Finance Analytics Household Finance Confidence Index, to end December is released today. Overall household confidence is buoyant, and above the neutral setting. Sitting at 103.2, it is up from 100.02 in November.
 The property “fairy” has been generous in that property is the key to the index at the moment, with positive news on home price rises, and the effect of the low interest rates following the last RBA cash rate cut flowing through. Home owners with an investment property have now overtaken the confidence score of owner occupied property holders, but both are higher. Those households who are not property active however continue to languish.
 We see significant state variations, with those in NSW and VIC most confident, whilst those in WA, although slightly higher, is significantly off the pace. The impact of changes to the first owner grant there will not flow through into the results for some time to come.
 The impact of positive property news has swamped a couple of the negative indicators. For example, more households are saying their costs of living have risen in the past 12 months.
 In addition, real incomes, after adjusting for inflation are static or falling. Very few have had any pay rises above inflation, and many none at all.
 So, it seems the future of household confidence is joined at the hip with the future of property. In the light of our recent mortgage default modelling, in a rising interest rate market, this may be a concern as we progress through 2017. But at the moment, households are having a party!
By way of background, these results are derived from our household surveys, averaged across Australia. We have 26,000 households in our sample at any one time. We include detailed questions covering various aspects of a household’s financial footprint. The index measures how households are feeling about their financial health. To calculate the index we ask questions which cover a number of different dimensions. We start by asking households how confident they are feeling about their job security, whether their real income has risen or fallen in the past year, their view on their costs of living over the same period, whether they have increased their loans and other outstanding debts including credit cards and whether they are saving more than last year. Finally we ask about their overall change in net worth over the past 12 months – by net worth we mean net assets less outstanding debts.
The latest data from the Digital Finance Analytics Household Finance Confidence Index shows a further improvement, with the November score now just above the 100 neutral position at 100.02. This is up from 98.2 in October, and the first time since 2014 we have been above the neutral setting.
 The full effect of recent rate changes and the availability of low-rate fixed mortgages, together with climbing home values in most states, combined, have driven both home owners, and property investors confidence higher. In fact, for the first time in more than a year, property investors are more confident than owner occupiers. On the other hand, the one-third of households excluded from the property market drifted lower, thanks to higher costs of living and static or falling incomes.
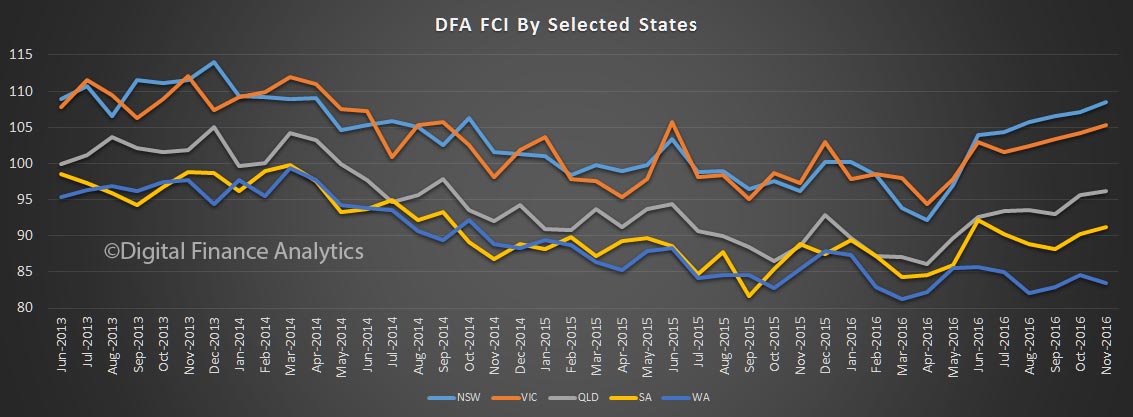
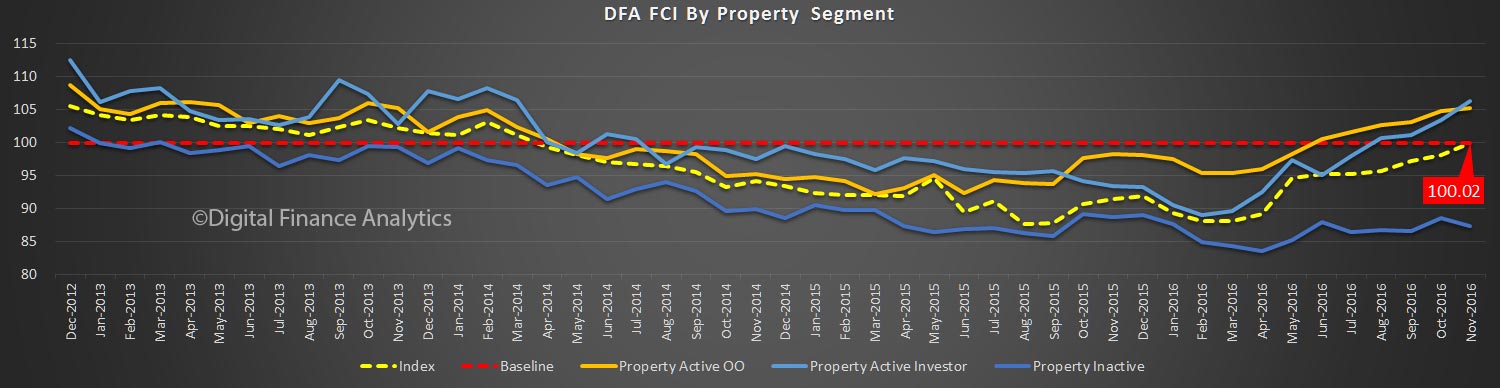 Looking across the states, households in NSW are much more confident, with VIC slightly behind. Households in WA reported a fall in confidence, thanks to poorer employment prospects and falling home prices.
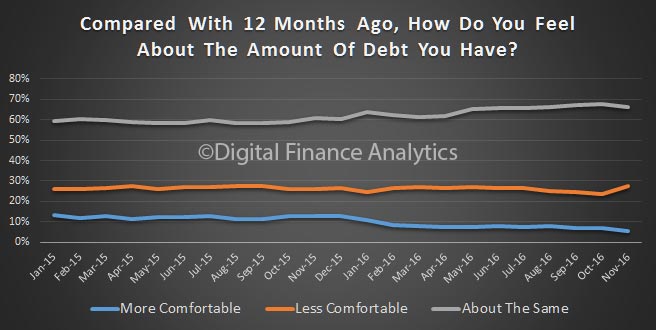
 On average households were a little less comfortable with the amount of debt they hold, thanks to expectations that interest rates have passed their low point, and will rise. 27.6% of households were less comfortable, up 3.9% from last month.
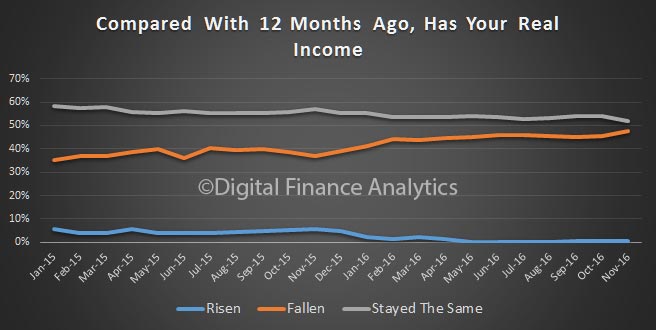
 We also see a continued fall in real incomes, thanks to rising costs and flat or falling pay. 47.5% said their incomes had fallen, in real terms, in the past year, up 2.3% last month.
 Households reported improved investment incomes from stocks and term deposits. However, appetite for investment property, especially down the east coast remains strong.
On average, younger households were less confident compared with those aged above 50 years.
By way of background, these results are derived from our household surveys, averaged across Australia. We have 26,000 households in our sample at any one time. We include detailed questions covering various aspects of a household’s financial footprint. The index measures how households are feeling about their financial health. To calculate the index we ask questions which cover a number of different dimensions. We start by asking households how confident they are feeling about their job security, whether their real income has risen or fallen in the past year, their view on their costs of living over the same period, whether they have increased their loans and other outstanding debts including credit cards and whether they are saving more than last year. Finally we ask about their overall change in net worth over the past 12 months – by net worth we mean net assets less outstanding debts.