Household Wealth Up (and Down)

The ABS released their latest Household Finance and Wealth Statistics to March 2019.

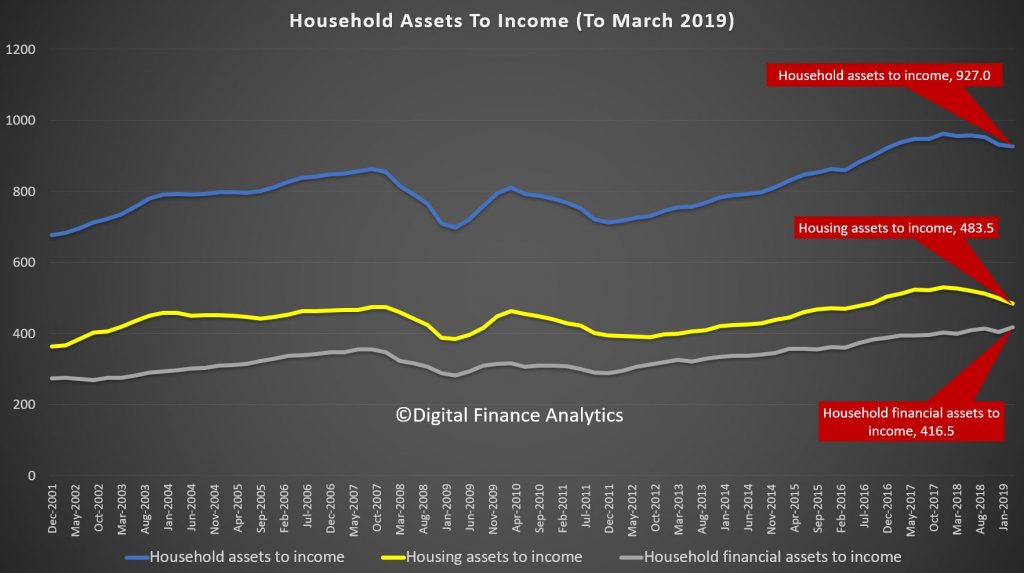
Household wealth per capita decreased for a third consecutive quarter to $404,556.4, falling $1,511.9. This follows a record $9,992.7 fall in household wealth per capita in the previous quarter, and reflects the continued holding losses on residential land and dwellings.

The falls in property values were offset by rises in stock markets (for those with shares/superannuation). Residential land and dwellings experienced real holding losses for a fifth consecutive quarter.

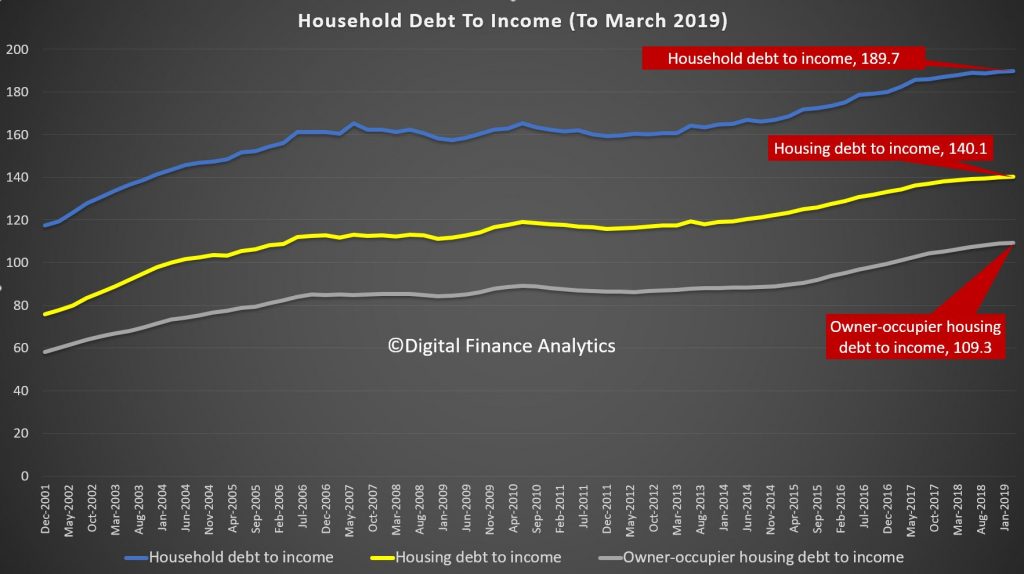
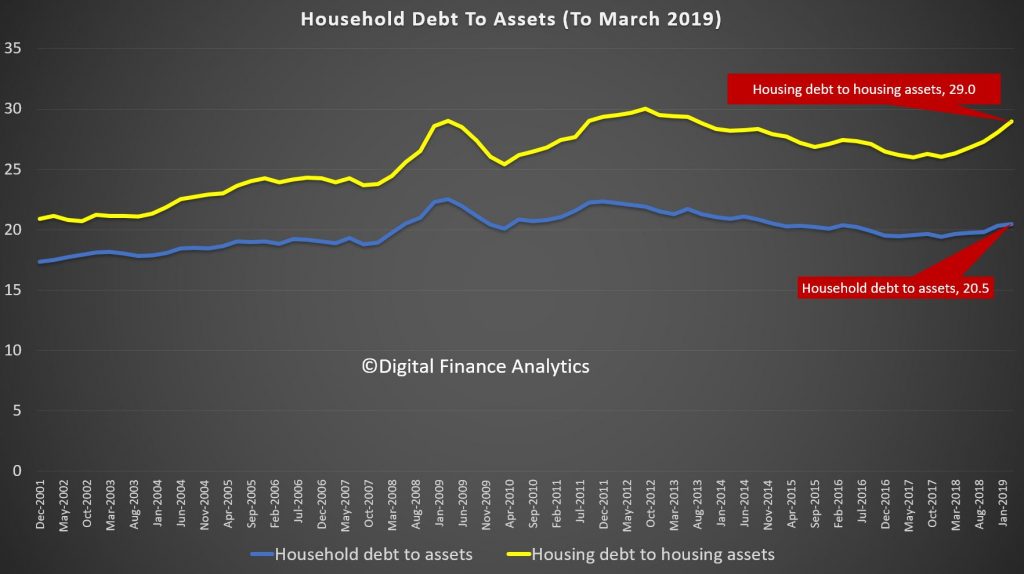
Household debt to assets ratio increased from 19.3% to 19.4%, as growth in household debt (0.7%) outweighed the increase in total assets (0.3%).

The mortgage debt to residential land and dwellings ratio increased from 28.1% to 29.0% and is the largest quarterly increase since September quarter 2011.

A fall in gross disposable income was driven by falls in compensation of employees and gross mixed income.

Household wealth (net worth) increased 0.2% in the March quarter 2019, a positive turn around from the decline of 2.1% recorded in the previous quarter. A rebound in the Australian stock market drove increases in real holding gains on financial assets ($147.8b), recovering the real holding losses ($146.2b) in the previous quarter. Positive revaluations on reserves of pension funds (superannuation) accounted for 68.0% of holding gains on household financial assets, reflecting the 70% of investment of total pension fund assets in shares which in turn was helped by the rebound in the Australian stock market. Residential land and dwellings experienced real holding losses for a fifth consecutive quarter and offset the gains on financial assets during the quarter. Through the year, household wealth decreased 0.7%, reflecting continued falls in residential property prices.

The percentage point contributions to the change in household wealth were:

  • Financial assets contributed 1.8 percentage points
  • Financial liabilities detracted 0.2 percentage points
  • Land and dwellings detracted 1.5 percentage points.

Graph 1. Net worth and residential land and dwellings year-on-year growth

Graph 1 shows Net worth and residential land and dwellings year-on-year growth

Household wealth per capita decreased for a third consecutive quarter to $404,556.4, falling $1,511.9. This follows a record $9,992.7 fall in household wealth per capita in the previous quarter, and reflects the continued holding losses on residential land and dwellings.

Real holding gains on financial assets drove a 0.3% increase in total household assets, following a 1.5% fall in the previous quarter. Household liabilities grew 0.7%, with through the year growth at 3.7%, which is its lowest rate since March quarter 2013. This weakness is driven by soft growth in long term loans, which account for 92.0% of household liabilities.

Household transactions in net worth were $28.9b. The largest component at $23.0b, was the net acquisition of financial assets ($36.0b), with superannuation reserves the main contributor, followed by shares and other equity. Net capital formation at $6.0b was driven by net acquisitions of land and dwellings ($7.9b). These were offset by net incurrence of liabilities ($13.0b), driven by transactions in long term loans.


Household debt to assets ratio increases

The household debt to assets ratio gives an indication of the extent to which the overall household balance sheet is geared. Household debt to assets ratio increased from 19.3% to 19.4%, as growth in household debt (0.7%) outweighed the increase in total assets (0.3%).

The mortgage debt to residential land and dwellings ratio increased from 28.1% to 29.0% and is the largest quarterly increase since September quarter 2011. The rise in ratio reflects the fall in the value of residential land and dwellings (2.6%) together with an increase in mortgage debt (0.6%). Despite the large increase in the ratio, it is predominantly driven by the continued fall in the value of residential land and dwellings, as growth in mortgage debt has reduced to its slowest pace since September quarter 2013.

The household debt to liquid assets ratio reflects the ability of households to quickly extinguish debts using liquid assets (currency and deposits, short and long term debt securities, and equity). The household debt to liquid asset ratio decreased from 113.9% to 112.5%. The decrease in the debt to liquid assets ratio indicates growth in household liquid assets (2.0%) outweighed growth in household debt (0.7%). Growth in liquid assets was driven by increases in equity and deposits of 3.2% and 1.0% respectively, while the slow growth in debt reflects weak growth in household loan borrowing.

Graph 2. Risk ratios

Graph 2 shows Risk ratios

The wealth effect

Household net saving increased $6.8b to $9.5b, driven by a decrease in final consumption expenditure ($17.7b), partly offset by a decrease in gross disposable income ($10.6b) and an increase in consumption of fixed capital ($0.3b). The fall in gross disposable income was driven by falls in compensation of employees and gross mixed income.

Household gross disposable income adjusted for other changes in real net wealth (wealth effect) increased $263.5 from $18.9b to $282.5b, reflected by real holding gains on financial assets. Household net saving adjustment for other changes in real net wealth increased to -$10.4b, from -$291.3b in the previous quarter. The $280.9b increase in household net saving plus other changes in net wealth reflects the real holding gains on financial assets, however the household sector remains in a dis-saving position for third consecutive quarter due to the continued real holding losses on residential land and dwellings.

Graph 3. Net saving plus other changes in real net wealth, original

Graph 3 shows Net saving plus other changes in real net wealth, original

Australia continued to borrow from overseas to fund investment, borrowing $1.0 billion from non-residents during the March quarter as national investment exceeded national saving. In seasonally adjusted terms, Australia has been a net borrower from overseas since the September quarter 1975.

National investment decreased $22.2b in March quarter 2019 to $100.9b. The fall comes off the back of a record high in the December quarter 2018 and, despite the decrease, remains at high levels.

Graph 1. Total capital formation, current prices

Graph 1 showsTotal capital formation, current prices

Private non-financial corporations invested $39.5b over the quarter, down $8.5b from December. Investment in machinery and equipment was down this quarter, while the decline in mining investment continued as significant LNG projects move into the production phase.

Households invested $36.4b, down $9.6b from the previous quarter. The decrease was driven by falls in dwelling investment and ownership transfer costs, reflecting the weak conditions in the residential housing market.


Australia’s borrowing narrows to $1 billion

National net borrowing of $1.0b in March quarter 2019 was the lowest since December quarter 1983. The $1.0b worth of lending by the rest of the world was derived by repayments of their liabilities ($18.2b) being larger than the disposal of their financial assets ($17.2b).

During the quarter, rest of the world acquired $15.1b of private non-financial corporations’ shares and other equity but these were offset by maturities of their holdings of bank one name paper ($21.3b) and settlements of their bank derivative contracts ($17.1b). On the liabilities side, rest of the world borrowed $11.1b of short term loans from banks and other private non-financial corporations, and paid off their long term bank loans ($24.0b) and settled their derivative contracts with banks ($16.8b).

Graph 2. Net financial investment (net lending (+) / net borrowing (-))

Graph 2 shows Net financial investment (net lending (+) / net borrowing (-))

Net borrowing by non-financial corporations was $13.8b driven by loan borrowing of $17.5b and net issuances of equity of $13.2b.

The general government was a net lender of $956m this quarter driven by maturities of long-term debt securities of $5.1b.

Households were net lenders of $23.0b, accruing $18.8b in net equity in reserves of pension funds (superannuation) and $10.0b of deposits. These were offset by their loan borrowing of $9.9b.

Credit market rebounds on valuation increases in equities and bonds

Credit market outstanding of the non-financial domestic sectors rose 2.8% in March quarter 2019, following last quarter’s fall of 0.7%. Valuation increases in the equity of other private non-financial corporations drove the result, aided by valuation increases in government bonds as yields fell.

Graph 1. Credit market outstandings

Graph 1 shows Credit market outstandings.

Demand for credit was subdued as the government repays debt

National general government demand for credit fell $4.0b this quarter. Debt repayment outweighed new issuance of bonds for the first time since June quarter 2013, as the government’s net saving position continues to improve.

Credit was raised mainly in the loan market by other private non-financial corporations ($13.7b) and households ($9.9b). However, through the year growth in household borrowing continues to slow due to tighter lending conditions and falling investor demand in the residential property market.

Equity raised by other private non-financial corporations was $12.0b after a subdued December quarter 2018 which reflected the share buy backs of major mining companies.


Graph 2. Total demand for credit

Graph 2 shows Total demand for credit.

Are You Budgeting For The Extras? [Podcast]

Property expert Joe Wilkes and I discuss some of the hidden traps when budgeting for a mortgage.

Digital Finance Analytics (DFA) Blog
Are You Budgeting For The Extras? [Podcast]
Loading
/

More Are Retiring With High Mortgage Debt! [Podcast]

We look at a recent The Conversation article which spells out the problems ahead for many older Australians with mortgages.

Digital Finance Analytics (DFA) Blog
More Are Retiring With High Mortgage Debt! [Podcast]
Loading
/

Housing market unlikely to rebound soon

Despite the recent surge of optimism regarding the property market, one financial analyst feels that the relief is misplaced, via Australian Broker.

“There are some people now claiming that property prices have hit bottom and it’s all up and away from here. But then, there are others who rightly focus on the burden of debt, which is very big and means there will be some limitation to how far property prices can reverse,” explained Martin North, principal of Digital Finance Analytics.

“There is significantly more interest in property now than there was a few weeks ago, yes. But the jury is still out on whether that will translate to sustainable reductions in the fall of home prices, and rises ahead. The probability of coming into a property boom anytime soon is very limited.”

According to North, a large part of the issue lies in a crucial and crippling disparity in supply and demand.

ABS data reports there are more than one million vacant properties in Australia currently, yet 200,000 new dwellings are scheduled to be built in the next two years.

Aspiring housing market entrants are being barred by tightened lending, immigration has stagnated and investors are not only disinterested in returning to the market, but many are actively trying to sell the properties they do have.

“That’s why I’m still thinking that there’s plenty of room on the downside for property values to continue to fall,” explained North.

Even the initiatives recently proposed, such as APRA changing the servicing rate floor or the promised first home buyer scheme, are likely to have only a “small and positive effect, not a dramatically large one.”

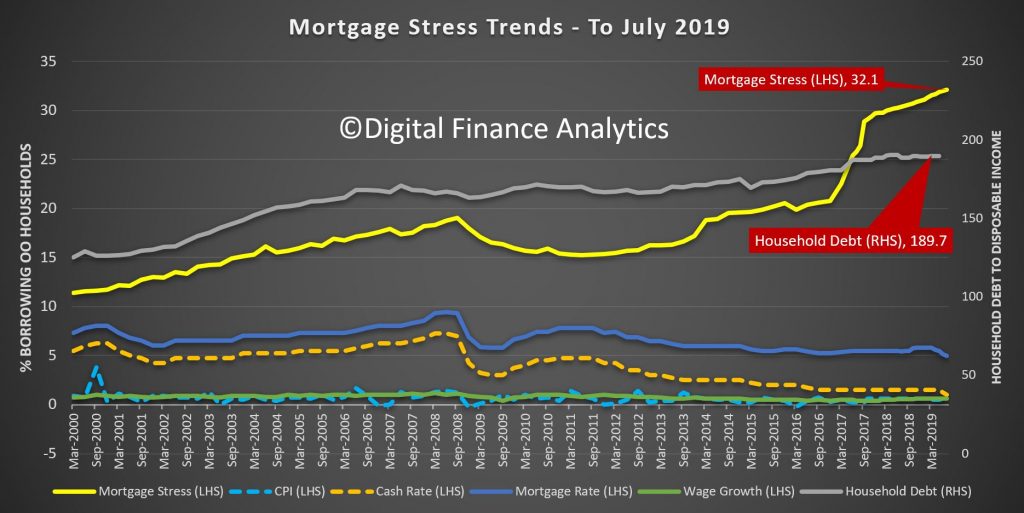
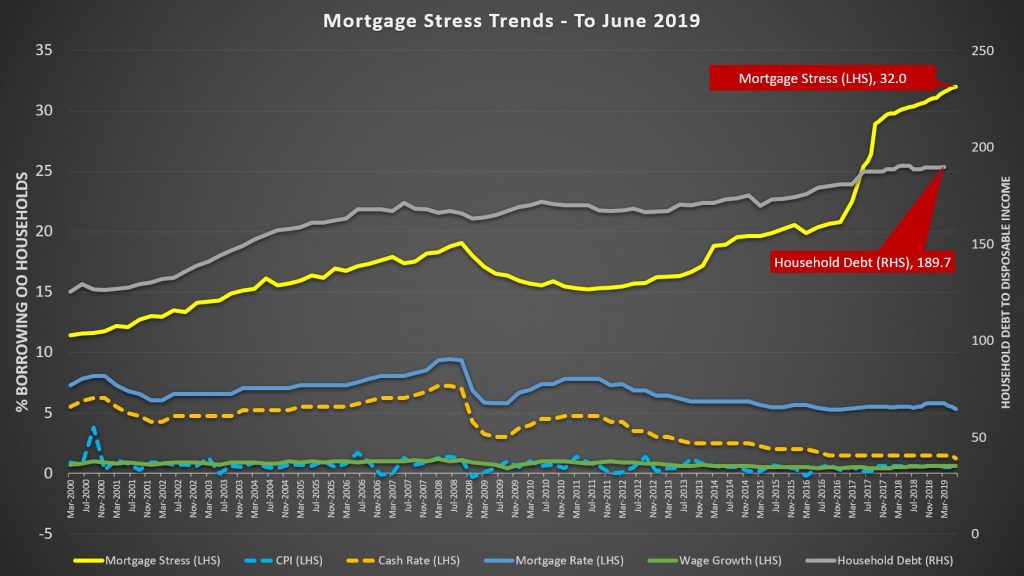
“We’ve still got the very high level of household debt, we’ve still got very high levels of mortgage stress, we’ve still got the banks tight on their lending standards,” the anaylst reminded. 

While North feels confident that the last 18 months of property values sliding is outside the natural ebb and flow of the housing market and indicates the presence of a deeper issue, he doubts the validity of using home prices as the key indicator of the state of the economy.

He explained that there are too many factors that play into the property market for it to be an accurate litmus test, calling it “a follow up, rather than a lead indicator.”

Instead, he suggested attention should be given to monitoring any significant rises in unemployment, mortgage defaults, or the consumer price index.

Discussing Banking, Housing And Interest Rates On The Radio

I discuss the current economic settings and expectations for future rate cuts and home prices on 6PR Perth with Gareth Parker.

Digital Finance Analytics (DFA) Blog
Discussing Banking, Housing And Interest Rates On The Radio
Loading
/