Household Debt Grinds Higher

The ABS published some revisions to their Household Income and Wealth statistics.

Two data series stood out for me. First, more households are in debt today, compared with 2005-6, and second more households have debts at more than three times their income.

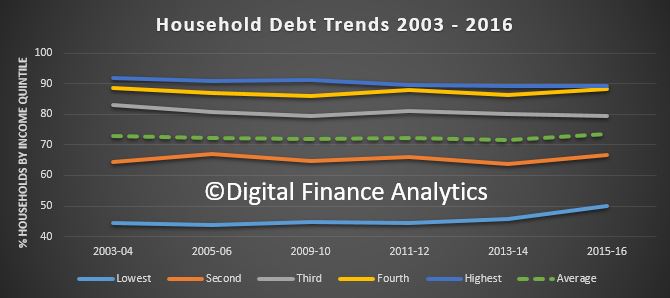
Here is the plot of the proportion of households with debt, by income quintile. In 2003-4, 72.9% of all households had debt, and this rose to 73.6% in 2015-16, up 0.7% across the series.

But, those on lower incomes have borrowed harder, with 50% in the bottom income range borrowing, compared with 44.6% in 2003-4, a rise of 5.4%. The second lowest saw a rise of 2.2%, up from 64.5 to 66.7. On the other hand, the highest quintile saw a fall from 91.8% in 2003-4 to 89.2% in 2015-16, down 2.6%.

The ABS also said that in 2005-6 the proportion of households with debt more than three times income was 23.9%, while in 2015-16 it was 27.2%, up 3.3%.

This underscores the issue we face, debt is higher, and more lower income families are more stretched. Sure, net worth may be higher now, but the debt (mostly mortgage debt) is the problem. As we saw last week, most of the growth in wealth is associated with home prices. Should they reverse, then this looks very wobbly.


National Accounts 2016-17 Highlights Reliance On Property

The ABS released their National Accounts for 2016-17. Overall, we see why the RBA cut rates to let property prices run hot. Without property, the economy would have been shot. But of course, getting back on a more even keel is now much more difficult and much of household wealth is attached to inflated property prices; and rates are likely to rise.

In summary:

  • growth was 2%, the lowest since 2008-9
  • wages rose 2.1%, the weakest since 1991-2
  • household consumption was the strongest growth driver at 1.22pp
  • growth in household expenditure as measured in current price terms was 3.0%, the lowest on record
  • the household saving ratio was at its lowest point (4.6%) in nine years
  • households borrowed an additional $990 billion over the 10 year period from 2006-07, mainly mortgages
  • the value of land and dwellings owned by households increased by $2,930 billion over the same period
  • land and dwellings owned by households increased by $621 billion through 2016-17
  • despite slow wage growth, household gross disposable income plus other changes in real net wealth increased $456.6 billion, or 32.6%, in 2016-17,  largely due to a $306.5 billion appreciation in the value of land held by households.

Here is the ABS summary data:

The Australian economy expanded by 2.0% in chain volume terms in 2016-17. This is the 26th consecutive year of economic growth, but the lowest rate of growth since 2008-09.

Optimal growing conditions saw the agriculture industry make a robust contribution to economic growth, largely on the back of a bumper wheat crop and higher meat sales, which returned the highest annual income to farmers on record. Mining was the beneficiary of elevated commodity prices, but the industry’s growth in volume terms was subdued. Most of the expansion in mining came from oil and gas extraction, reflecting additional capacity coming online. Service-based industries also contributed to growth, highlighting the economy’s transition to service delivery.

Household consumption expanded moderately in volume terms. Gross fixed capital formation fell for the fourth successive year, albeit only marginally, despite continuing strength in dwelling investment in 2016-17. New engineering construction continued to slide as the impact of the recent mining construction boom fades.

Weak wage growth resulted in compensation of employees rising 2.1%, the weakest annual rise since 1991-92. This, combined with a fall in social assistance benefits received by households during the year, caused the household saving ratio to fall to 4.6%, its lowest level since 2007-08.

Price pressures in the domestic economy remained weak throughout 2016-17. Subdued domestic prices and wages drove the weakest annual rise in household consumption, in current price terms, on record. The terms of trade grew for the first time in 5 years, reflecting elevated prices received for key export commodities such as coal and iron ore. These prices boosted mining company profits, real net national disposable income, and overall export revenues, which sharply narrowed the current account deficit.

The Australian economy’s overall financial position improved during 2016-17, borrowing less in net terms from the rest of the world in any year since 2001-02. In current prices Australia’s net worth at 30 June 2017 is estimated at $11,377 billion.

AUSTRALIAN ECONOMY GROWS BY 2.0%

Australian Gross Domestic Product (GDP) grew by 2.0% in the 2016-17 year. This represents a 0.1pp upward revision from the annualised 2016-17 GDP estimates published in the June quarter national accounts. GDP per capita increased 0.4% as the Australian population grew by 1.5%.

GDP and GDP per capita, Volume measures
Graph shows GDP and GDP per capita, Volume measures

CONSUMPTION DRIVES ECONOMIC GROWTH IN 2016-17

Economic growth in 2016-17 was largely driven by consumption. Government consumption contributed 0.8pp to GDP growth, while household consumption contributed 1.2pp to growth. Gross fixed capital formation made no contribution to growth, with the impact of public sector capital expansion being cancelled out by the decline in private works. Net exports contributed 0.1pp.

CONTRIBUTIONS TO GDP(E) GROWTH, Volume measures
Graph shows CONTRIBUTIONS TO GDP(E) GROWTH, Volume measures
Contributions may not add to GDP growth due to the statistical discrepancy.

HOUSEHOLD CONSUMPTION WEAK IN CURRENT PRICE TERMS

While household consumption contributed solidly to GDP growth in volume terms, growth in household expenditure as measured in current price terms of 3.0% is the lowest on record.

HOUSEHOLD FINAL CONSUMPTION EXPENDITURE, Current prices
Graph shows HOUSEHOLD FINAL CONSUMPTION EXPENDITURE, Current prices

MINING INVESTMENT CONTINUES TO FALL

In 2016-17, mining investment fell by 23.7%. This was the fourth consecutive fall in mining investment, with the level of investment now 58.1% lower than it was in 2012-13. The impact the fall in mining investment has had on GDP has been partially offset by investment in dwellings, which grew 5.2% in 2016-17.

Private sector gross fixed capital formation for non-mining industries grew 2.2% in 2016-17. Investment in non-mining is 15.1% higher than in 2012-13, with the strength being led by the information, media and telecommunications industry.

PRIVATE CAPITAL INVESTMENT, Current prices
Graph shows PRIVATE CAPITAL INVESTMENT, Current prices

SERVICES AND AGRICULTURE DRIVE GROWTH IN 2016-17 AS THE COMPOSITION OF AUSTRALIAN GROSS VALUE ADDED (GVA) CONTINUES TO SHIFT

In 2016-17, good growing conditions resulted in a large increase in the output of the Agriculture industry, contributing 0.4 percentage points to the yearly GDP growth in chain volume terms, the largest contribution from Agriculture in ten years. Health Care and Social Assistance, Professional Scientific and Technical Services and Financial and Insurance Services industry all contributed at least 0.3 percentage points to GDP growth this year.

This is consistent with the longer term trend being observed with these three industries along with Mining and Construction making up the largest share of the overall economy in 2016-17. This is in contrast to the 1996-97 year in which Manufacturing, Financial and Insurance Services and Public Administration and Safety were the top three contributors.

INDUSTRY SHARES OF GVA – Selected industries, Current prices

GVA at basic prices of industries as a proportion of total GVA at basic prices

COMPENSATION OF EMPLOYEES SHARE OF TOTAL FACTOR INCOME FALLS

In 2016-17, the compensation of employees (COE) share of total factor income fell to 52.8%. This share is still higher than the lowest level recorded, but continues the long term decline from 57.1% in 1984-85. The series has been more volatile in the past 7-8 years with swings in the terms of trade impacting overall factor income.

The profit share (based on gross operating surplus) of total factor income was 26.5% for the 2016-17 year. This increase is due to the higher profits received by the mining industry this year due to the increase in the terms of trade. The current year share is less than the peak of 28.9% in 2008-09 but still higher than the 22.0% share observed in the mid-1980s. The profit share of total factor income should not be interpreted as a direct measure of ‘profitability’ for which it is necessary to relate profits to the level of capital assets employed.

WAGES SHARE OF TOTAL FACTOR INCOME
Graph shows WAGES SHARE OF TOTAL FACTOR INCOME


PROFITS SHARE OF TOTAL FACTOR INCOME
Graph shows PROFITS SHARE OF TOTAL FACTOR INCOME

CHANGES TO INDUSTRY COMPENSATION OF EMPLOYEES OVER TIME

The industry share of COE has changed significantly over time. The Health Care and Social Assistance and Professional, Scientific and Technical Services industries had the largest proportion of total COE in 2016-17. The Manufacturing industry made up the highest share of COE in 1996-97 but this share has now fallen to 7.3%.

INDUSTRY SHARES OF COE – Selected industries, Current prices
Graph shows INDUSTRY SHARES OF COE - Selected industries, Current prices

HOUSEHOLD SAVING RATIO DECLINES

The household saving ratio was at its lowest point (4.6%) in nine years in 2016-17. This fall in net saving as a proportion of net disposable income can be attributed to slower growth in COE as well as a reduction in social assistance benefits received. The result this year is not isolated, and continues the downward trend seen in the past five years.

HOUSEHOLD SAVING RATIO
Graph shows HOUSEHOLD SAVING RATIO

GDP CHAIN PRICE INDEX GROWTH DRIVEN BY STRONG EXPORT PRICES

The GDP chain price index grew by 3.8% in 2016-17. Strength in export prices (specifically coal and metal ore) drove this result. The domestic final demand chain price index rose 0.8% in 2016-17, which is the lowest reading of domestic price pressure since 1996-97.

CHAIN PRICE INDEXES
Graph shows CHAIN PRICE INDEXES

MARKET SECTOR MULTIFACTOR PRODUCTIVITY INCREASES

Market sector multifactor productivity (MFP) grew 0.6% in 2016-17. This result reflects a 1.9% increase in GVA and a 1.3% increase in labour and capital inputs. On a quality adjusted hours worked basis, MFP rose 0.3%, reflecting changes in labour composition. These changes were due to educational attainment and work experience.

On an hours worked basis, labour productivity grew 1.0%. On a quality adjusted hours worked basis, labour productivity grew 0.5%.

MARKET SECTOR PRODUCTIVITY, Hours worked basis
Graph shows MARKET SECTOR PRODUCTIVITY, Hours worked basis

LOW INTEREST RATES ENTICE HOUSEHOLDS TO INVEST IN DWELLINGS AND LAND

Interest rates have been at historically low levels for a number of years, which has reduced the pressure on households in terms of the proportion of income spent paying interest on mortgages. Interest on dwellings accounted for 3.7% of total gross household income in 2016-17, compared to 5.3% in 2006-07.

Households borrowed an additional $990 billion over the 10 year period from 2006-07, while the value of land and dwellings owned by households increased by $2,930 billion over the same period. Land and dwellings owned by households increased by $621 billion through 2016-17, boosted by the recent additions in dwelling stock.

In 1988-89, the value of dwellings and land held by households was 5.1 times the value of household borrowing. By 2006-07 this ratio was at 3.3, and it has been reasonably stable since. In 2016-17, land and dwellings owned by households covered their borrowing 3.1 times.

HOUSEHOLD INTEREST PAYABLE ON DWELLINGS – Relative to total gross household income, Current prices
Graph shows HOUSEHOLD INTEREST PAYABLE ON DWELLINGS - Relative to total gross household income, Current prices


HOUSEHOLD LAND AND DWELLING ASSETS – Relative to loans, Current prices
Graph shows HOUSEHOLD LAND AND DWELLING ASSETS - Relative to loans, Current prices

HOUSEHOLD INCOME AND WEALTH

Despite slow wage growth, household gross disposable income plus other changes in real net wealth increased $456.6 billion, or 32.6%, in 2016-17. This was largely due to a $306.5 billion appreciation in the value of land held by households.

Living standards and economic wellbeing are supported by wealth as well as income. Gross disposable income grows at a fairly constant rate over time, but its rate of growth has slowed in recent years. However, households reap gains and incur losses from holding assets, such as land, dwellings, equities and accumulated saving, which also bears on consumption patterns.

HOUSEHOLD INCOME AND WEALTH, Current prices
Graph shows HOUSEHOLD INCOME AND WEALTH, Current prices
 

The Treasury View Of Household Debt

John Fraser, Secretary to the Treasury, gave an update on household finances and housing as part of his opening statement to the October 2017 Senate Estimates.  More evidence of the Council of Financial Regulators group-think?  The view that debt is born by those with the greater capacity to repay belies the leverage effect of larger loans in a rising interest rate environment.

Housing market and dwelling investment

The housing market is another sector which we will be monitoring closely.

In recent times, Australia has experienced one of the largest booms in housing construction since Federation, supported by record low interest rates and strong population growth.

Since June 2014, dwelling investment has constituted around 11 per cent of our economic growth.

Much of this has been driven by an unprecedented increase in the construction of high-rise apartment blocks in our east-coast cities.  As a proportion of GDP, medium and high density housing construction is now 1.7 per cent, more than double its long-run average.

Housing market activity also continues to be characterised by some quite stark regional differences. Over the past three years, dwelling price growth in our capital cities has been around double that of regional areas. Also, as the east-coast states have experienced strong growth in investment and prices, the market in Western Australia has been much weaker.

However, as noted at Budget, forward indicators of housing construction, notably for apartments appear to have peaked.

The most recent national accounts show that dwelling investment grew by 1.6 per cent in 2016-17, which is less than we expected at Budget.

We expect that residential construction activity will decline moderately over the next few years, although an elevated pipeline of building work will underpin the sector.  Strong population growth in our east-coast cities will also support housing demand going forward.

Victoria continues to have the fastest growing population of all the States and Territories, growing at around 2.4 per cent through the year to the March quarter 2017.  New South Wales and Queensland each had population growth of about 1.6 per cent through the year to the March quarter 2017.

Over the past few months, dwelling price growth has moderated in our east-coast cities. After years of strong price growth, this is desirable.

Household debt

The state of household finances is an issue that is getting close attention in Australia and that is understandable – but it should be placed in context.

Several considerations should provide some comfort to those concerned about household debt levels.

While household debt has risen over recent years, interest rates have also fallen.

The net result is that the share of household disposable income going to interest payments is currently around its long-term average.

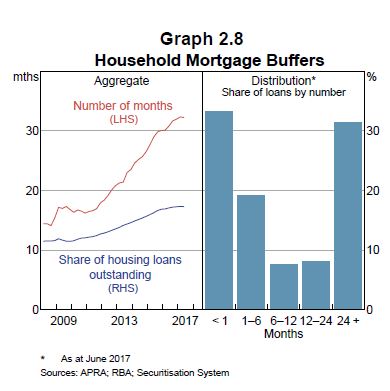
Many households have taken advantage of low interest rates to build substantial mortgages buffers, currently equivalent to over 2 ½ years of scheduled repayments at current interest rates.

And the distribution of that debt is concentrated in high income households, with around 60 per cent of debt held by households in Australia’s top two income quintiles – households that are best positioned to service that debt.

More broadly, any assessment of the sustainability of Australia’s household debt position requires consideration of the assets that those households hold against their debt. We shouldn’t just think about one side of the household balance sheet.

The Australian household sector’s asset holdings are considerable, at around five times greater than its debts – Australian households may have over $2 trillion in debt, but they also hold over $12 trillion in assets.

That said, asset values can always fall (and often do) while debt values generally don’t, squeezing net worth in the process.

And perhaps more importantly, around 75 per cent of household assets are in housing and superannuation.

The fact that households need homes to live in, that it takes time to sell properties, and that superannuation is ‘locked away’ until retirement means that these assets cannot easily provide liquidity to households during periods of financial stress.

It’s also the case that higher debt levels have made households more sensitive to any increase in interest rates in the future.

The Reserve Bank will be mindful of this when thinking about domestic monetary policy, though global monetary conditions can also impact upon the wholesale funding costs of Australian banks.

For these reasons, Australian financial regulators are alive to the risks presented by household sector debt, and will continue to closely monitor and enforce sound lending practices by Australian financial institutions

Macroprudential policies

House price growth has moderated recently and there are welcome signs of moderation in investor and interest-only residential lending activity.

However, it is too soon to make a final assessment of the impact of APRA’s March 2017 macroprudential measures on lending.

These measures included maintaining the growth limit on investor loans first introduced in December 2014 at 10 per cent and limiting the flow of new interest-only lending to 30 per cent of total new lending.

Treasury and regulators will continue to be vigilant in assessing developments in the financial system and the adequacy of policy settings for maintaining financial stability.

While banks’ progress against these measures has been positive, regulators will need to think carefully about whether future efforts to maintain financial stability should lean against cyclical excesses or address structural risks within the financial system.

How Much Can Mortgage Holders Really Save By Refinancing?

We showed recently that households with specific post codes may have significantly higher mortgage rates than their neighbours. As a result, significant savings may be made by seeking out a mortgage with a better rate.

Of course households need to be careful, as they may incur transaction costs, and even break costs if the loan is fixed.

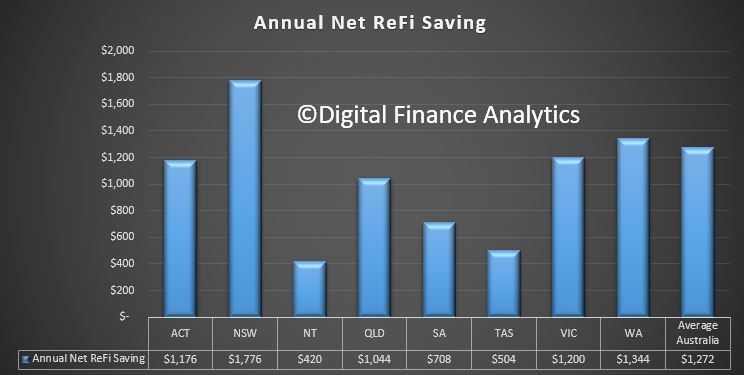
But we went though our Core Market Model looking at those who refinanced in the past year. We then calculated the annual savings they had, on average achieved. Here are the results:

The larger the loan, the bigger the potential saving, which is why there are state variations. There were quite big differences between the old rate and new rates, and we incorporated break costs where appropriate.

This again highlights that households should be checking their rates and seeking out better, lower rates. Substantial savings are available, and when we consider the average loan life is more than 5 years, the potential savings are significant.


ACCC Electricity report details affordability, competition issues

We know from our surveys that many households are under intense pressure thanks to rising costings of living and flat wages. Higher electricity prices are one of the main causes.

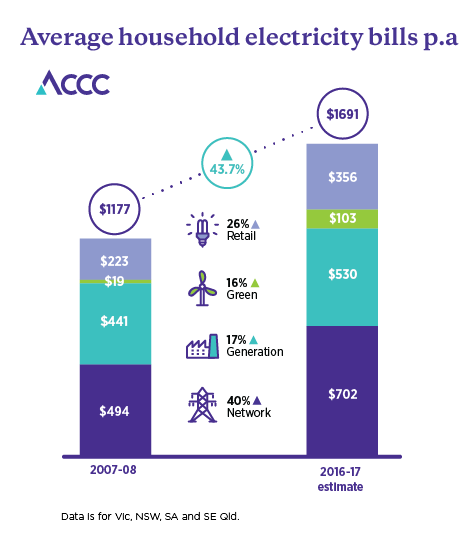
Now the ACCC has published a preliminary report into the electricity market highlighting significant concerns about the operation of the National Electricity Market, which is leading to serious problems with affordability for consumers and businesses. They say residential prices have increased by 63 per cent on top of inflation since 2007-08. The main reason customers’ electricity bills have gone up is due to higher network costs. Higher wholesale costs during 2016-17 contributed to a smaller $167 increase in bills.

Consumers and businesses are faced with a multitude of complex offers that cannot be compared easily. Many of these issues arise from unnecessarily complex and confusing behaviour by electricity retailers.

This suggests the current Government focus on supply related issues is myopic, and this alone cannot solve the issues in the system, many of which are simply stemming from poor company behaviour.  And, by the way, this mirrors the issues in the UK, where similar behaviour also exists!

The Retail Electricity Pricing Inquiry preliminary report details the ACCC’s initial assessment of information it has gathered including documents and data from industry, consumers, businesses, representative groups and other government and non-government organisations.

The inquiry received over 150 submissions since it began in April. The ACCC heard directly from consumers, businesses and other stakeholders at public forums in Adelaide, Brisbane, Melbourne, Sydney, and Townsville.

“It’s no great secret that Australia has an electricity affordability problem. What’s clear from our report is that price increases over the past ten years are putting Australian businesses and consumers under unacceptable pressure,” ACCC Chairman Rod Sims said.

“Consumers have been faced with increasing pressures to their household budgets as electricity prices have skyrocketed in recent years. Residential prices have increased by 63 per cent on top of inflation since 2007-08.”

The main cause of higher customer bills was the significant increase in network costs for all states other than South Australia. In South Australia, generation costs represented the highest increase. There was a much larger increase in the effect of retail costs in Victoria than in other states. Retail margins increased significantly in NSW, but decreased in others.

“The main reason customers’ electricity bills have gone up is due to higher network costs, a fact which is not widely recognised. To a lesser extent, increasing green costs and retailer costs also contributed,” Mr Sims said.

“We estimate that higher wholesale costs during 2016-17 contributed to a $167 increase in bills. The wholesale (generation) market is highly concentrated and this is likely to be contributing to higher wholesale electricity prices,” Mr Sims said.

The ACCC estimates that in 2016-17, Queenslanders will be paying the most for their electricity, followed by South Australians and people living in NSW. Victorians will have the lowest electricity bills. This is due to a range of factors including usage patterns in various states, including the prevalence of gas usage in Victoria in particular.

The closure of large baseload coal generation plants has seen gas-powered generation becoming the marginal source of generation more frequently, particularly in South Australia. Higher gas prices have contributed to increasing electricity prices.

The ‘big three’ vertically integrated gentailers, AGL, Origin, and EnergyAustralia, continue to hold large retail market shares in most regions, and control in excess of 60 per cent of generation capacity in NSW, South Australia, and Victoria making it difficult for smaller retailers to compete.

The ACCC has heard many examples of the difficulties that consumers and small businesses face in engaging with the retail electricity market and the particular difficulties faced by vulnerable consumers.

“Consumers and businesses are faced with a multitude of complex offers that cannot be compared easily. There is little awareness of the tools available to help consumers make informed choices or seek assistance if they are struggling to pay their electricity bills,” Mr Sims said.

“Many of these issues arise from unnecessarily complex and confusing behaviour by electricity retailers, and in some cases this appears to be designed to circumvent existing regulation.”

“There is much ill-informed commentary about the drivers of Australia’s electricity affordability problem. The ACCC believes you cannot address the problem unless you have a clear idea about what caused it.”

“Armed with the clear findings on the causes of the problem, the ACCC will now focus on making recommendations that will improve electricity affordability across the National Electricity Market,” Mr Sims said.

Increased generation capacity (particularly from non-vertically integrated generators), preventing further consolidation of existing generation assets, and improving the availability and affordability of gas for gas fired generation, could all help to take the pressure off retail electricity bills.

The ACCC will also seek to identify ways to mitigate the effect of past decisions around network investments on retail electricity prices, noting that many past decisions  are ‘locked-in’ and will burden electricity users for many years to come.

The ACCC will consider steps that can be taken to reduce complexity and improve consumers’ ability to engage with the retail electricity market and switch suppliers.

“We will provide recommendations for reform in our final report, which will be provided to the Treasurer in June 2018,” Mr Sims said.

In part based on our findings, the Federal Government has already taken some steps towards improving electricity affordability, including obtaining commitments from some retailers to move consumers off high standing offers or expired benefit offers, and the proposed removal of limited merits review of AER decisions.

In addition, the ACCC’s preliminary report contains some recommendations that could be immediately implemented by governments:

  • Provide additional resourcing to the AER’s Energy Made Easy price comparison website as a tool to assist consumers in comparing energy offers
  • State and territory governments should review concessions policy to ensure that consumers are aware of their entitlements and that concessions are well targeted and structured to benefit those most in need.
  • Improvements to the AER’s ability to effectively investigate possible breaches of existing regulation, for example the power to require individuals to appear before it and give evidence. Consideration should also be given to the adequacy of existing infringement notices and civil pecuniary penalties to deter market participants from breaching existing regulations.


Background

The ACCC’s preliminary findings are that, on average across the NEM, a 2015-16 residential bill was $1,524 (excluding GST). This average residential bill was made up of:

  • network costs (48 per cent)
  • wholesale costs (22 per cent)
  • environmental costs (7 per cent)
  • retail and other costs (16 per cent)
  • retail margins (8 per cent).

In real terms, average residential bills increased by around 30 per cent (on a dollars per customer basis) between 2007-08 and 2015-16. Average residential prices (as measured by cents per kWh measure) have increased by 47 per cent in real terms during the same period.

After considering wholesale price increases in 2016-17, the ACCC estimates that average bills in dollars per customer increased in real terms by 44 per cent since 2007-08, while prices in cents per kWh have increased in real terms by 63 per cent.

See report: Retail Electricity Pricing Inquiry preliminary report

For more information: Electricity supply prices inquiry

RBA Financial Stability – Move Along, Nothing To See Here….

The latest 62 page edition of the RBA Financial Stability Review has been released, and it continues their line “of some risks, but no worries”. International economic conditions, and business confidence are, they say, on the improve while Australian household balance sheets and the housing market remain a core area of interest. The potential impact of rising rates and flat income are discussed, once again, but little new is added into the mix.

From a financial stability perspective, banks hold more capital, have tightened lending standards, and shadow banking is under control.

The key domestic risks in the Australian financial system continue to stem from household borrowing. Household indebtedness, most of which is mortgage borrowing, is high and gradually rising against a backdrop of low interest rates and weak income growth. While some households have taken advantage of low interest rates to make excess mortgage payments, others have increased their borrowing. Higher interest rates, or falls in income, could see some highly indebted households struggle to service their debt and so curtail their spending.

Prepayments are an important dynamic in the Australian mortgage market as they allow households to build a financial buffer to cushion mortgage rate rises or income falls. Aggregate mortgage buffers – balances in offset accounts and redraw facilities – remain around 17 per cent of outstanding loan balances, or over 2½ years of scheduled repayments at current interest rates.

These aggregates, however, mask substantial variation; about one-third of mortgages have less than one months’ buffer Not all of these are vulnerable given some borrowers have fixed rate mortgages that restrict prepayments, and some are investor mortgages where there are incentives to not pay down tax deductible debt. This leaves a smaller share of potentially vulnerable borrowers with new mortgages who have yet to accumulate prepayments, and borrowers who may not be able to afford prepayments. Partial data suggest that the share of households with only small buffers has declined in recent years, in part due to declines in mortgage rates. Households with small buffers also tend to be lower-income or lower-wealth households, which could make them more vulnerable to financial stress.

Household indebtedness is high and, against a backdrop of low interest rates and weak income growth, debt levels relative to income have continued to edge higher. Steps taken by regulators in the past few years to strengthen the resilience of balance sheets, including limiting the pace of growth of investor lending, discouraging loans with high loan-to-valuation ratios (LVRs) and strengthening serviceability metrics, have seen the growth in riskier types of lending moderate. The most recent focus has been on limiting interest-only lending, and banks have responded by further reducing lending with high LVRs for interest-only loans, increasing interest rates for some types of mortgages and significantly reducing interest-only lending.

The tightening of banks’ lending standards for property loans is constraining some households and developers but, in doing so, making the balance sheets of both borrowers and lenders more resilient. Conditions are relatively weak in the Brisbane apartment market, with a large increase in supply reflected in declines in prices and rents. There are, however, few signs of significant settlement difficulties to date. More generally, while housing market conditions vary across the country, there are signs of easing of late, particularly in Sydney and Melbourne where conditions have been strongest.

With the tightening of lending standards, there is a potential that riskier lending migrates into the non-bank sector. To date, non-bank financial institutions’ residential mortgage lending has remained small though their lending for property development has picked up recently. While the banking system has minimal exposure to the non-bank financial sector, growth in finance outside the regulated sector is an area to watch.

Here are some of the other nuggets:

Very low interest rates have also contributed to strong growth in property prices internationally as investors search for yield. To the extent that prices have moved beyond what their underlying determinants suggest, this increases the risk of sharp price falls if interest rates were to rise suddenly or if risk sentiment were to deteriorate.

While household debt levels are high, and rising, to date the impact on households’ ability to service their debt has been muted by falls in interest rates to historically low levels. Nonetheless, highly indebted households are more likely to struggle to repay their debts, or substantially reduce their consumption, in response to a negative shock, such as a rise in unemployment, an unexpectedly large increase in interest rates or a sharp fall in housing prices.

The distribution of debt is also important in identifying where risks lie as typically it is not the ‘average’ household that gets into financial In Canada and Sweden, for example, the risks from high household debt may be heightened since the debt is concentrated among younger and low‑to-middle-income households, who are likely to be more vulnerable
to negative shocks.

Further, interest-only (IO) lending has been identified as increasing risks in some jurisdictions.4 Households with IO loans remain more indebted throughout the life of the loan than if they had been paying down the loan principal, making them more vulnerable to higher interest rates, reduced income, or lower housing prices. Such households are also more vulnerable to ‘payment shock’ due to the increase in repayments following the end of the interest-only period of the loan.

Global experience is that the culture within banks can have a major bearing on how a wide range of risks are identified and managed. There have been a number of examples where the absence of strong positive culture has given rise to a deterioration in asset performance, misconduct and loss of public trust. In Australia, there have also been examples of weak internal controls causing difficulties for some banks. These include in the areas of life insurance, wealth management and, more recently, retail banking. In August, AUSTRAC (the Australian Transaction Reports and Analysis Centre) initiated civil proceedings against the Commonwealth Bank of Australia for breaches of the Anti-Money Laundering and Counter-Terrorism Financing Act 2006. In the current environment where investors still expect high rates of return, despite regulatory and other changes that have reduced bank ROE, banks need to be careful of taking on more risk to boost returns.

A central element to address this issue is to ensure that banks build strong risk cultures and governance frameworks. Regulators have therefore heightened their focus on culture and the industry is taking steps to improve in this area.

Households Spending Less On Housing…But

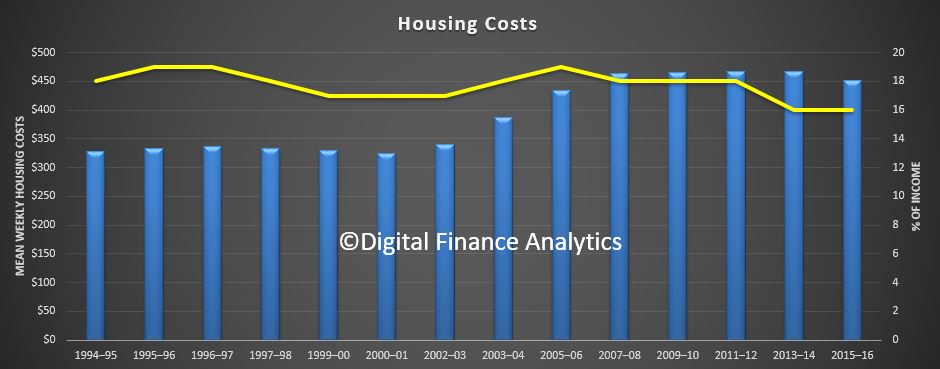
Data from the ABS today – Housing Occupancy and Costs – highlights the average household with an owner occupied mortgage is paying around $450 a week, slightly lower than the peak a couple of years ago.  This equates to around 16% of gross household income, on average.

This does not include repayments on investment properties of course (and many households have multiple properties as investing in property rises).

But of course, the true story is interest rates have fallen to all time lows, allowing people to borrow more, as prices rise. As a result, should interest rates start to bite, this will cause real pain. Then of course we have recent flat wage growth, in real terms, in the past couple of years.

Also, households have a bigger mortgage for longer, which is great for the banks, but not helpful from a household perspective, as it erodes savings into retirement and more older Australians are still borrowing. And of course the current high home prices show a paper profit, but that could be eroded if prices slide.

Thus, the ABS data should not be interpreted as everything is fine, it is not! In fact, underwriting standards should be much tighter now, as we highlighted this morning, Australian Banks are willing to go up to around 6 times income, higher than many other countries, with similar home price bubbles.

The proportion of income mortgagees are using for housing has declined over the last decade, according to new figures released today by the Australian Bureau of Statistics (ABS).

“In 2005-06, owners with a mortgage paid 19 per cent of their total household income on housing costs. By 2015-16 this had fallen to 16 per cent. This is likely driven by lower interest rates coupled with growth in household incomes over the last decade, ” Dean Adams, Director of Household Characteristics and Social Reporting, said.

In 2005-06, owners with a mortgage paid $434 per week in housing costs, similar to the $452 paid in 2015-16 in real terms. But over the same period, average total household incomes for mortgagees rose from $2,272 to $2,759 per week.

“Mortgage and property values have also increased in the last decade. Ten years ago, the real median mortgage value was $171,000 which rose to $230,000 in 2015-16. Meanwhile, the real median dwelling value increased from $449,000 to $520,000,” Mr Adams explained.

Going back another decade, the results also reveal that households are entering into a mortgage at older ages. The proportion of younger households (with a reference person aged under 35 years) represented 69 per cent of first home buyers in 1995-96 which dropped to 63 per cent by 2015-16.

“Having a mortgage is now the most common form of ownership for households whose reference person was aged between 35 and 54 years. Among this group, ownership with a mortgage increased by 15 percentage points over the last two decades, from 41 per cent to 56 per cent. Meanwhile, the rate of outright ownership in 2015-16 (12 per cent) was one-third the 1995-96 rate (36 per cent),” Mr Adams said.

The rate of older households (with a reference person aged 55 years and over) who were still paying off a mortgage has tripled between 1995-96 and 2015-16 (from 7 per cent to 21 per cent). Older households are spending more of their income on housing costs than two decades ago, increasing from 8 per cent to 14 per cent for those aged between 55 and 64, and from 5 per cent to 9 per cent for those aged 65 and over.

It’s ‘crunch time’ for Australian households

From Business Insider.

Australian households are in a vulnerable financial position, especially those who have taken out a mortgage. And in an era of weak incomes growth, soaring energy prices and high levels of indebtedness, with the prospect of higher interest rates on the way, many intend to cut discretionary spending in anticipation of even tighter household budgets.

That’s the finding of the latest AlphaWise survey conducted by Morgan Stanley, which paints an unsettling picture on the outlook for not only Australia’s retail sector, but also the broader economy.

Yes, the weakness in retail sales over the past two months may soon become entrenched. The “crunch time” for Australian households, as Morgan Stanley puts it, has begun.

“In early June, we expressed the view that the Australian consumer faces a domestic cash flow and credit crunch,” the bank wrote in a note released this week.

“Income growth has not recovered, ‘cost of living’ inflation is re-accelerating and ‘macro-prudential’-related tightening of credit conditions is extending from housing into consumer finance.”

In order to test how households may respond to higher interest rates, whether as a result of macroprudential measures to slow investor and interest-only housing credit growth or official moves from the Reserve Bank of Australia (RBA), Morgan Stanley conducted a national survey of 1,836 mortgagors to identify household conditions during late July and early August.

Australia’s 2016 census found that 34.5% of households were currently paying off a mortgage.

Morgan Stanley says the survey was designed to provide insight into the health of the household balance sheet, including their spending intentions as a result of higher mortgage rates.

The news was not good.

“Findings from the AlphaWise survey confirm the stresses in the consumer sector we have been highlighting for some time now,” it says.

“Most households have minimal buffers against a shock to their income, and expect to respond to higher debt servicing costs by drawing down on savings and cutting back on expenditure.

“Other sectors of the economy may be able to offset some of the headline weakness, but the concentrated exposure of the household sector and economy to an extended housing market is posing an increasingly important structural and cyclical risk to consumer spending.”

Of those households surveyed, 54% said they intended to cut back on expenditure in response to higher interest rates, with a further 25% planning to draw down on their savings to cope with higher servicing costs, a pattern that has been seen in Australia’s savings ratio which fell to a post-GFC low in the June quarter.

Somewhat alarmingly, 40% of those surveyed indicated that they did not save at all over the past year, particularly among low-income households.

Source: Morgan Stanley

“Respondents to the survey had extremely small income buffers, with around 40% stating that they did not save over the past year,” Morgan Stanley says.

“This was the case across the income distribution, including 30% of those earning more than $100,000.

“The RBA has referred to such households as living ‘hand-to-mouth’, and they largely attributed the lack of savings to an absence of income growth and a general increase in expenses, with a skew towards necessary rather than discretionary items.”

The bank says that the survey’s findings marry up with its consumer “crunch time” thesis where discretionary spending gets squeezed due to flat wage growth, rising essentials costs and tightening credit conditions.

And, perhaps explaining why consumer sentiment remains at depressed levels, Morgan Stanley says the majority of households expect this trend to continue.

“Only around 13% of respondents expect to be able to save more in the next 12 months,” it says.

“With households increasingly eating into their savings to fund expenditure, any shock to disposable income via further rate rises or lower income would have a disproportionate hit to consumption.”

For those unable or unwilling to draw down further on their savings, the survey found that many planned to cut back discretionary spending levels, especially when it came to holidays and social occasions such as entertainment or eating out.

“The survey suggests Holidays/Vacations and Entertainment/Dining are the categories consumers are most likely to cut back on as interest rates rise,” the bank says.

Providing clout to that view, it also mirrors weakness in the Ai Group’s Performance of Services Index (PSI) for September which revealed that activity levels across Australia’s hospitality sector — measuring accommodation, cafes and restaurants — declined at the fastest pace on record in September.

“Respondents in retail and hospitality are reporting reduced spending by consumers due to a mix of increased household electricity costs, flat income growth, and relatively poor consumer confidence,” the Ai Group said following the release of the PSI report.

Separate data from the Australian Bureau of Statistics (ABS) also found that spending at cafes, restaurants and takeaway food services fell by 1.3% in August, more than twice as fast as the decline in total retail sales over the same period.

Once is an anomaly, twice is a trend.

Throw in a third indicator, suggesting that households intend to cut back spending in these areas, and it’s understandable why many think this could be the start of a prolonged period of consumer weakness.

Morgan Stanley certainly thinks it is, forecasting that household consumption growth — the largest part of the Australian economy at a smidgen under 60% — will decelerate sharply over the next 18 months.

Source: Morgan Stanley

“We forecast the squeeze on overall disposable income will see discretionary consumption volumes slow to just 0.2% in 2018, dragging overall consumption growth down to 1.1% and well below consensus of 2.5%,” it says.

That growth in overall consumption next year would be only half the level Morgan Stanley is currently forecasting for 2017.

Given that pessimistic outlook, it says that official interest rates will remain unchanged at 1.5% throughout next year, making it somewhat of an outlier compared to current consensus.

“Combined with a broader slowdown in the housing cycle, we see the RBA staying on hold at 1.5% right through 2018, in contrast to the market pricing of a tightening cycle commencing [in the second quarter of next year]”.

And, given the risks, it says that government investment may need to ramp up even further in order to reduce recession risks.

“[Against] this backdrop, we see the gathering momentum behind a public investment program as necessary to mitigate recession risks, rather than sufficient to drive overall growth back to, or above, trend.”

The RBA’s latest forecasts have GDP growing at 3.25% by the end of next year before accelerating to 3.5% by the end of 2019. Both figures are well above the 2.75% level that many deem to be Australia’s trend growth level.

If Morgan Stanley is right about the largest and most important part of the Australian economy, those forecasts will be hard to achieve.

In such a scenario, it’s unlikely that wage or inflationary pressures would build to a sufficient level to justify a rate increase from the RBA. Indeed, it would likely spur on renewed talks of rate cuts, particularly should business and government investment start to weaken.

While there are plenty of good signals being generated by the Australian economy for the RBA to be optimistic about, especially when it comes to the labour market, should the household sector weaken further — and there’s more than a few signs that it is — it’s unlikely that the RBA would respond by making it even tougher for household budgets.

Morgan Stanley says the AlphaWise survey has a margin of error of +/-1.92% at a 90% confidence level.

Rising Household Debt: What It Means for Growth and Stability

From The IMFBlog.

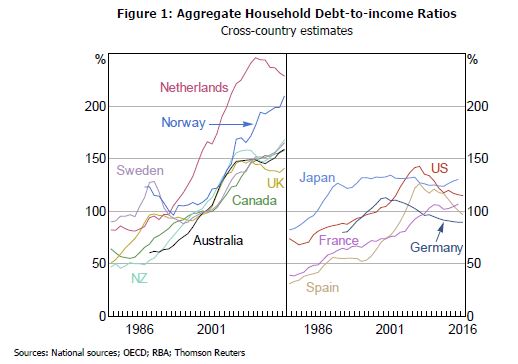
Whilst increased household debt gives an economy a boost in the short term, the IMF has found it creates greater risk 3-5 years later, lifting the potential for a financial crisis, as household struggle to repay.  Given the ultra-high debt levels in Australia, this is an important observation.

Debt greases the wheels of the economy. It allows individuals to make big investments today–like buying a house or going to college – by pledging some of their future earnings.

That’s all fine in theory. But as the global financial crisis showed, rapid growth in household debt – especially mortgages – can be dangerous.

A new IMF study takes a close look at the likely consequences of growth in household debt for different types of economies, as well as steps that policy makers can take to mitigate these consequences and to keep debt within reasonable limits. The overall message: there is a tradeoff between the short-term benefits and the medium-term costs of rising debt, but there is plenty that policymakers can do to ease this tradeoff, according to Chapter Two of the IMF’s October 2017 Global Financial Stability Report.

Given the widespread misery the crisis caused, you might think people have become skittish about borrowing more. Surprisingly, that’s not the case. Since 2008, household debt as a proportion of gross domestic product has grown significantly in a sample of 80 countries. Among advanced economies, the median debt ratio rose to 63 percent last year from 52 percent in 2008. Among emerging economies, it increased to 21 percent from 15 percent.

Reversal of fortune

In the short term, an increase in the ratio of household debt is likely to boost economic growth and employment, our study finds. But in three to five years, those effects are reversed; growth is slower than it would have been otherwise, and the odds of a financial crisis increase. These effects are stronger at the higher levels of debt typical of advanced economies, and weaker at lower levels prevailing in emerging markets.

What’s the reason for the tradeoff? At first, households take on more debt to buy things like new homes and cars. That gives the economy a short-term boost as automakers and home builders hire more workers. But later, highly indebted households may need to cut back on spending to repay their loans. That’s a drag on growth. And as the 2008 crisis demonstrated, a sudden economic shock – such as a decline in home prices–can trigger a spiral of credit defaults that shakes the foundations of the financial system.

More specifically, our study found that a 5 percentage-point increase in the ratio of household debt to GDP over a three-year period forecasts a 1.25 percentage-point decline in inflation-adjusted growth three years in the future. Higher debt is associated with significantly higher unemployment up to four years ahead. And a 1 percentage point increase in debt raises the odds of a future banking crisis by about 1 percentage point. That’s a significant increase, when you consider that the probability of a crisis is 3.5 percent, even without any increase in debt.

The good news is that policy makers have ways to reduce risks. Countries with less external debt and floating exchange rates, and which are financially more developed, are better placed to weather the consequences.

Mitigating risks

Better financial-sector regulations and lower income inequality also help. But this is not the end of the story. Countries can also mitigate the risks by taking measures that moderate the growth of household debt, such as modifying the down payment required to purchase a house or the fraction of a household income that can be devoted to debt repayments. So, good policies, institutions, and regulations make a difference – even in countries with high ratios of household debt to GDP. And countries with poor policies are more vulnerable – even if their initial levels of household debt are low.

Household Debt Burden Rises Once Again – RBA

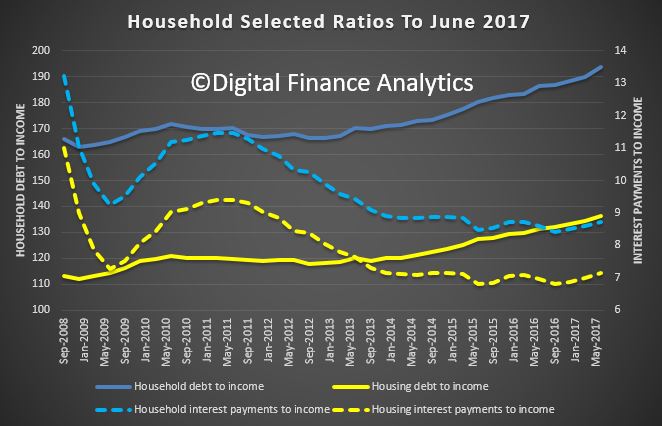
The RBA has updated its E2 Household Finances Selected Ratios to June 2017. As a result, we see another rise in the ratio of household debt to income, and housing debt to income. Both are at new record levels.

In addition, we see the proportion of income required to service these debts rising, as out of cycle rates rises hit home. These ratios are below their peaks in 2011, when the cash rate was higher, but it highlights the risks in the system should rates rise.

We discuss this further in our September Mortgage Stress Data, to be released shortly.  The debt chickens will come home to roost!

But the policy settings are wrong, debt cannot continue to grow at more than three times cpi or wage growth.