Mortgage Rate Warnings Get More Strident

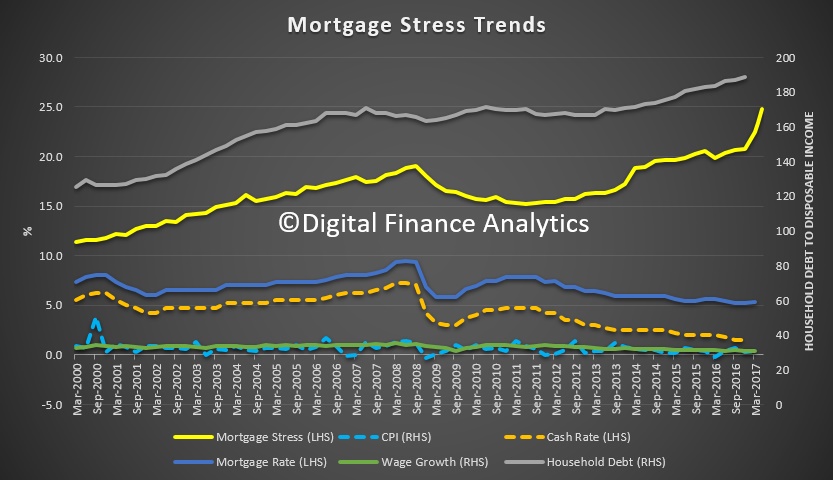
More people are now saying that households need to brace for mortgage rate rises. Among the crowd is Malcolm Turnbull who warned households to prepare for interest rates to climb.

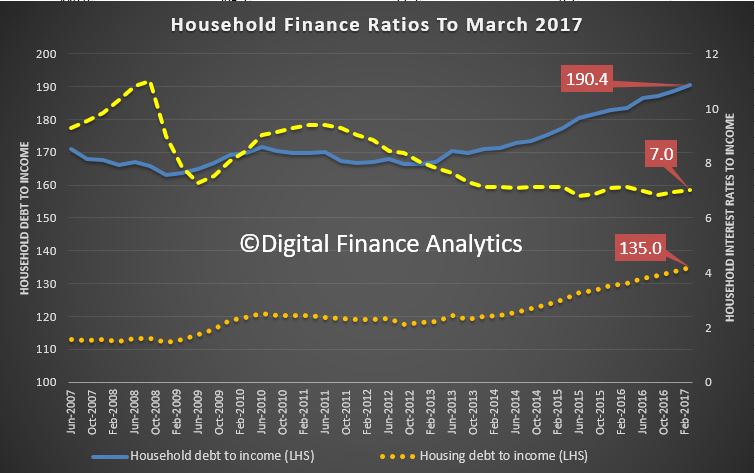
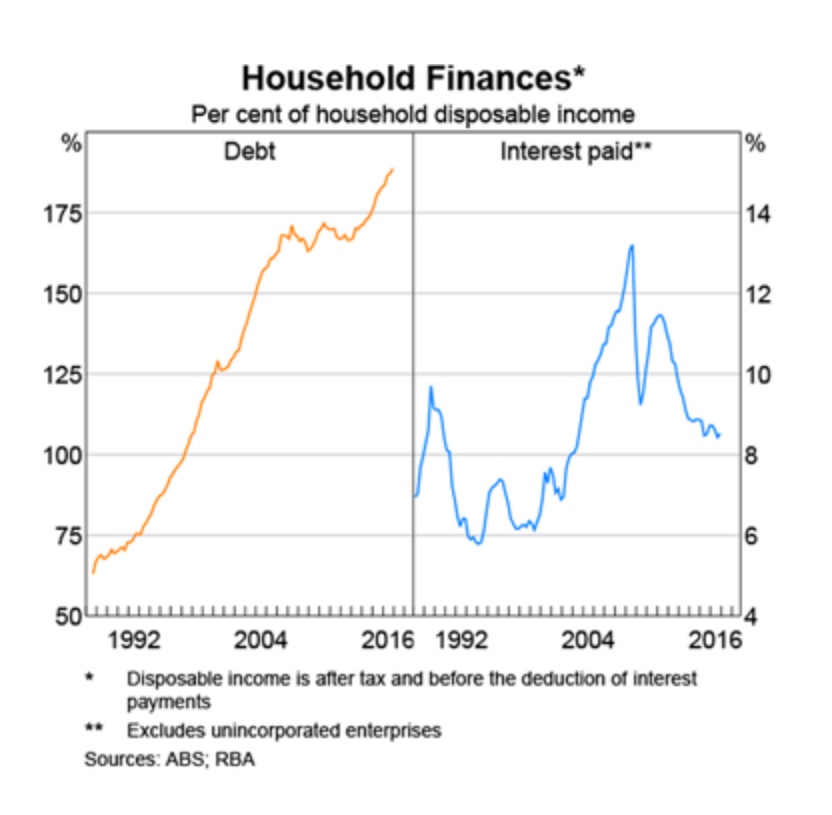
It is all a bit late given the level of debt which we have across Australia. As we discussed before, the debt quagmire will really hurt.

It is not that employment is too bad, but incomes are static, costs are rising, and underemployment is the spectre at the feast.

But lets be clear, it is not a financial stability problem, yet. It is highly unlikely the banks will see their mortgage defaults rise that much, because currently many households are still protected by lofty capital gains sufficient to repay the lender. They also have tremendous pricing power, as has been demonstrated in the past few months, with a litany of out of cycle rate hikes. Expect more to come. Their capital base is strong, and rising (and APRA has been light on them).  As a result, banks profits will rise – this explains recent stock market moves.

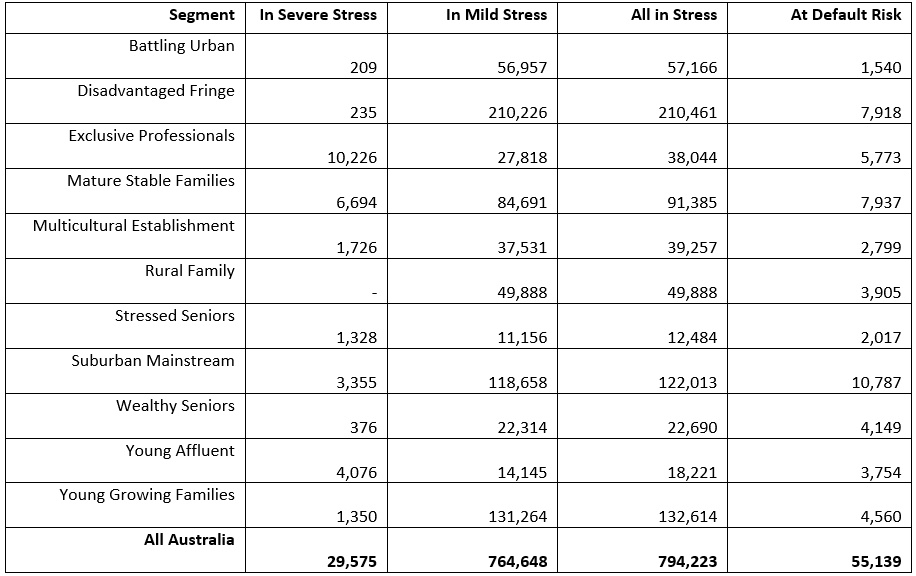
No, the real impact is among households. We think here are three groups of households who should be taking great care just now.

There are some amazing offers around for first time buyers, and lenders are falling over each other to try and attract them. This is because banks need new loans to fund their growth. But these buyers should beware. They are buying in at the top of the market, when rates are low. Banks have tightened their underwriting standards, but still they are too lax. Just because the bank says you can afford a loan does not mean it is the right thing to do. Any purchaser should run the numbers on a mortgage rate 3% (yes 3%) higher than the current rates on offer. If you can still afford the repayments, then go ahead. If not, and remember incomes are not growing very fast – best delay.

Second, there are people with mortgages in financial difficulty now. Well over 24% of households do not have sufficient cash-flow to pay the mortgage and other household expenses. The temptation is to use the credit card to fill the gap – but this is expensive, and only a short term fix. Households in strife need to build a budget (less than half have one) so they know what they are spending, and start to cut back. Talk to your lender also, as they have an obligation to assist in cases of hardship. And be very careful about refinancing your way out of trouble, it so often does not work.

Third there are property investors who are seeing rental incomes and mortgage repayments moving in opposite directions. As a result, despite tax breaks, the investment property looks a less good deal. Of course recent capital gains are there – and some savvy investors are selling down to lock in capital value – but be careful now. New property investors are in for a shock as mortgage rates rise further. And multiple investors, are most at risk. Should property values decline, then this will mark the real turning point; but we think the investment property party may be over.

This will play out over the next couple of years, but the bottom line is simply, mortgages will be more expensive, and households need to prepare now. Turnbull is right.

What income inequality looks like across Australia

From The Conversation.

With affordable houses increasingly out of reach, wage growth slow and household debt high, Australians are certainly feeling poor. But how do they compare to their neighbours? New Census data confirms there’s a lot of variability in income.

The Census breaks the country up into 349 geographic regions (named in quote marks below), some of which cover more than one major town and some of which group related suburbs within cities. We examined 331 of these regions, excluding those containing fewer than 1,000 households.

The data show there are high levels of income inequality within these regions. A simple way to measure this is to look at the ratio of income between those who are well off (the top 20% within a region) and of those who are relatively disadvantaged (the bottom 20%) in the Census data. In Australia the weekly household income for the top 20% (A$1,579 per week) is 3.5 times the income of the bottom 20% (A$457).


The “Melbourne City” region has the most unequal incomes in Australia, where the top 20% have an income that is 8.3 times as high as those in the bottom 20%. “Adelaide City” (ratio of 5.5) and the “Sydney Inner City” (4.8) also have quite high levels of inequality.

Two of the poorest regions in the Northern Territory also have very high inequality. These are the vast region that encircles Darwin, called “Daly, Tiwi, West Arnhem” (ratio of 5.2) and the “East Arnhem” region (5.3).

However, there are regions with varying income levels, that also had relatively low inequality ratios. The region of “Molonglo”, in South Canberra (ratio of 2.2), “West Pilbara” in Western Australia (2.4) and “Kempsey, Nambucca” on New South Wales’ north coast (2.5) all have low levels of inequality.

For our analysis, we used equivalised household income. Equivalisation is a technique in which members of a household receive different weightings, based on the amount of additional resources they need.

The Australian Bureau of Statistics assumes that the first adult in a household has a weighting of 1, each additional adult a weighting of 0.5, and each child a weighting of 0.3. Total household income is then divided by the sum of the weightings for a representative income.

Incomes across Australia

For the whole of Australia, the equivalised median household income (the income in the middle of the distribution) is A$878 per week. The region with the lowest median income was “Daly, Tiwi, West Arnhem” in the Northern Territory, at A$510 per week.


However, several regional areas like “Maryborough, Pyrenees” (northwest of Ballarat in Victoria), “Kempsey, Nambucca” (NSW), “Maryborough” (between Bundaberg and the Sunshine Coast in Queensland), “Inverell, Tenterfield” (in NSW’s Northern Tablelands) and “South East Coast” in Tasmania all had median incomes of A$575 per week or less.

At the other end of the distribution, households in leafy suburbs of North Sydney – “Mosman” (NSW) had a median income of A$1,767 per week. Areas like “South Canberra” (ACT), “Manly” (in Sydney’s east) and the mining-dominated “West Pilbara” (WA) all had median incomes of A$1,674 or more per week.

We also looked at the extremes of the distribution. We define high income as those households with an income of A$1,500 or more per week. This equates to about 22% of the population. We defined low-income households as having an income of less than A$400 per week (about 14% of households).

Around 40% of households in the “Daly, Tiwi, West Arnhem” region were classified as being in poverty compared to around 6% in “North Sydney, Mosman” region. Conversely, around 60% of households in this region were classified as having high income, compared with only 6% of households in “Kempsey, Nambucca”.

How segregated are we within regions and cities?

While government policy is often delivered at the regional level, people live their lives at the local or neighbourhood level. However, the relatively disadvantaged and the upper-middle class are often segregated within these regions.

Richard Reeves of the Brookings Institute argues the segregation of the upper-middle class in Australia means this group “hoards” the benefits in the region they live in. Among the location advantages he lists are: access to the best schools, opportunities to network with the wealthy and powerful and the ability to disproportionately accrue capital gains on housing assets. To avoid this kind of “opportunity hoarding”, the rich and poor would need to be evenly spread within a region.

A simple way to look at this is through a “dissimilarity index”. In essence, this measures the evenness with which two groups are spread across a larger area. It ranges from zero to one, with higher values indicating a more uneven distribution and zero indicating complete mixing.

Looking at the distribution of the high income. Across Australia, the dissimilarity index has a value of 0.27. This means that around 27% of high-income households would have to move neighbourhoods to make the distribution completely even.

This varies quite substantially by region. “Far North” (encompassing Cape York in QLD) has a dissimilarity index of 0.42. “Auburn” (in western suburbs of Sydney, NSW) and “Playford” (on Adelaide’s northern fringe) also have quite large values.

Our richest regions tend to have the most even distribution of the wealthy, with “North Sydney, Mosman”, “Molonglo” and “Manly” having values of 0.06 or less.

“East Arnhem” has a very high level of concentration of low income individuals by neighbourhood, with a dissimilarity index of 0.70. The next two highest regions (“Katherine” and “Alice Springs”) are also in the Northern Territory, with index values of 0.53 and 0.55 respectively.

We can also compare the measures we used, to find out how they relate to each other. The following figure shows that the richest regions tend to be those with the highest level of income inequality.

However, as inequality goes up, there tends to be a greater concentration of low income households by neighbourhood (there’s also less of a concentration of high income households).

Have and have nots

It’s true that the level of income mobility is higher in Australia than it is in the US. However, Australia also has prominent examples of economic policies that disproportionately benefit the upper-middle class, such as the capital gains tax discount and superannuation tax incentives.

Australia also has a geographically concentrated income distribution, with the rich living in neighbourhoods with other rich people. The poor are also more likely to live in close proximity to people who share their disadvantage.

If Richard Reeves is right, and the spatial segregation of high and low income households reinforces inequality across the generations, then policies that encourage the mixing of different social classes in the same neighbourhood and region should be a way forward.


Authors ; Nicholas Biddle, Associate Professor, ANU College of Arts and Social Sciences, Australian National University;  Francis Markham, Research Fellow, College of Arts and Social Sciences, Australian National University


Australian household debt breaks new records

From The New Daily.

The Reserve Bank board will be facing record-high debt levels when it decides on Tuesday whether or not to follow other central banks by lifting the official cash rate.

Ten years after the global financial crisis – which many trace to the collapse of two Bear Sterns hedge funds in July 2007 – Australians are more indebted than ever, largely because of mortgages.

The latest official data, published by the Reserve Bank on Friday, showed that Australian households owed debt in the March quarter equal to 190 per cent of their yearly disposable income – a new all-time high.

In a speech in May, Reserve Bank governor Dr Philip Lowe blamed this trend on a combination of low interest rates, slow wages growth and house price rises fuelled by overseas investor demand and strong population increases.

At its last interest rate meeting in June, the RBA board cited persistently weak wages growth as a key factor in it keeping the cash rate on hold at a record-low 1.5 per cent – where it was widely forecast to stay on Tuesday.

Household debt will no doubt weigh heavily on the minds of the RBA board.

Last month, the Swiss-based Bank for International Settlements captured headlines across the nation by warning that Australia’s surge in household indebtedness was likely to constrain future economic growth and increase our susceptibility to another crisis.

Global ratings agencies Moody’s and Standard & Poor’s have also downgraded the creditworthiness of Australian banks over fears about unsustainable debt and inflated house prices.

household debt to income

Australia’s debt-to-income ratio concerns many experts because it is globally unusual – and because high household debt frequently coincides with financial crises.

Not even the US, just before it plunged much of the world into economic chaos, had a debt-income ratio as high as Australia’s current 190 per cent. Estimates put US household debt closer to 140 per cent in 2007.

Further data from the Reserve Bank confirmed that Australia’s debt mountain is largely a consequence of soaring property prices.

In the March quarter, Australian housing debt reached 135 per cent of annual disposable income, according to the RBA, breaking another record.

housing debt to income

Homeowners hold a large share of the debt.

According to the Reserve Bank, the ratio of owner-occupier housing debt to yearly income hit 101.8 per cent in the March quarter – yet another all-time high.

The reason the Bank for International Settlements predicted that Australia’s economic growth would be curbed by debt was that inevitable interest rates rises would reduce disposable income of indebted households.

Household consumption is crucial to Australia’s economic growth – it accounted for 57 per cent of GDP in the March quarter. Rate rises could put that GDP figure at risk by reducing spending, the BIS said.

This is a key reason why most economists are predicting the Reserve Bank won’t hike the cash rate on Tuesday.

owner-occupier housing debt to income

The RBA Shadow Board – an independent panel of economists – has put a 59 per cent probability on a rate hold being the right decision on Tuesday, compared to a 39 per cent probability for a rate hike, and only 2 per cent probability for a rate cut.

“The spotlight is turning again to the high indebtedness of Australian households,” the Shadow Board noted.

However, there is some good news on debt. A wealth divide in the Australian housing market could lessen the risk of a US-style mortgage crash.

According to the RBA governor, housing debt is heavily skewed towards the wealthy.

“This is different from what occurred in the United States in the run-up to the subprime crisis, when many lower-income households borrowed a lot of money,” Dr Lowe said in May.

The bad news is that these mortgages are increasingly invading our retirement.

“Borrowers of all ages have taken out larger mortgages relative to their incomes and they are taking longer to pay them off,” Dr Lowe said.

“Older households are also more likely than before to have an investment property with a mortgage and it has become more common to have a mortgage at the time of retirement.”

Household Debt Busts the 190

The latest RBA E2 – Households Finances – Selected Ratios – data has been released. The inexorable rise in debt continues. No wonder mortgage stress is rising.

The ratio of household debt to annualised household disposable income , rose to 190.4, the ratio of housing debt to annualised household disposable income rose to 135, and worryingly the ratio of interest payments on housing debt to quarterly household disposable income has risen to 7.0, thanks to the out of cycle rate hikes and flat or falling incomes.  Of course failing cash rates helped households out, but the lending standards were not adjusted until too late.

As we highlighted on Friday, the current policy settings are plain wrongHouseholds are being hung out to dry. The debt overhang will bite harder as mortgage rates rise, and this will have a direct impact on spending power, and thus economic growth.

Time to tighten lending rules further, and add a counter cyclical capital buffer. Get on with it APRA! And apply some debt-to-income rules.

The working poor: one-in-five households being left behind

From The New Daily.

It was heartening on Thursday to see job ads continue to tick up, rising 1.7 per cent in the three months to the end of May, or 9.2 per cent in the past year.

But before we get too excited, this week’s census data raises real concerns that the kinds of jobs being created aren’t paying enough for workers to live on.

The alarming fact is that one-fifth of households in 2016 recorded a gross income, including all government benefits, of less than $650 a week.

To put that in context, that’s less than the full couple rate for the aged pension ($670 a week) and less than a full-time worker on the minimum wage ($673).

Think about that for a minute. If 800,000 households say they have income of less than $650, and if that figure by definition excludes retiree couples living on the full pension, or on a higher combination of pension and super, we’ve got a huge problem.

The census, for some reason, compares the number of households on $650 or less with households falling under the same threshold five years ago.

That’s a bit strange, because the consumer price index has risen a cumulative 9.85 per cent in that time. So you’d need $714 today to buy the same goods and services as in 2011.

For middle Australia, that’s proving less of a problem – real wages are not rising as quickly as GDP growth, which means companies are taking a larger share of growth as profits, but at least they’re ahead of inflation.

So while the economy expanded 6.2 per cent in real terms over five years, the median personal income was up 4.6 per cent , and median household incomes are up 6.1 per cent. Not great, but a lot better than for the sub-$650 group.

The Australian Council of Social Services estimates that 800,000 households are in housing stress – spending more than 30 per cent of their income on housing – and while that’s not an exact fit with the sub-$650 group, the overlap would be very large.

 Who are we forgetting?

When Bob Menzies spoke of a ‘forgotten people’ in his famous 1942 speech, he meant a middle class who were not wealthy, but neither backed by the then-huge union movement.

Well, times change. The census reveals an alarmingly large cohort of people forgotten for other reasons.

They are left behind by a skyrocketing housing market, stuck in the rut of under-employment, attacked as a drain on the budget or for not paying more tax, seeing their penalty rates cut, or forced to jump through undignified job-seeker hoops.

So yes, it’s natural for the political and media classes to welcome an uptick in job ads. But we have to ask if that’s going to do anything to lift the fortunes of the gradually swelling ranks of working poor.

This year’s census summary was released under the headline “Census reveals: we’re a fast changing nation”.

When one in five households live on less that the age pension and less than a single minimum wage, “a fast polarising nation” might be more apt.

‘Canberra to blame’ for next month’s sky-rocketing energy bills

Household budgets, already under pressure from flat incomes, underemployment and rising mortgage rates, face further cost of living pressures with the latest hikes in power prices, as highlighted by the New Daily.

Power bills will soar by hundreds of dollars next month in east coast states, and experts blame policy uncertainty in Canberra.

Two major retailers, Energy Australia and AGL, have announced they will hike prices substantially from July 1. A third, Origin Energy, is expected to follow soon.

Energy Australia will increase power bills by almost 20 per cent, roughly $300 more a year, for households in South Australia and New South Wales. Gas prices will go up 9.3 per cent in NSW and 6.6 per cent in SA, adding between $50 and $80 to annual bills.

Queensland customers will be least affected, suffering only a 7.3 per cent ($130) increase to residential power bills. This is due mainly to the Palaszczuk government forcing the state government-owned distribution network to take a hit to profits.

A week earlier, AGL, the country’s third-biggest energy provider, said it would push up electricity by 16.1 per cent and gas by 9.3 per cent next month in NSW, QLD, SA and the ACT.

Victorians and Tasmanians have escaped bill shock for now, but only because their prices operate on a different schedule. Annual price changes in those states will be announced in December, kicking in on January 1.

Dylan McConnell, energy expert at Melbourne University, said years of policy uncertainty resulted in barely any new generators being built to replace the withdrawal of ageing coal and gas-fired power stations.

This has forced the National Energy Market (which supplies to NSW, QLD, SA, VIC, TAS and the ACT) to rely more heavily on expensive gas-fired generators to fill gaps in supply.

“We’ve had an effective ‘capital strike’, where policy uncertainty has resulted in a lack of investment and delays with respect to upgrades, maintenance and new installations – whether that’s new renewables, new storage, new anything – forcing us to rely on older, gas-fired technology,” Mr McConnell told The New Daily.

“At the same time we’ve had the gas market open up LNG exports, which has put substantial pressure on gas prices.

“These higher gas prices have flowed through to electricity prices, mainly because of the way the price-setting mechanism works in the wholesale market. Basically, gas is the marginal generator a lot of the time, and it’s actually become more of the marginal generator. That means the effect is more acute.”

energy prices australia

If the sun stops shining on solar panels, the wind stops blowing on turbines and demand exceeds what traditional generators can supply, gas-fired turbine generators are fired up to plug the gap – at great expense to consumers.

Energy Australia and business groups have implored Canberra to embrace the recommendations of Chief Scientist Dr Alan Finkel, who published an energy policy review last week.

Energy Australia chief customer officer Kim Clarke said the Finkel review was a “good, solid blueprint” for Canberra to follow.

“A sensible next step is for governments to engage industry and other stakeholders on the Finkel package of reforms to discuss the best way forward,” Ms Clarke said in a statement.

The Finkel review confirmed that policy uncertainty has constrained the building of much-needed ‘dispatchable’ energy sources – that is, the kind of generators that can be switched on and off quickly to meet the increasingly more volatile energy usage habits of Australians.

“Uncertainty related to emissions reduction policy and how the electricity sector will be expected to contribute to future emissions reduction efforts has created a challenging investment environment,” Dr Finkel wrote.

In the absence of reliable power sources (which, Dr Finkel notes, could have included battery-stored solar and wind energy), generators have had to rely more heavily on gas turbines to create electricity, with the result that consumers pay more.

“Ageing generators are retiring from the NEM, but are not being replaced by comparable dispatchable capacity. Policy stability is required to give the electricity sector confidence to invest in the NEM.”

While Dr Finkel was at pains to say he was “technology neutral”, he predicted the future belonged to solar, wind and battery storage, not so-called lower-emission fossil fuels.

His main policy recommendation was his Clean Energy Target – effectively a watered-down carbon price – that would facilitate “an orderly transition to a low emissions future” and encourage investors to build new generators.

“It puts downward pressure on prices by bringing that new electricity generation into the market at lowest cost without prematurely displacing existing low-cost generators. It further ensures reliability by financially rewarding consumers for participating in demand response and distributed energy and storage.”

Dr Finkel’s report has sparked a war inside Coalition. Prime Minister Malcolm Turnbull and Energy Minister Josh Frydenberg are locked in a bitter debate with an estimated 20-25 anti-renewable Coalition MPs led by former prime minister Tony Abbott.

Other contributing factors to price hikes, noted by many experts, has been heavy investment in poles and wires, opportunistic price gouging by retailers, and the fact that many companies are both retailers and wholesalers (which has dried up liquidity for energy derivatives, especially in South Australia).

The problems with asking banks to police financial abuse

From The Conversation.

The Australian Law Reform Commission wants to give banks the responsibility to protect vulnerable customers from financial abuse. But there are a number of issues with this approach. Its success depends on the good faith of the banks, and could leave some customers uncovered and the banks with no one to report abuse to.

In a new report on elder abuse, the commission recommends that the Code of Banking Practice be amended so that banks take “reasonable steps” to prevent financial abuse.

But the code is voluntary and some banks have been lax in the past, meaning some customers won’t be covered. “Reasonable steps” still needs to be defined, to ensure all banks meet a standard. And we need transparency to know what financial abuse banks are dealing with, how and when.

Around 9% of older people living in the community are financially abused. It is likely the number is even higher among those with cognitive impairment or who live in institutions. Financial exploitation of older people is increasing and mostly perpetrated by those close to the victim, including family members.

The amendments to the code will include measures such as enhanced staff training to recognise elder financial abuse, an obligation to report suspected abuse, and recommendations to tackle the problem of forced guarantees for mortgages and other loans to relatives.

Can the banks protect vulnerable people?

Elder financial abuse is difficult to detect. However, banks and financial institutions are in a unique position to see it. Banks have face-to-face contact with customers, play a role in providing third-party authorisations, monitor electronic transactions and oversee lending.

But the Code of Banking Practice is voluntary, and many in the industry are not signed on. This could lead to troubling gaps in coverage. Institutions that do not sign up to the code will be under no obligation at all.

Although some have imposed protocols to address elder financial abuse, a recent interview with Kirsty Mackie, chairwoman of the Elder Abuse Committee of the Queensland Law Society, noted that training of front-line banking staff, collaboration between institutions, understanding of the bank’s legal position, and preparedness to act in the customer’s best interest were all lacking.

The commission also settled on a standard that requires banks to take “reasonable steps” to prevent financial abuse, despite Legal Aid NSW recommending that a higher standard be adopted. The proposed alternative was to require banks to “take all steps” to prevent financial abuse.

A standard based on what is “reasonable” is problematic as context matters; what one bank may regard as a reasonable response to suspicions of elder abuse may differ from what a court or the general public thinks.

In the United States, some states impose mandatory reporting of elder financial abuse, but Australia looks set to make reporting voluntary. This leads on to the issue of transparency.

We need to know under what circumstances banks will keep matters “in house”, to decide if these are appropriate. Criteria for reporting suspected financial abuse need to be established, as well as a body to report to. The commission has recommended the implementation of an adult guardian to which complaints could be referred. All these issues remain unclear and will require more discussion.

A related concern is the potential ramifications for people who make reports. In Australia, whistle-blower protection remains inadequate. Indeed, the Australian Banking Association submission to the Australian Law Reform Commission suggested that immunity be granted to banks that report instances of elder financial abuse.

Finally, given that banks will deal internally with most instances of elder financial abuse, it is important that we ensure the bank’s response balances the autonomy of older people while addressing elder financial abuse.

Where to from here?

The commission recommendation is welcome and will bolster the safeguards already in place. More discussion will be needed in the aftermath of the inquiry to ensure the recommendations are implemented and their potential realised.

The reality is that success will rest largely on the good faith of the banks. There must be willingness to build a collaborative and consistent approach to acting on elder financial abuse and to ensure rigorous internal procedures are put in place and followed. Employees who make reports of elder abuse must also have adequate protection.

This, in turn, must feed into an appropriately resourced entity where the most serious matters can be directed.

Author: Eileen Webb, Associate Professor, Curtin Law School, Curtin University

Household Debt Rising Further – RBA

The latest chart pack from the RBA to June 2017 includes the worrisome chart on household debt levels.

No sign of a change in trajectory, despite low wage growth and some lending tightening. The last available data point on household debt to income is 188.7 from December 2016.  The March data should be out soon and will be higher again.

Of course this is an average, and some households are in deep debt strife, right now, as higher mortgage rates hit. See our latest mortgage stress analysis released a couple of days ago.

Mortgage Stress Accelerates Further In May

Digital Finance Analytics has released mortgage stress and default modelling for Australian mortgage borrowers, to end May 2017.  Across the nation, more than 794,000 households are now in mortgage stress (last month 767,000) with 30,000 of these in severe stress. This equates to 24.8% of households, up from 23.4% last month. We also estimate that nearly 55,000 households risk default in the next 12 months.

The main drivers are rising mortgage rates and living costs whilst real incomes continue to fall and underemployment is on the rise.  This is a deadly combination and is touching households across the country,  not just in the mortgage belts.

This analysis uses our core market model which combines information from our 52,000 household surveys, public data from the RBA, ABS and APRA; and private data from lenders and aggregators. The data is current to end May 2017.

We analyse household cash flow based on real incomes, outgoings and mortgage repayments. Households are “stressed” when income does not cover ongoing costs, rather than identifying a set proportion of income, (such as 30%) going on the mortgage.

Those households in mild stress have little leeway in their cash flows, whereas those in severe stress are unable to meet repayments from current income. In both cases, households manage this deficit by cutting back on spending, putting more on credit cards and seeking to refinance, restructure or sell their home.  Those in severe stress are more likely to be seeking hardship assistance and are often forced to sell.

Martin North, Principal of Digital Finance Analytics said “Mortgage stress continues to rise as households experience rising living costs, higher mortgage rates and flat incomes. Risk of default is rising in areas of the country where underemployment, and unemployment are also rising. Expected future mortgage rate rises will add further pressure on households”.

“Stressed households are less likely to spend at the shops, which acts as a drag anchor on future growth. The number of households impacted are economically significant, especially as household debt continues to climb to new record levels. The latest housing debt to income ratio is at a record 188.7* so households will remain under pressure.”

“Analysis across our household segments highlights that stress is touching more affluent groups as well as those in traditional mortgage belts”.

*RBA E2 Household Finances – Selected Ratios Dec 2016.

Regional analysis shows that NSW has 216,836 (211,000 last month) households in stress, VIC 217,000 (209,000), QLD 145,970 (139,000) and WA 119,690 (109,000). The probability of default has also risen, with more than 10,000 in WA, 10,000 in QLD, 13,000 in VIC and 15,000 in NSW.

Probability of default extends the mortgage stress analysis by overlaying economic indicators such as employment, future wage growth and cpi changes.  Regional analysis is included in the table below.

Treasury Says Housing Is A Key Economic Risk

There were a number of familiar themes in Secretary to the Treasury John Fraser’s opening address to budget estimates. But the section on household finances bears close reading. He says developments in the housing market will remain a key risk to the outlook and the near term the outlook for wage growth remains subdued, reflecting spare capacity in the labour market.

Household consumption has grown in recent years, but below historical rates with average growth in consumption per capita of just 1.1 per cent since the GFC.

This partly reflects weak per capita income growth over this period.

Consumption accounts for around 60 per cent of GDP and almost half of GDP growth so it is a critical factor in determining the strength of the economy.

We expect household consumption to pick up over the forecast horizon and continue to grow by more than household income, as labour market conditions improve and wages growth picks up. This would result in a further decline in the household saving rate.

Still, there are risks to the real economy around the momentum in household consumption – in particular, a change in households’ attitudes toward saving could lead to household consumption being weaker than forecast.

Wage growth has recently been low by historical standards, with the wage price index growing by 1.9 per cent through the year to March 2017.

We expect wages growth to increase as domestic demand strengthens, but in the near term the outlook for wage growth remains subdued, reflecting spare capacity in the labour market.

The near term outlook for inflation is also subdued.

Although full-time employment has strengthened recently, labour market conditions have generally softened after strong employment growth in 2015, with the majority of employment increases over the last 18 months being been in part time employment.

All that said, the unemployment rate remains below 6 per cent and indicators such as job advertisements, vacancies and business survey measures suggest labour market conditions will improve.

Employment is forecast to grow by one and half per cent through the year to the June quarters of 2018 and 2019 and the unemployment rate is forecast to decline modestly through the forecast period – consistent with an improving outlook for business and the economy overall.

Housing and dwelling investment

Household balance sheets have been strengthened by a notable rise in the value of housing and superannuation assets since the GFC, with household assets now more than five times higher than household debt.

We should be mindful that household debt has grown more rapidly than incomes in recent years, driven in particular by increasing levels of housing debt.

Dwelling prices have increased by 16 per cent through the year in Sydney and 15.3 per cent in Melbourne, though there have been some recent indications that this growth is moderating.

It is also important to emphasise that in other cities and regions, prices have been growing more moderately or declining for some years.

There are a number of complex factors that drive the housing market across both the demand side and the supply side.

For instance, there is no doubt that low interest rates have combined with population growth along the east coast to increase demand and support greater dwelling investment.

At the same time, insufficient land release, complex planning and zoning regulations and public aversion to urban infill have impacted the supply of housing.

Residential construction activity was subdued in the mid‑to-late 2000s leading to a state of pent-up demand in the housing market.

But activity has strengthened since 2012 with significant investment in medium-to-high density dwellings.

As the current pipeline of dwelling construction reaches completion over the next two years it is likely that dwelling investment will ease as a share of the economy.

Developments in the housing market will remain a key risk to the outlook, and the Treasury and our regulatory counterparts will be paying close attention to adjustments in the market.

As the steps taken recently by the Australian Prudential Regulation Authority demonstrate, there is a role for sensible and careful measures that can address risks and underpin market stability – and we will continue to focus on these going forward