RBA Governor Philip Lowe spoke at the Economic Society of Australia (QLD) Business Lunch. Of note is the data which shows one third of households with a mortgage have little or no interest rate buffer, and that the Reserve Bank does not have a target for the debt-to-income ratio or the ratio of nationwide housing prices to income.
This afternoon I would like to talk about household debt and housing prices.
This is a familiar topic and one that has attracted a lot of attention over recent times. It is understandable why this is so. The cost of housing and how we finance it matters to us all. We all need somewhere to live and for many people, their home is their largest single asset. Real estate is also the major form of collateral for bank lending. The levels of debt and housing prices also affect the resilience of our economy to future shocks. Beyond these economic effects, high levels of debt and housing prices have broader effects on the communities in which we live. The high cost of housing is a real issue for many Australians and can have serious side-effects. High levels of debt and high housing costs can also reinforce the existing distribution of wealth in our society, making social and geographic mobility more difficult. So it is understandable why Australians are so interested in these issues.
At the Reserve Bank, we too have been focused on these issues in the context of our monetary policy and financial stability responsibilities. Our work has been in three broad areas. First, understanding the aggregate trends and their causes. Second, understanding how debt is distributed across the community. And third, understanding how the level of debt and housing prices affect the way the economy operates and its resilience to future shocks.
This afternoon, I would like to make some observations in each of these three areas.
Aggregate Trends
This first chart provides a good summary of the aggregate picture (Graph 1). It shows the ratios of nationwide housing prices and household debt to household income. Housing prices and debt both rose a lot from the mid 1990s to the early 2000s. The ratios then moved sideways for the better part of a decade – in some years they were up and in others they were down. Then, in the past few years, these ratios have been rising again. Both are now at record highs.
Graph 1
Although the debt-to-income ratio has increased over recent times, the ratio of debt to the value of the housing stock has not risen. This reflects the large increase in housing prices and the growth in the number of homes. Over recent times, there has also been a substantial increase in the value of households’ financial assets, with the result that the ratio of household wealth to income is at a record high (Graph 2). So both the value of our assets and the value of our liabilities have increased relative to our incomes.
Graph 2
Turning now to why the ratios of housing prices and debt to income have risen over time. A central factor is that financial liberalisation and the lower nominal interest rates that came with the lower inflation of the 1990s increased people’s ability to borrow. These developments meant that Australians could take out larger and more flexible loans. By and large, we took advantage of this new ability, as we sought to buy the housing we desired.
We could, of course, have used the benefit of lower nominal interest rates in the 1990s and the increased ability to borrow for other purposes. But instead we chose to borrow more for housing and this pushed up the average price of housing given the constraints on the supply side. The supply of well-located housing and land in our cities has been constrained by a combination of zoning issues, geography and inadequate transport. Another related factor was that our population was growing at a reasonable pace. Adding to the picture, Australians consume more land per dwelling than is possible in many other countries, although this is changing, and many of us have chosen to live in a few large coastal cities. Increased ability to borrow, more demand and constrained supply meant higher prices.
So we saw marked increases in the ratios of housing prices and debt to household incomes up until the early 2000s. At the time, there was much discussion as to whether these higher ratios were sustainable. As things turned out, the higher ratios have been sustained for quite a while. This largely reflects the choices we have made as a society regarding where and how we live (and how much at least some of us are prepared to spend to do so), urban planning and transport, and the nature of our financial system. It is these choices that have underpinned the high level of housing prices. So the changes that we have seen in these ratios are largely structural.
Recently, the ratios of housing prices and debt to household income have been increasing again. Lower interest rates both in real and nominal terms – this time, largely reflecting global developments – have again played some role. But there have also been other important factors at work over recent times.
One of these is the slow growth in household income. During the 2000s, aggregate household income increased at an average rate of over 7 per cent (Graph 3). In contrast, over the past four years growth has averaged less than half of this, at about 3 per cent. Slower growth in incomes will push up the debt-to-income ratio unless growth in debt also slows. This partly explains what has happened over recent years.
Graph 3
A second factor is that some of our cities have become major global cities. Reflecting this, in some markets there has been strong demand by overseas investors.
A third factor has been stronger population growth. Population growth picked up during the mining investment boom and, although it subsequently slowed, it is still around ½ percentage point faster than it was before the boom (Graph 4). For some time the rate of home-building did not respond to the faster population growth; indeed, the response took the better part of a decade. The rate of home-building has now responded and we are currently adding to the housing stock at a rate not seen for more than two decades. Over time, this will make a difference.
Graph 4
It is Melbourne and Sydney where population growth has been the fastest over recent times. Not surprisingly, it is these two cities where the price gains have been largest, and these price gains have helped induce more supply. Indeed, Victoria and New South Wales account for all of the recent upward movement in the national housing price-to-income ratio (Graph 5). In the other states, the ratio of housing prices to income is below previous peaks. So there is not a single story across the country. This is despite us having a common monetary policy for the country as a whole. Factors other than the level of interest rates are clearly at work.
Graph 5
In summary then, the supply-demand dynamics have been pushing aggregate housing prices in our largest cities higher relative to our incomes. With interest rates as low as they have been, and prices rising, many people have found it attractive to borrow money to invest in an asset whose price is increasing. The result has been strong growth in borrowing by investors, with investors accounting for 30 to 40 per cent of new loans.
This borrowing is not the underlying cause of the higher housing prices. But the borrowing has added to the upward pressure on prices caused by the underlying supply-demand dynamics. It has acted as a financial amplifier in some cities, adding to the already upward pressure on prices. The borrowing by investors is also obviously contributing to the rise in the aggregate debt-to-income ratio. Just like in the early 2000s, there is again a discussion as to whether these increases will continue and whether they are sustainable.
The Distribution of Debt
I would now like to turn to the distribution of housing debt across households. This is important, as it is not the ‘average’ household that gets into trouble. At the Reserve Bank we have devoted considerable resources to understanding this distribution. One important source of household-level information is the survey of Household Income and Labour Dynamics in Australia (HILDA).
If we look across the income distribution, it is clear that the rise in the debt-to-income ratio has been most pronounced for higher-income households (Graph 6). This is different from what occurred in the United States in the run-up to the subprime crisis, when many lower-income households borrowed a lot of money.
Graph 6
It is also possible to look at how the debt-to-income ratio has changed across the age distribution. This ratio has risen for households of all ages, except the very youngest, who tend to have low levels of debt (Graph 7). Borrowers of all ages have taken out larger mortgages relative to their incomes and they are taking longer to pay them off. Older households are also more likely than before to have an investment property with a mortgage and it has become more common to have a mortgage at the time of retirement.
Graph 7
We also look at the share of households with a debt-to-income ratio above specific thresholds. In 2002, around 12 per cent of households had debt that was over three times their income (Graph 8). By 2014, this figure had increased to 20 per cent of households. There has also been an increase, although not as pronounced, in the share of households with even higher debt-to-income ratios.
Graph 8
Another dataset that provides insight into distributional issues is one maintained by the Reserve Bank on loans that have been securitised. This indicates that around two-thirds of housing borrowers are at least one month ahead of their scheduled repayments and half of borrowers are six months or more ahead (Graph 9). This is good news. But a substantial number of borrowers have only small buffers if things go wrong.
Graph 9
At the overall level, though, nationwide indicators of household financial stress remain contained. This is not surprising with many borrowers materially ahead on their mortgage repayments, interest rates being low and the unemployment rate being broadly steady over recent years. At the same time, though, the household-level data show that there has been a fairly broad-based increase in indebtedness across the population and the number of highly indebted households has increased.
Impact on Economy and Policy Considerations
I would now like to turn to the third element of our work: the implications of all this for the way the economy operates and its resilience.
It is now commonplace to say that housing prices and debt levels matter because of financial stability. What people typically have in mind is that a severe correction in property prices when balance sheets are highly leveraged could make for instability in the banking system, damaging the economy. So the traditional financial stability concern is that the banks get in trouble and this causes trouble for the overall economy.
This is not what lies behind the Reserve Bank’s recent focus on household debt and housing prices in Australia. The Australian banks are resilient and they are soundly capitalised. A significant correction in the property market would, no doubt, affect their profitability. But the stress tests that have been done under APRA’s eye confirm that the banks are resilient to large movements in the price of residential property.
Instead, the issue we have focused on is the possibility of future sharp cuts in household spending because of stretched balance sheets. Given the high levels of debt and housing prices, relative to incomes, it is likely that some households respond to a future shock to income or housing prices by deciding that they have borrowed too much. This could prompt a sharp contraction in their spending, as they try to get their balance sheets back into better shape. An otherwise manageable downturn could be turned into something more serious. So the financial stability question is: to what extent does the higher level of household debt make us less resilient to future shocks?
Answering this question with precision is difficult. History does not provide a particularly good guide, given that housing prices and debt relative to income are at levels that we have not seen before, and the distribution of debt across the population is changing.
Given this, one of the research priorities at the Reserve Bank has been to use individual household data to understand better how the level of indebtedness affects household spending. The results indicate that the higher is indebtedness, the greater is the sensitivity of spending to shocks to income. This is regardless of whether we measure indebtedness by the debt-to-income ratio or the share of income spent on servicing the debt. If this result were to translate to the aggregate level, it would mean that higher levels of debt increase the sensitivity of future consumer spending to certain shocks.
The higher debt levels also appear to have affected how higher housing prices influence household spending. For some years, households used the increasing equity in their homes to finance extra spending. Today, the reaction seems different. This is evident in the estimates of housing equity injection (Graph 10). In earlier periods of rising housing prices, the household sector was withdrawing equity from their housing to finance spending. Today, households are much less inclined to do this. Many of us feel that we have enough debt and don’t want to increase consumption using borrowed money. Many also worry about the impact of higher housing prices on the future cost of housing for their children. As I have spoken about previously, higher housing prices are a two-edged sword. They deliver capital gains for the current owners, but increase the cost of future housing services, including for our children.
Graph 10
This change in attitude is also affecting how spending responds to lower interest rates. With less appetite to incur more debt for current consumption, this part of the monetary transmission mechanism looks to be weaker than it once was. There is, however, likely to be an asymmetry here. When the interest rate cycle turns and rates begin to rise, the higher debt levels are likely to make spending more responsive to interest rates than was the case in the past. This is something that we will need to take into account.
In terms of resilience, my overall assessment is that the recent increase in household debt relative to our incomes has made the economy less resilient to future shocks. Given this assessment, the Reserve Bank has strongly supported the prudential measures undertaken by APRA. Double-digit growth in debt owed by investors at a time of weak income growth cannot be strengthening the resilience of our economy. Nor can a high concentration of interest-only loans.
I want to point out that APRA’s measures are not targeted at high housing prices. The international evidence is that these types of measures cannot sustainably address pressures on housing prices originating from the underlying supply-demand balance. But they can provide some breathing space while the underlying issues are addressed. In doing so, they can help lessen the financial amplification of the cycle that I spoke about before. Reducing this amplification while a better balance is established between supply and demand in the housing market can help with the resilience of our economy.
There are some reasons to expect that a better balance between supply and demand will be established over time.
One is the increased rate of home-building. As we are seeing here in Brisbane and some parts of Melbourne, increased supply does affect prices. This increase in supply is also affecting rents, which are increasing very slowly in most markets.
A second reason is the increased investment in some cities, including in Sydney, on transport. Over time, this will increase the supply of well-located residential land, and this will help as well.
And a third reason is that at some point, interest rates in Australia will increase. To be clear, this is not a signal about the near-term outlook for interest rates in Australia but rather a reminder that over time we could expect interest rates to rise, not least because of global developments. Over recent years, the low interest rates in Australia have helped the economy adjust to the winding down of the mining investment boom. They have helped support employment and demand through a significant adjustment in the Australian economy. We should not, though, expect interest rates always to be this low.
It remains to be seen how the various influences on housing prices play out. Other policies, including tax and zoning policies, also have an effect. But increased supply and better transport could be expected to help address the ongoing rises in housing prices relative to incomes. These changes and some normalisation of interest rates over time might also reduce the incentive to borrow to invest in an asset whose price is rising strongly. To the extent that, over time, a better balance is established, we will be better off not incurring too much debt, and having housing prices go too high, while this is occurring.
I want to make it clear that the Reserve Bank does not have a target for the debt-to-income ratio or the ratio of nationwide housing prices to income.
As I spoke about earlier, there are good reasons why these ratios move over time. My judgement, though, is that, in the current environment, the resilience of our economy would be enhanced by an extended period in which housing prices and debt outstanding increased no faster than our incomes. Again, this is not a target or a policy objective of the Reserve Bank, but rather a general observation about how we build resilience.
Many of you will be aware that these issues have figured in the deliberations of the Reserve Bank Board for some time. This is entirely consistent with our flexible medium-term inflation targeting framework. With a medium-term target, it is appropriate that we pay attention to the resilience of our economy to future shocks. In the current environment of low income growth, faster growth in household debt is unlikely to help that resilience.
We have also been watching the labour market closely. The unemployment rate has moved up a little over recent months and wage growth remains subdued. Encouragingly, employment growth has been a bit stronger of late and the forward-looking indicators suggest ongoing growth in employment. We will want to see a continuation of these trends if the overall growth in the economy is to pick up as we expect. Stronger growth in incomes would of course also help people deal with the high levels of debt and housing prices. Overall, our latest forecast is for economic growth to pick up gradually and average around 3 per cent or so over the next few years.
To conclude, I hope these remarks help provide some insight into the Reserve Bank’s thinking about housing prices and household debt. As household balance sheets have changed, so too has the way that the economy works. Both from an individual and an economy-wide perspective, we need to pay attention to how the higher level of debt affects our resilience to future shocks.
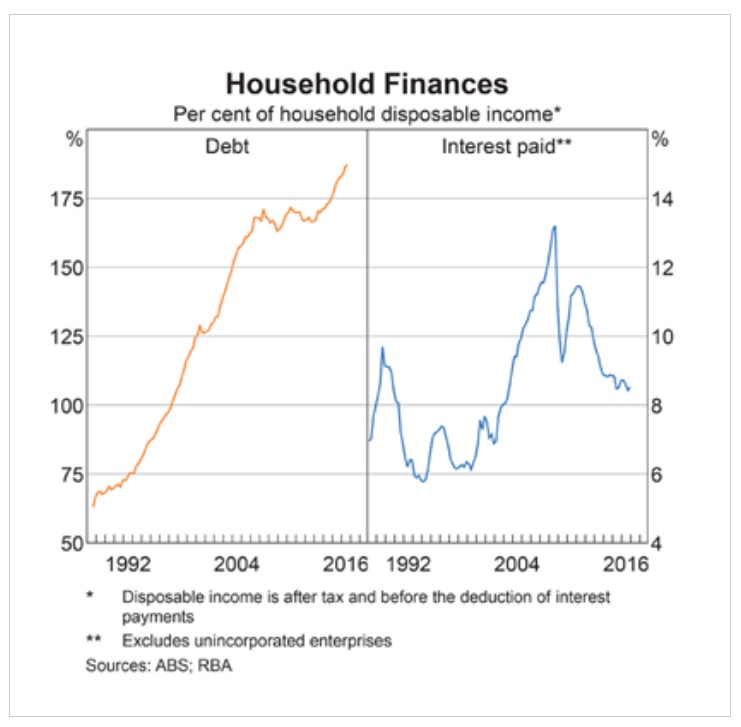
The RBA released their May 2017 chart pack. We once again went straight to the household finances section, and as expected the debt to income ratio has deteriorated further. More debt means more stress, all else being equal. And with rates rising… etc … you know the rest!
The burden of housing costs is biting even in Australia’s wealthiest suburbs as an unprecedented one in four households nationally face mortgage stress, according to the latest in a 15-year series of analyses.
Households in Toorak and Bondi, prestigious pockets of affluence in Australia’s biggest cities, have made the list of those struggling to meet repayments amid rising costs and stagnating wages, research firm Digital Finance Analytics has found.
The firm’s principal, Martin North, said it was surprising new evidence showed that financial distress from property price surges reached beyond “the battlers and the mortgage belt” and was a “much broader and much more significant problem”.
The survey, which analyses real cash flows against mortgage repayments, finds more than 767,000 households or 23.4% are now in mortgage stress, which means they have little or no spare cash after covering costs.
This includes 32,000 that are in severe stress, meaning they cannot cover repayments from current income.
The firm predicts that almost 52,000 households will probably default on mortgages over the next year. Risk hotspots include Meadow Springs and Canning Vale in Western Australia, Derrimut and Cranbourne in Victoria, and Mackay and Pacific Pines in Queensland.
Overall, New South Wales and Victoria, whose capital cities have seen a recent surge in home prices, accounted for more than half the probable defaults (270,000) and households in mortgage distress (420,000).
North said the numbers were “an early indicator of risk in the system”.
The underlying drivers were “flat or falling wage growth”, much faster rising living costs and the likelihood mortgage interest payments would only go up.
Widespread mortgage burdens were limiting spending elsewhere and “sucking the life out of the economy”, and the problem should be addressed to head off a housing crash and its repercussions, North said.
“If we start seeing house prices slipping then this can turn into a US 2007 scenario rather quickly,” he said.
North is not alone in highlighting household vulnerability. The Reserve Bank of Australia’s financial stability review last month observed one-third of Australian borrowers had little or no mortgage “buffer”, which North said was “the first time they’ve ever admitted it”.
“The surprising thing is that people in Bondi in NSW, for example, or even young affluents who have bought down in Toorak in Victoria are actually on the list [of mortgage stressed],” North said.
“The reason is they’ve bought significantly large mortgages to buy a unit, modified or brand new.
“They’ve got bigger incomes than average but essentially they are highly leveraged so they have little wiggle room and of course any incremental rate rise, because they’ve got such big mortgages, slugs them pretty heavily.”
Semi-retirees who moved to central coast NSW but are still exposed to large mortgages while their incomes were falling away were another atypical snapshot of those in financial distress, North said.
“And the people at the top, the most affluent households, the ones who’ve got really big properties, have the lifestyles to match. So again, their spare cash is not huge.
“And that point – it isn’t just the mortgage belt, it isn’t just the typical battlers who are actually exposed here – shows is a much broader, more significant problem.”
Mortgage brokers have an important role to play for the increasing number of households experiencing mortgage stress, as they are a “very good source of advice” according to a market analyst.
Around 52,000 households are now at risk of default in the next 12 months, according to mortgage stress and default modelling from Digital Finance Analytics for the month of April.
The modelling revealed that across the nation, more than 767,000 households are now in mortgage stress (669,000 in March) with 32,000 of those in ‘severe’ stress. Overall, this equates to 23.4 per cent of households, up from 21.8 per cent on the prior month.
Speaking to Mortgage Business, Digital Finance Analytics principal Martin North remarked that mortgage brokers have a role to play for stressed households in terms of helping them “find their way through the maze”.
“Maybe that’s a restructure, maybe it’s a different type of loan… I think [brokers] are a very good source of advice for households and for people who come and seek guidance [for example] refinancing may help,” Mr North said.
In saying this, Mr North noted that when it comes to identifying an appropriate loan for customers, brokers should remain “conservative” in their estimation of what households can afford.
“Don’t encourage households to borrow as big as they can. That 2 to 3 per cent buffer is really important, and those spending and affordability calculations are really important.
“There’s an obligation both on brokers and on lenders to do due diligence on borrowers to make sure that they’re not buying unsuitably, and that includes detailed analysis of household expenditure.
“My observation is that some of those calculations don’t necessarily get to the real richness of where households are at, so I think that all those operating in the market need to be aware of the fact that how we look at spending becomes really important on mortgage assessments.”
Mr North added that brokers should operate on the assumption that rates and the cost of living will continue to rise, while incomes remain static.
“So, don’t try and flog that bigger mortgage,” he recommended. “I would say be conservative in your advice and the structure of the conversation you have.”
The latest results of Digital Finance Analytics’ mortgage stress and default modelling are “not all that surprising”, Mr North said, considering that incomes are static or falling, mortgage rates are rising, and the cost of living remains “very significant” for many households.
“All those things together mean that we’ve got a bit of a perfect storm in terms of creating a problem for many households,” he said, adding that for many households, any further rises in mortgage rates or the cost of living would be sufficient to move them from ‘mild’ to ‘severe’ stress.
“It doesn’t take much to tip people over the edge. It takes about 18 months to two years between people getting into financial difficulty and ultimately having to refinance or sell their property or do something to alleviate it dramatically, so I think we’re in that transition period at the moment as rates rise… over the next 12 to 18 months my expectation is that we would see mortgage stress and defaults both on the up.”
According to Mr North, Digital Finance Analytics’ data uses a core market model, which combines information from its 52,000 household surveys, public data from the RBA, ABS and APRA, and private data from lenders and aggregators. The data is current to the end of April 2017.
The market analyst examines household cash flow based on real incomes, outgoings and mortgage repayments. Households are “stressed” when income does not cover ongoing costs, rather than identifying a set proportion of income, (such as 30 per cent) directed to a mortgage.
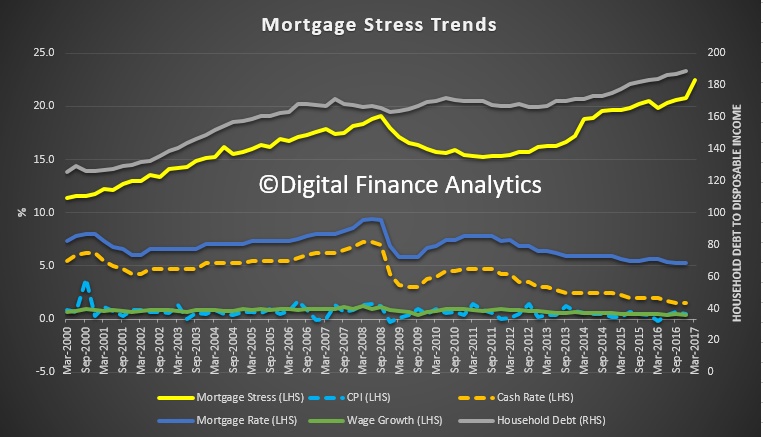
By way of background, we have been tracking stress for years, and in 2014 we set out the approach we use. Other than increasing the sample, and getting more granular on household finance, the method remains the same, and consistent. We can plot the movement of stress over time.
Remember that the recent RBA Financial Stability review revealed that 30% of households were under pressure with no mortgage buffer, and a recent Finder.com.au piece suggested more than 50% were unable to cope with a $100 a month rise. So we are not alone in suggesting households are under greater financial pressure.
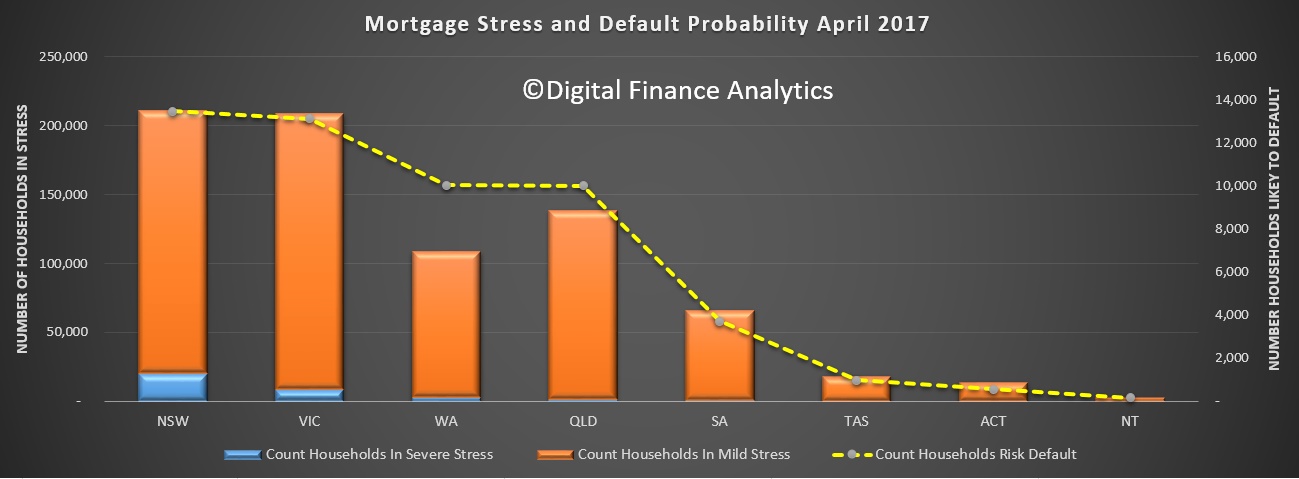
For this analysis we plot the number of households in mild stress (making mortgage repayments on time but tightening their belts so to do); severe stress (insufficient cash flow to pay the mortgage), and also an estimation of the number of households who may hit a 30-day default within the next 12 months. This is calculated by adding in a range of economic overlays into the stress data. This is all done in our core market model, which contains data from our rolling surveys, private data from lenders and other sources, and public data from the RBA, APRA and ABS. This model is unique in the Australian context because it runs at a post code and household segment level, allowing us to drill into the detail. This is important because averaging masks significant variations.
The analysis shows that there are more severely stressed households in NSW than other states, and that around 13,000 households risk default in the next year, a similar number to VIC. WA is third on this list, with the number of defaults lower elsewhere.
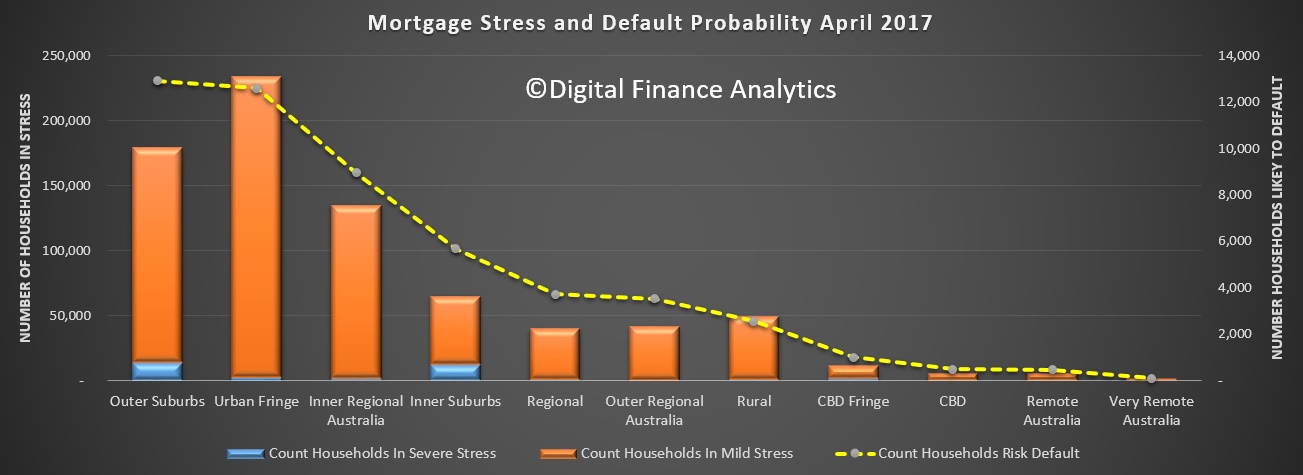
Another lens is by the locations of households, in the residential zones around our major cities. The highest risk of default resides in the our suburbs, where a higher proportion of households are in severe stress. Households in inner regional Australia are next, followed by the inner suburbs, where again more households are in severe stress.
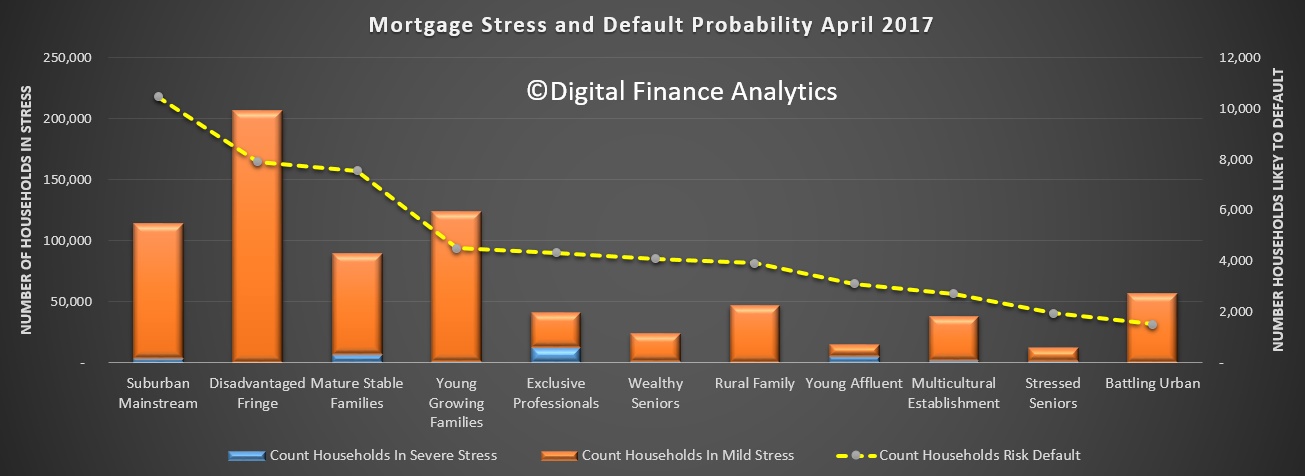
Our core household segmentation shows that the highest count of defaults are likely among the suburban mainstream, then the disadvantaged fringe, followed by mature stable families and young growing families. It is also worth noting that the young affluent and exclusive professional, the two most affluent segments contain a number of severe stressed households. This have larger mortgages and lifestyles, but not necessarily more available cash.
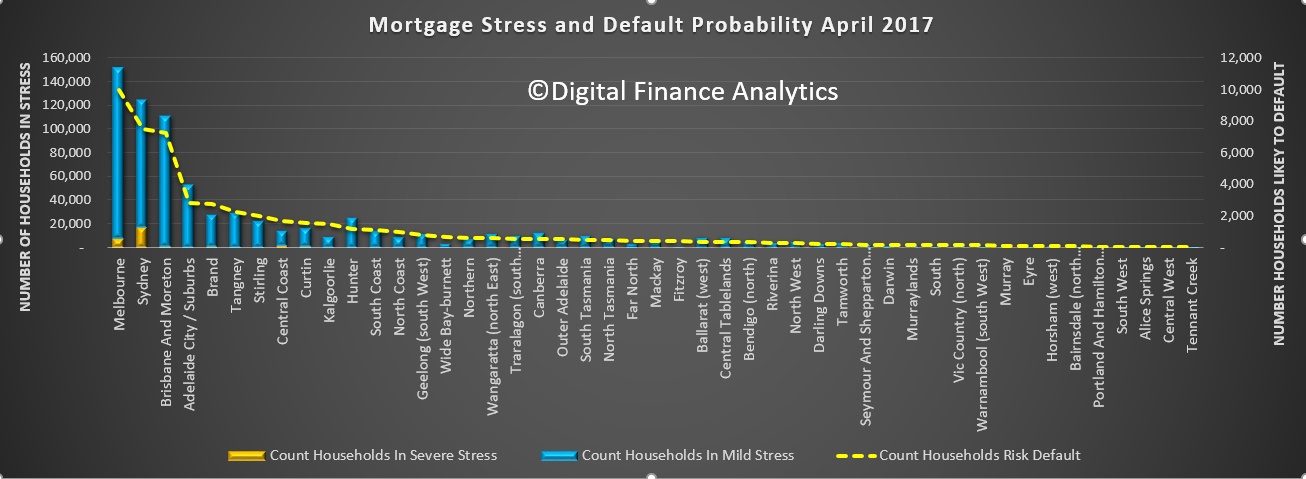
Finally, for today, here is the mapping across the regions. No surprise that the largest number of stressed households are in the main urban centres of Melbourne and Sydney.
Next time we will look at post codes across the country.
Record numbers of Australian households face mortgage stress as large loans and rising interest rates start to bite, according to detailed analysis of lending, repayments and household incomes.
Affluent suburban postcodes feature among an estimated 1000 households a week expected to face mortgage default over the next 12 months, the analysis reveals.
“Debt stress momentum is unprecedented,” according to Martin North, principal of research firm Digital Finance Analytics, who has been doing the survey for more than 15 years.
“This is not just about mortgage battlers. It is also hitting the households with bigger incomes and more leverage. It is worrisome,” Mr North said. Numbers of borrowers in severe distress has increased by about one-third to about 32,000 in the past 12 months, he said.
Concern that 767,000 households – or one-in-four across the nation – are facing financial distress follows last month’s warning by the Reserve Bank of Australia about increasing family “vulnerability” caused by soaring property prices, particularly in Melbourne and Sydney.
Ms Bullock conceded that the effect of so-called macroprudential regulations imposed on the banks in 2015 to curb investor lending may be fading.
It also follows the Australian Securities and Investments Commission discovery that about 1.5 million recent loan applications matched minimum financial requirements, triggering concerns about lax lending standards.
Other prudential regulators are warning about the need to control interest-only lending because of concerns borrowers’ lack strategies for repaying principals, increasing vulnerability to financial stresses.
Digital Finance Analytics’ report is based on information from 52,000 household surveys and public data from the Reserve Bank of Australia, Australian Bureau of Statistics, Australian Prudential Regulation Authority and information from lenders and aggregators, which are companies that act as intermediaries between mortgage brokers and lenders.
Households are “stressed” when income does not cover ongoing costs, rather than identifying a percentage of income committed to mortgage repayments, such as 30 per cent of after-tax income.
Those in “severe distress” are unable to meet repayments from current income, which means they have to cut back on spending or rely on credit, refinancing, loan restructuring or selling their house.
Mortgage holders under “severe distress” are more likely to seeking hardship assistance and are often forced to sell.
“Stressed households are less likely to spend, which acts as a drag anchor on future economic growth,” said Mr North. “The number of households impacted are economically significant, especially as household debt continues to climb to new record levels.”
However lenders would be expected able to ride out a spike in arrears because they can foreclose on properties whose value has been inflated by unprecedented price growth.
State government budgets in the nation’s most populous states and territories have been boosted significantly by stamp duty charged on property transactions.
About 32,000 households are in severe distress, the analysis reveals. An additional 10,500 households in the suburban mainstream are in risk of default.
Other vulnerable community segments at risk of default include young growing families, the highly leveraged young ‘affluent’.
Commonwealth Bank of Australia, Westpac, National Australia Bank and Australian and New Zealand Banking Group have all raised investor rates in recent weeks.
Lenders are describing their strategy of slugging interest-only investors and easing pressure on principal and interest borrowers as the “new normal” because it differentiates between classes of borrowers as directed by regulators.
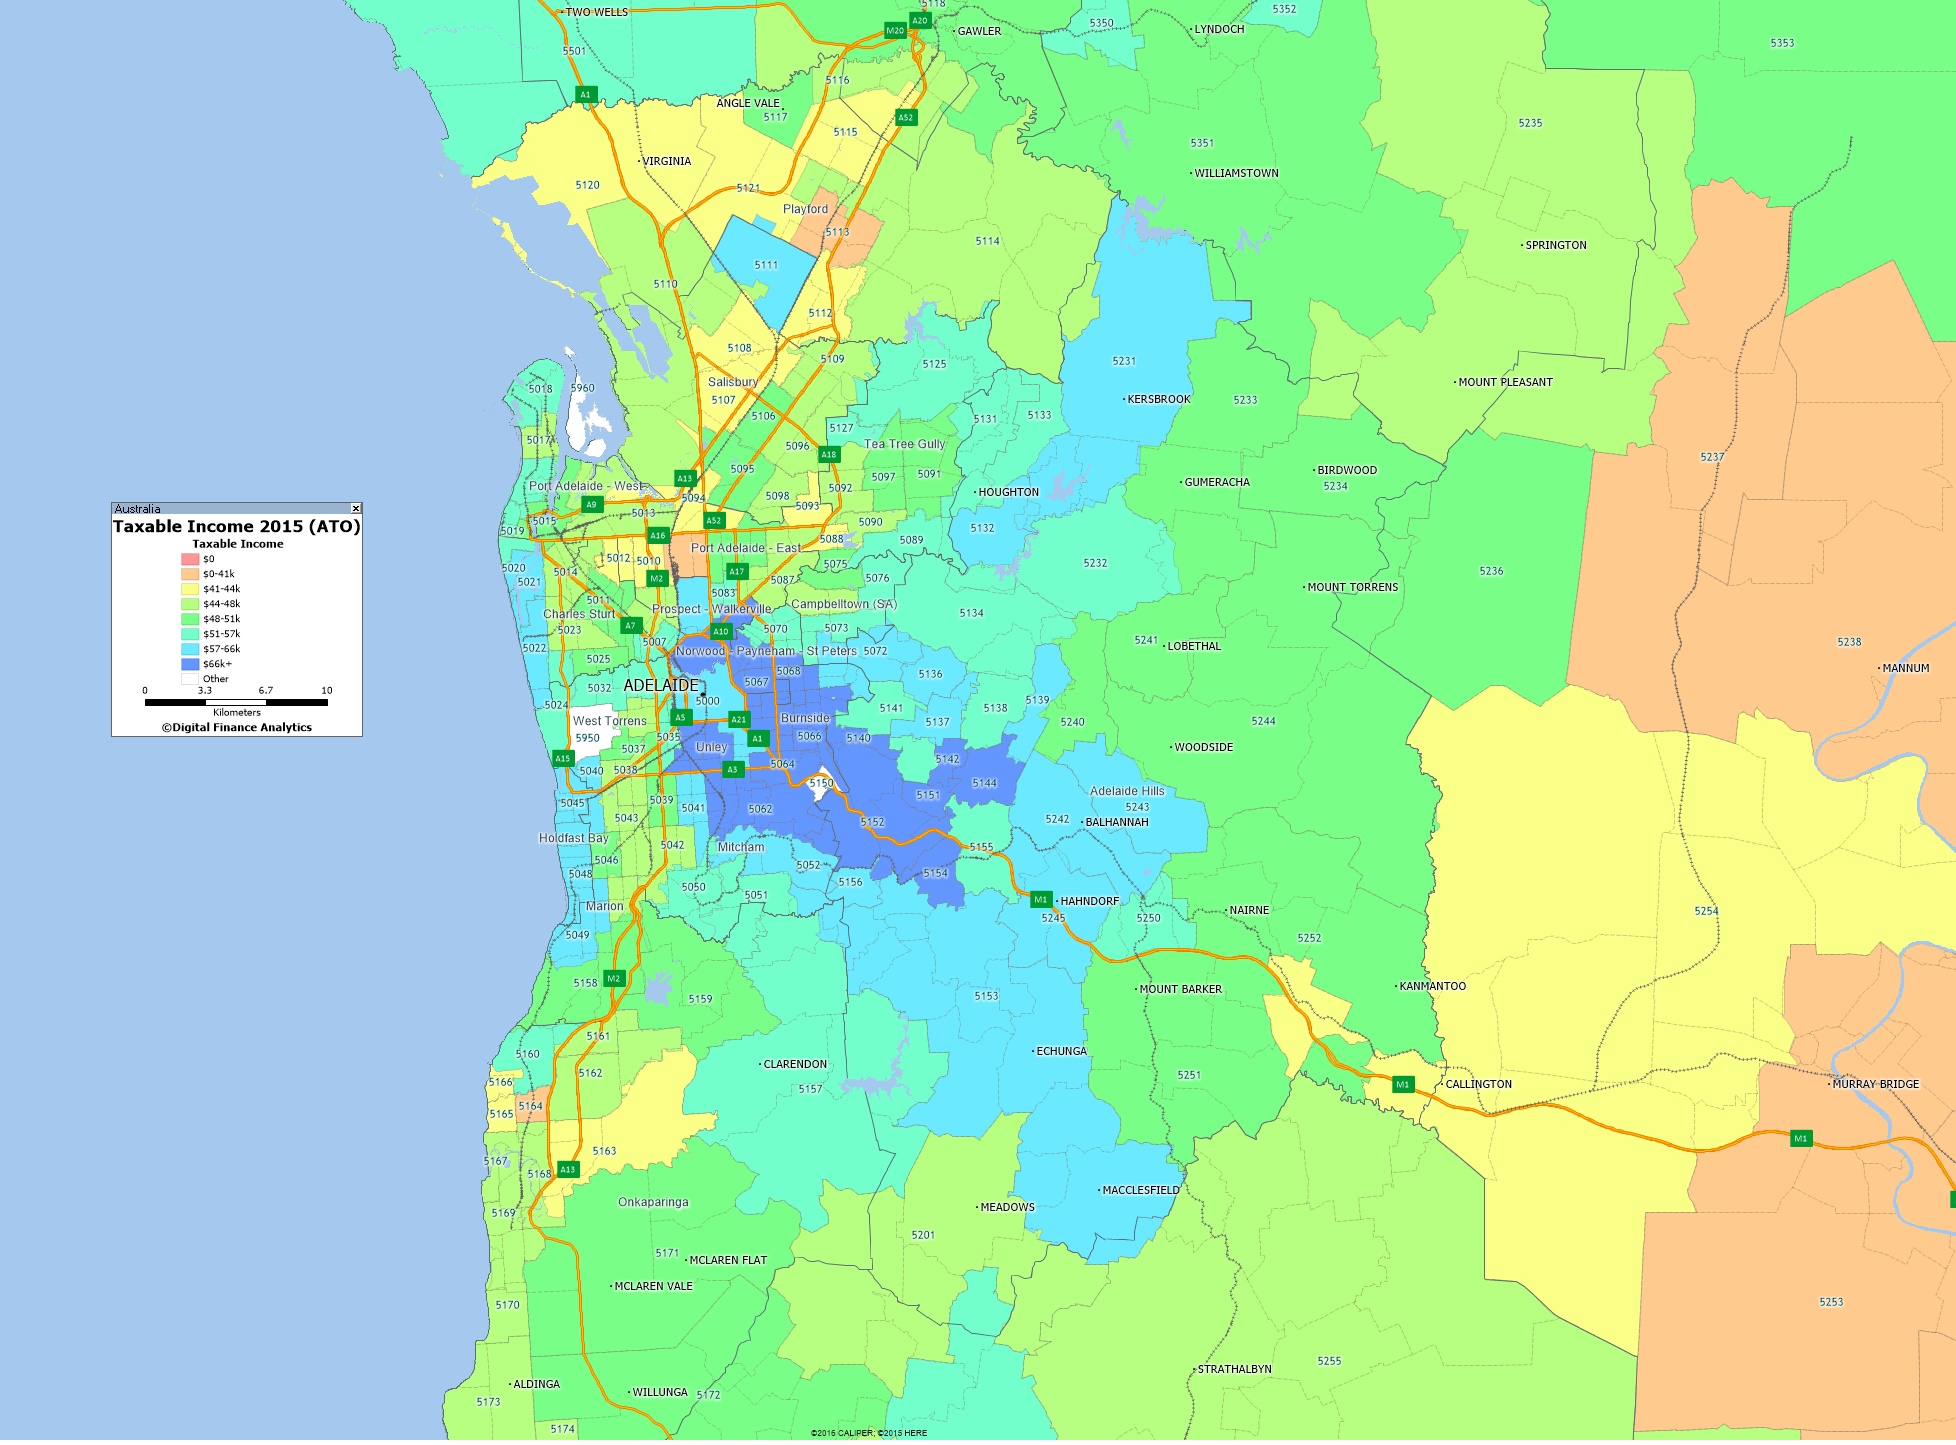
We continue our series on the latest ATO data with a look at Greater Adelaide, using the recently released 2015 taxable income data from the ATO, as a drill down on the all Australia data we previously posted. Blue shows the higher taxable income areas.
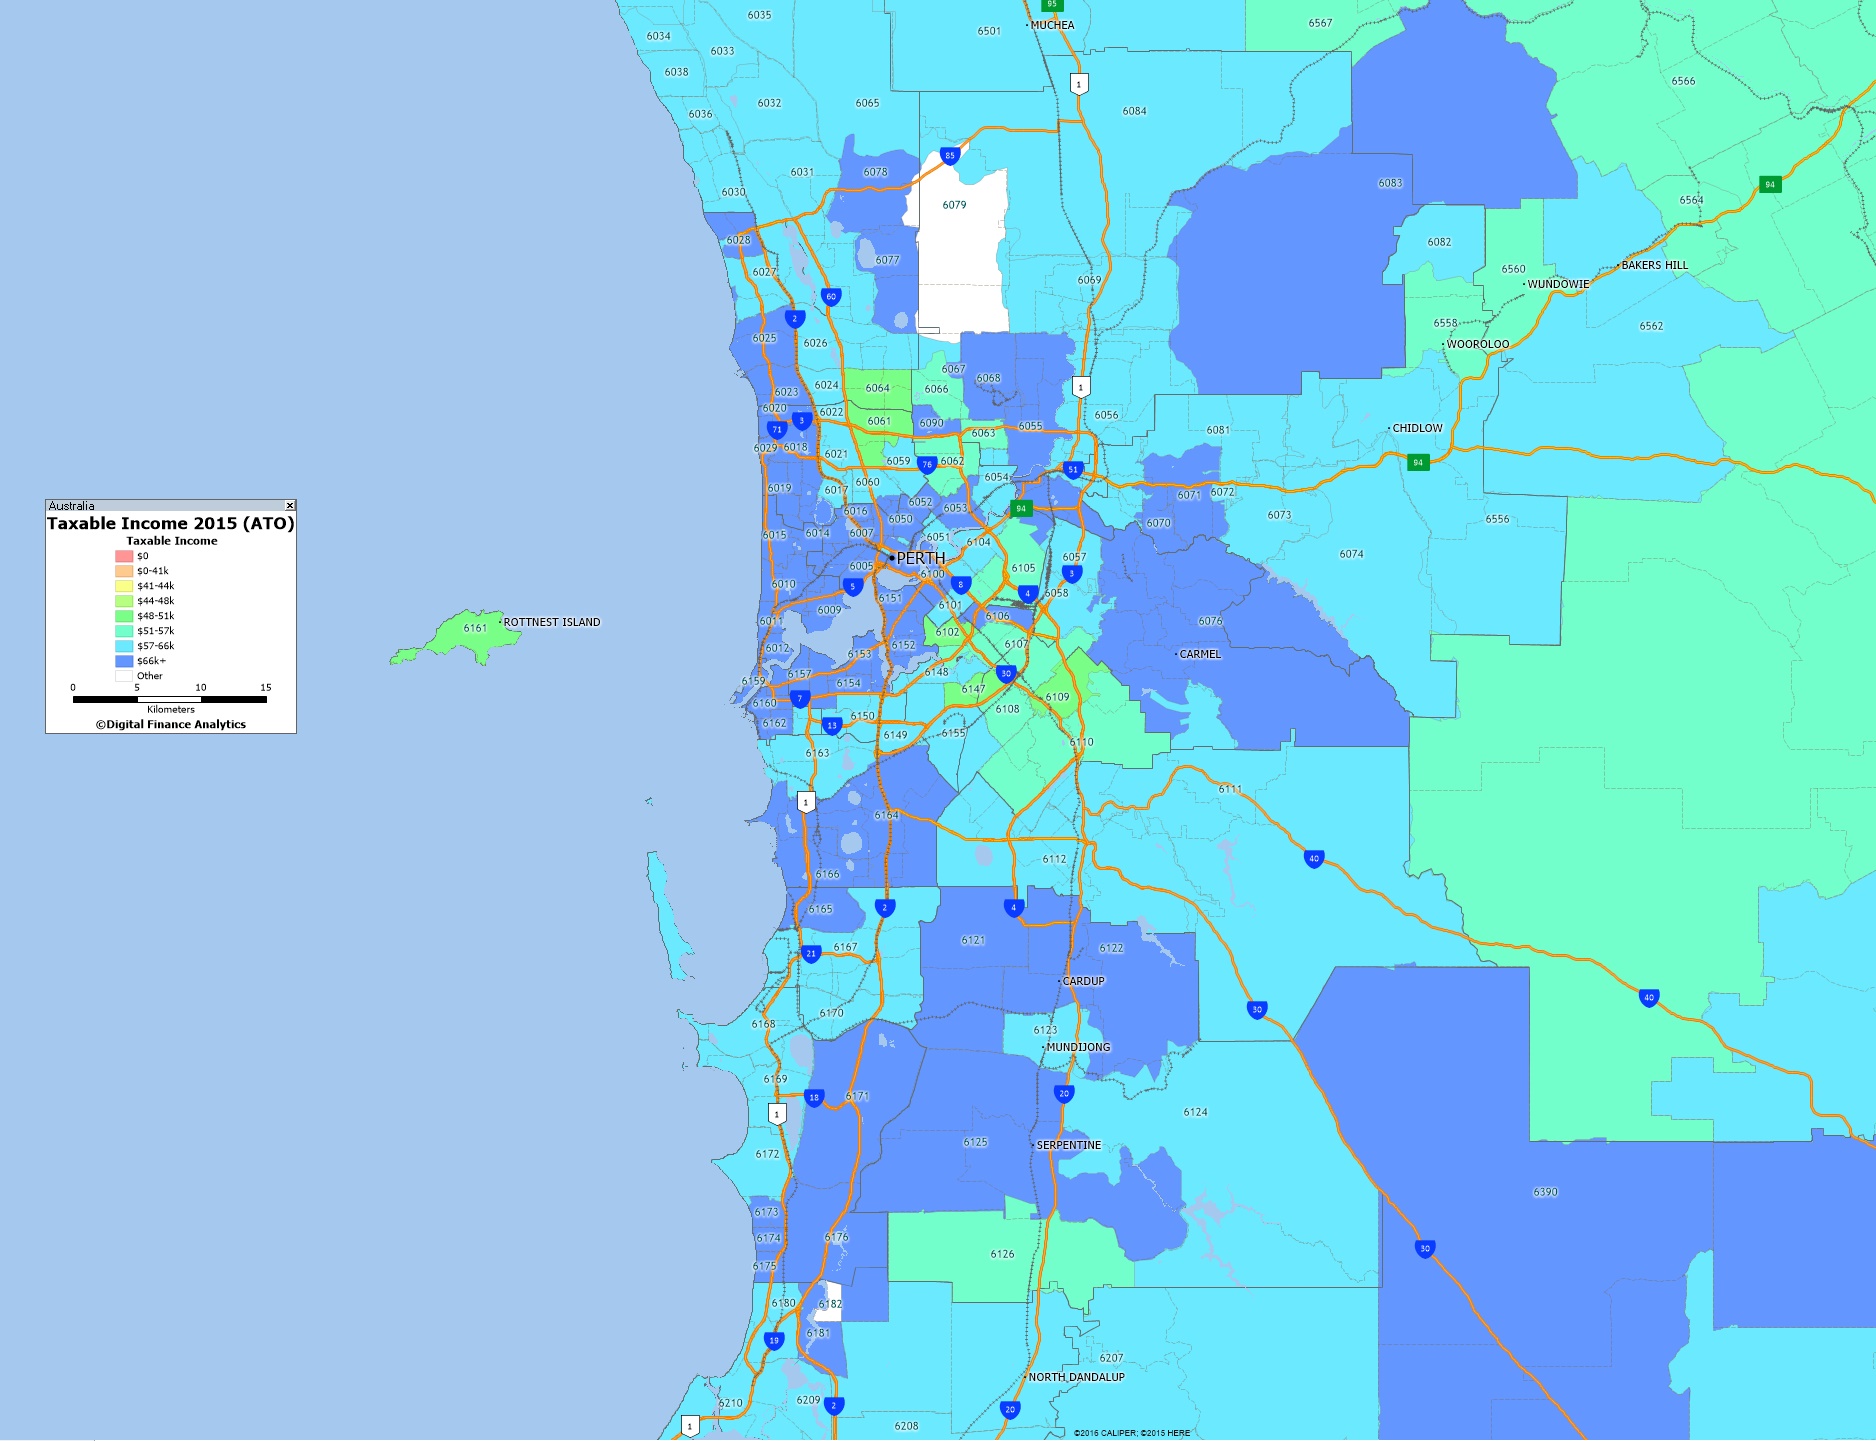
We continue our series on the latest ATO data with a look at Greater Perth, using the recently released 2015 taxable income data from the ATO, as a drill down on the all Australia data we previously posted. Blue shows the higher taxable income areas.
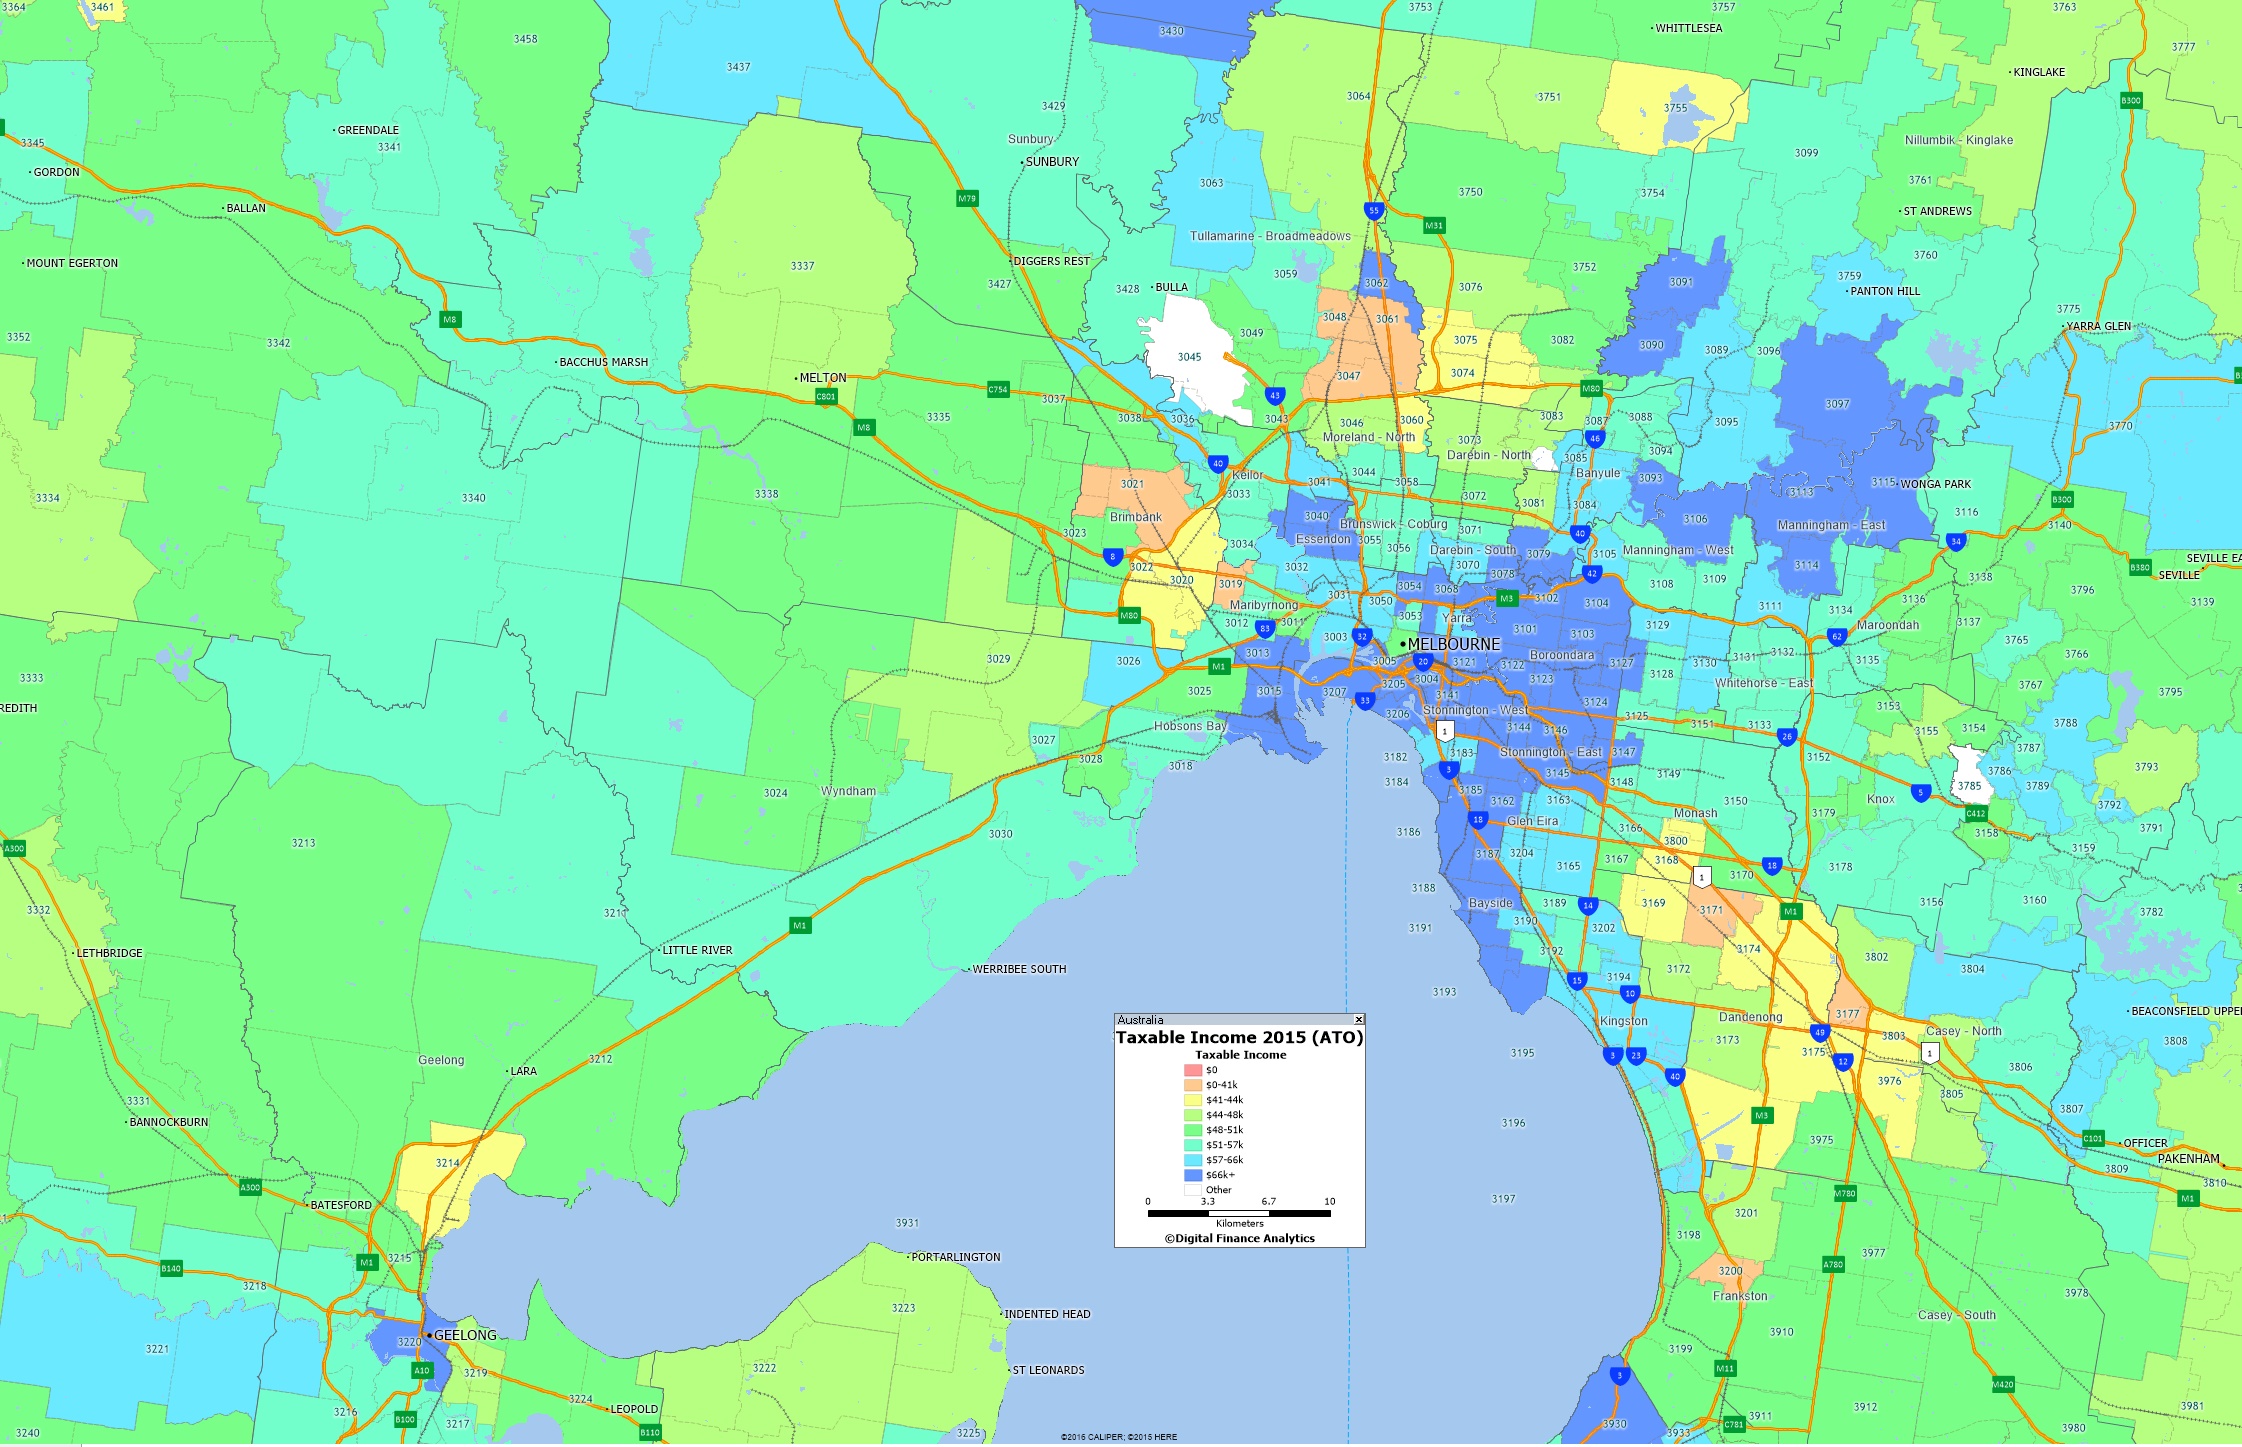
We continue our series on the latest ATO data with a look at Greater Melbourne, using the recently released 2015 taxable income data from the ATO, as a drill down on the all Australia data we previously posted. Blue shows the higher taxable income areas.