Mortgage Stress Update November 2022

In our final update of the year, we incorporate the latest from our surveys as we assess the impact higher interest rates are having on households across the country, based on our rolling 52,000 omnibus survey.

And the news is not good, in that both mortgage stress and rental stress – defined in terms of cash-flow in and out, continues to grow, following the eighth rate hike from the RBA, which was promptly passed on to households by way of higher mortgage rates, (though not reflected to the same extent in higher deposit account rates I might add). There was also a continued rise in average rents, thanks to intense competition, lower supply and leveraged investors. All this set against an average inflation rate expected to hit eight per cent soon.

There are many different definitions out there (from 30% of income, or taxable income; through to underwriting metrics) but we define stress in CASH FLOW terms. If households have more outgoings (excluding one off discretionary items) than income, we define them as stressed. If they have a mortgage, they are in mortgage stress; if renting then rental stress.

Investors with cash flow pressures are identified as stressed investors. We also aggregate the data to estimate total financial stress.  Each expressed as a % of households, and count. The latter is the best measure in our view.

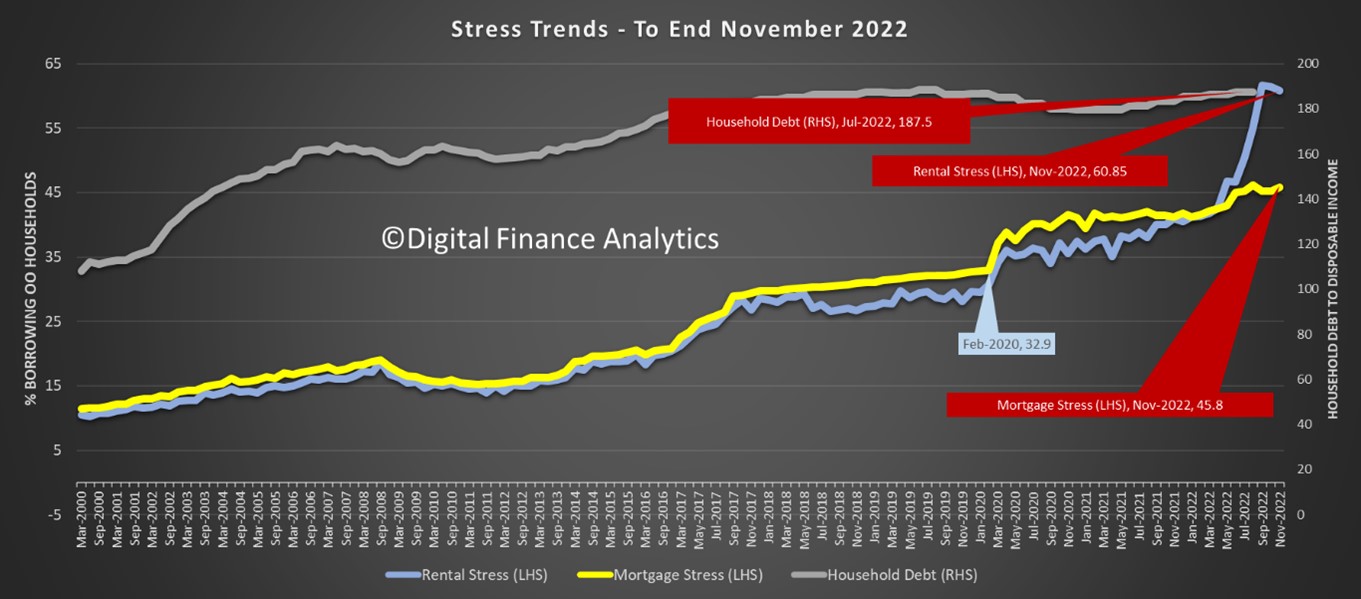
This month, more than 1.75 million households with an owner-occupied mortgage, or 45.8% of borrowers register as stressed, while more than 1.88 million renting households, or 60.85% are stressed. And the household debt to income remains very high, as reported by the RBA.

Analysis By State

In this slide, we highlight in yellow where the proportion of households in stress rose compared with last month, blue means a fall, and no highlight means no change. Tasmania and South Australia are now vying for top spot, both with more than half of household in a negative cash flow situation. WA and Victoria follow on, then NSW and the other states.

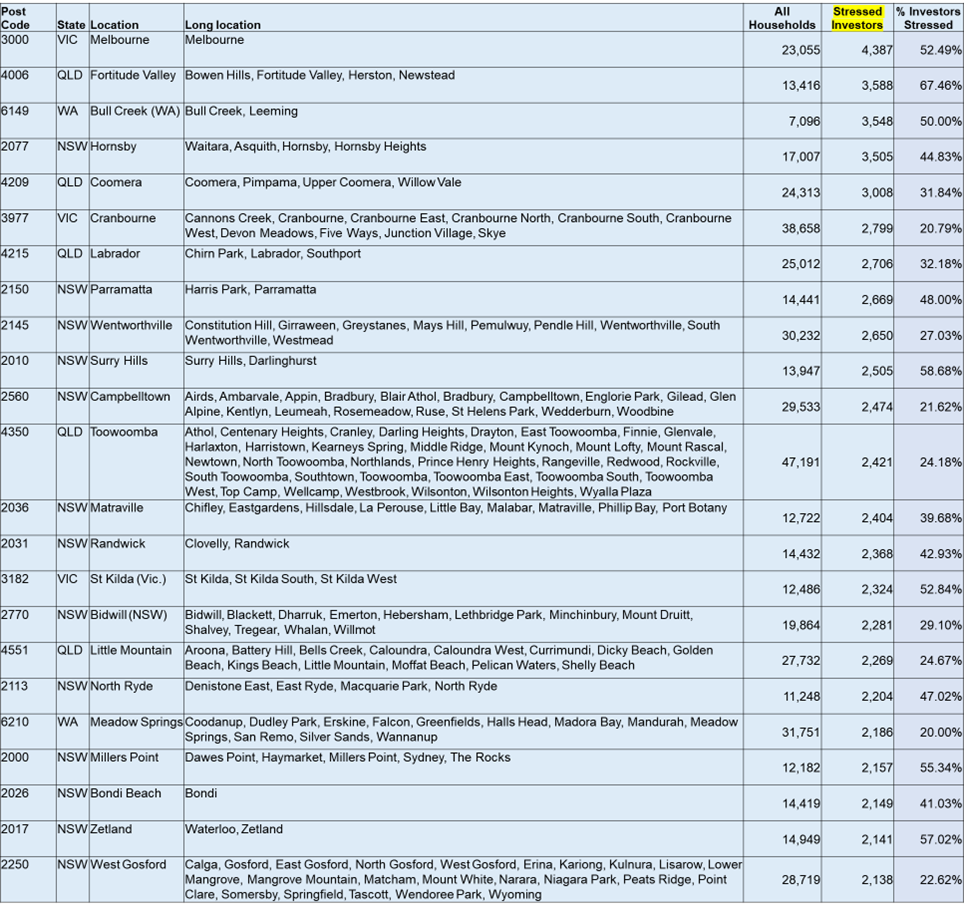
Rental stress is most significant in NSW, ACT and QLD. Investor stress is highest in NSW, because many investors are over-geared and experiencing significant rate hikes. Overall financial stress (an aggregated measure reveals that the state with the highest proportion of household in financial stress is the ACT.

Analysis By Cohort

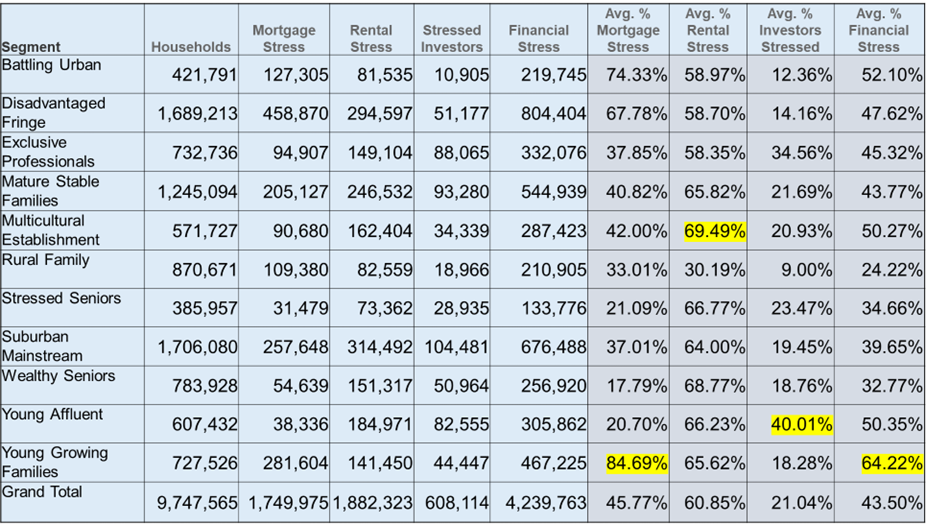
We analyse our data by different household segments or cohorts, as this provides an important lens to understand what is playing out across the country.

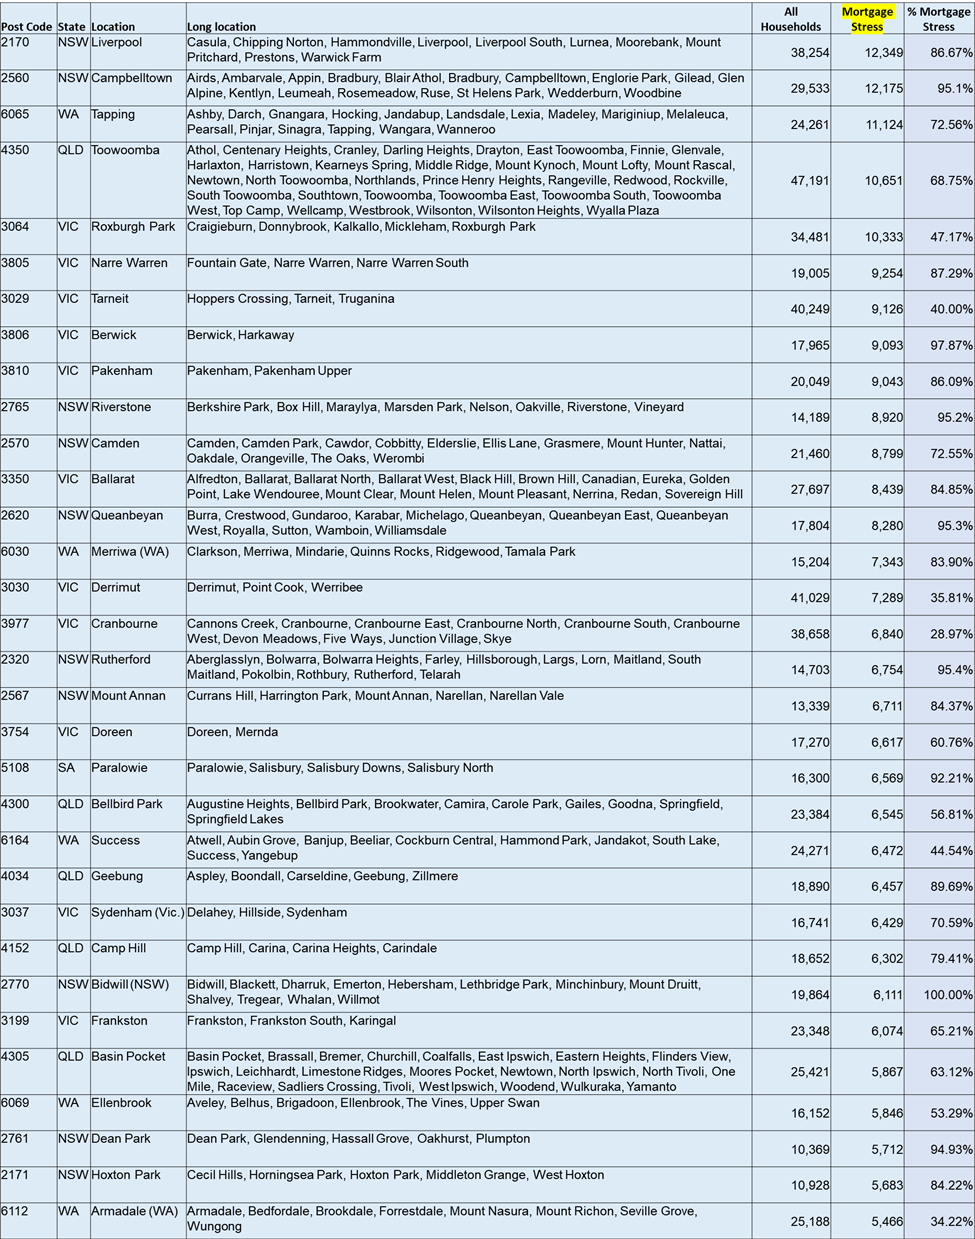
Mortgage stress is highest among Young Growing Families (which include many First Time Buyers) at 84.69%. We see also large counts of those on the Urban Fringe, as well as some more affluent households exposed. Rental stress is highest among first generation migrants at 69.49%. Investor stress is highest among Young Affluent households and overall financial stress is highest among Young Growing Families.

Whilst we continue to see stress building in the high growth suburbs, where many purchasers entered the market when mortgage rates were around 2%, we continue to see pockets of stress across different areas, including some which would generally be regarded as more affluent. Many households in these regions have large mortgages.

It is worth reflecting on the fact that about one quarter of mortgage holders have so far been insulated from mortgage rate rises because they are on fix term loans. However, many of these are due to reset next year, as the RBA showed in a recent report.

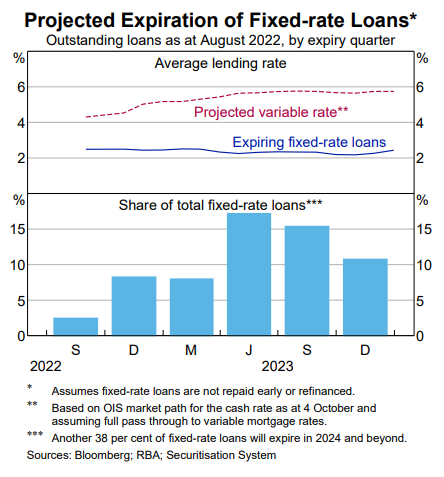
The expectation is that rates will still be high through 2023, and that mortgage delinquencies will rise, at the same time a property prices continue to slide. This is a perfect storm.
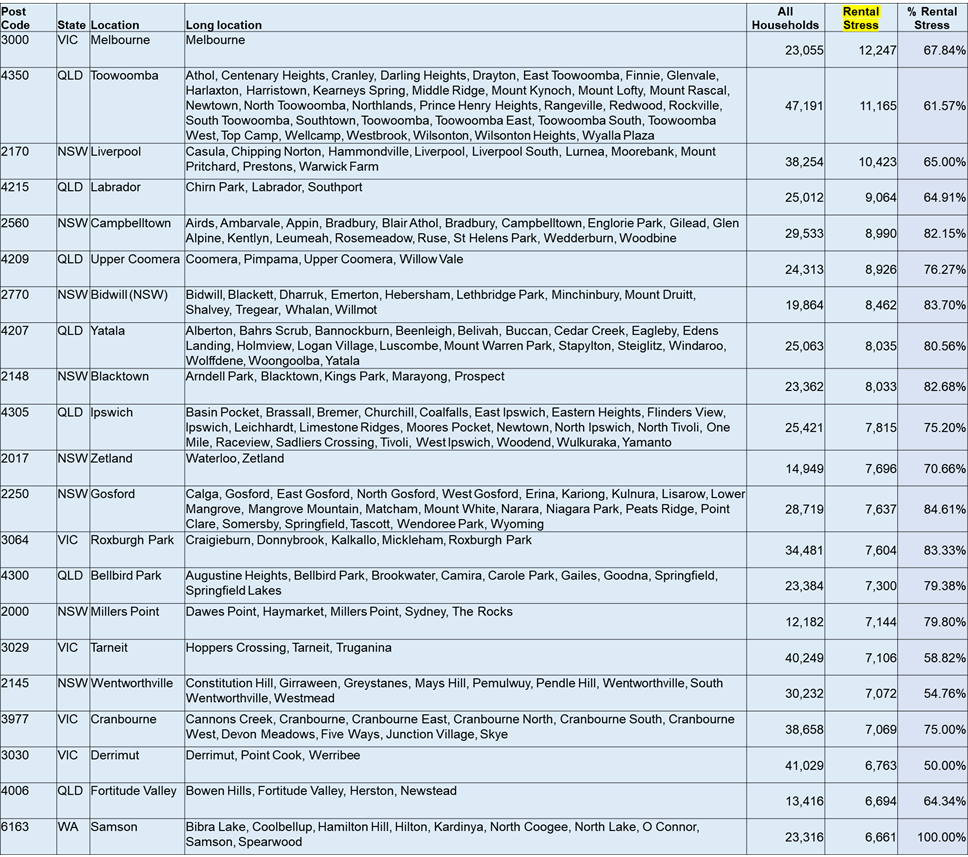
Post Code Analysis

We list the top post codes in each category, based on the COUNT of households.

Conclusions

We do not expect things to ease ahead, as interest rate rises continue to work though, and rental costs rise. Inflation is running hotter than expected, and the RBA still expects a peak around 8% but also staying high through 2023. As a result, households need to get to grips with their cash flow and prioritise important payments, such as mortgage and rental payments, over other perhaps less critical payments.

Households under mortgage pressure would do well to talk to their bank who do run hardship schemes designed to assist in times of crisis.

We also recommend the Government Debt Help Line on 1800 007 007 for people seeking unbiased free advice.

Finally, real wages growth remains below inflation, so households must consider the scenario where true incomes continue to shrink in real terms. As a result, stress levels will remain high for some time yet.

First Take: Mortgage Stress July 2022 [Podcast]

This is a first take on the latest results from our models, which shows a further rise in mortgage and rental stress (defined in cash flow terms) across Australia. We examine the high-level results by state, segment and post code, and also present the latest stress heat maps, which highlight the growth of pressure in the newly developed zones across the country, as well as in some regional communities.

Stress has risen thanks to rising costs of living, increasing mortgage and rents, while real incomes continue to fall. We also include some suggestions as to how to manage stress.

Call the National Debt Helpline on 1800 007 007 for free and confidential advice from professional financial counsellors. But be careful of those offering advice for a fee, it is big business, and many who are struggling are being conned.

Go to the Walk The World Universe at https://walktheworld.com.au/

Digital Finance Analytics (DFA) Blog
First Take: Mortgage Stress July 2022 [Podcast]
Loading
/

The Bank Of Mum And Dad Is Getting Strangled! [Podcast]

We examine the role of the Bank of Mum and Dad, in the light of the latest data. As well as highlighting inter-generational issues, there are pressures on both parents and their kids. And if you do not have “wealthy” parents the chances of getting into the property market is diminished significantly.

Go to the Walk The World Universe at https://walktheworld.com.au/

Digital Finance Analytics (DFA) Blog
The Bank Of Mum And Dad Is Getting Strangled! [Podcast]
Loading
/

DFA Live Q&A: HD Replay Household Stress And Scenarios [Podcast]

This is an edited version of our latest live Q&A as I discuss the latest from our surveys and models, as we look at the latest mortgage stress and scenarios. You can ask a question live – down to a specific post code.

Original live show here: https://youtu.be/CCIym9IPamk with chat replay.

Go to the Walk The World Universe at https://walktheworld.com.au/

Digital Finance Analytics (DFA) Blog
DFA Live Q&A: HD Replay Household Stress And Scenarios [Podcast]
Loading
/

Australia’s Crypto Love Affair… [Podcast]

We discuss the latest Independent Reserve household survey on crypto, which highlights the momentum in Australia with the CEO, Adrian Przelozny.

CONTENTS

0:00 Start
1:42 Awareness
2:31 Adoption
4:20 State Variations
5:30 Age Distribution and Profit
7:30 Amount Invested
10:00 Trust And Confidence
11:15 Future Price Expectations
13:15 COVID Impact
14:20 Gender Divide
16:16 Superannuation and Crypto
18:45 Bitcoin V Ethereum
22:00 CDBC and Crypto
25:38 Close

Go to the Walk The World Universe at https://walktheworld.com.au/

Digital Finance Analytics (DFA) Blog
Australia's Crypto Love Affair... [Podcast]
Loading
/

Property Transaction Intentions By Segment

Today we continue the discussion of the latest findings from our rolling household surveys. Yesterday we over-viewed the segments, and trends, and looked at relative demand. Today we go deeper. The accompanying video explains our findings in more detail.

Want To Buy.

The 1.6 million Want To Buys are not able to progress because finance is not available (37%). This is been a growing issue in recent times, though has eased back, as pressure from cost of living (25%) and high home prices (25%) bite. Many therefore remain in rental property or in other living arrangements.

First Time Buyers.

There have been some changes in the drivers of purchase by the 350,000 first time buyers. Needing a place to live is high on the agenda (29%), but the expectations of future capital growth have dropped to 15%, while greater security remains around 15%. There is a rise in the use of First Owner incentives (13%).

However, availability of finance remains a significant barrier (39%) – though it dropped a little in response to lower rates and changed underwriting standards, along with high home prices (26%) and costs of living (24%). Fear of unemployment is on the rise (5%).

There has been a reduction in demand for units relative to houses, partly in response of the coverage of poor quality high-rise construction. We expect this to continue.

Refinancers.

There is a significant demand from those seeking to refinance an existing loan. The main aim is to reduce monthly repayments (48%), a factor which have become more important as financial pressures and mortgage stress build, helped by lower rates (18%). Around 18% are seeking to withdraw capital to repay other debts or improve their finances. Fixed rates are becoming less attractive (9%). Poor lender service is not a significant factor; price is.

Up-Traders.

Households looking to buy a larger property are driven by the desire for more space (41%), job move (16%), life-style change (20%), or property investment (22%), the latter dropping from recent highs of 43%.

Down Traders.

Those seeking to down size are mainly driven by the need to release capital, often for retirement, or supporting the “Bank of Mum and Dad” (50%). Around 30% are driven by increased convenience – either by changing location or to a more manageable property. A switch to an investment property has faded to 5% from a peak of 22% in 2017.

Property Investors.

Tax efficiency remains the strongest driver for investors (45%), while appreciating property values have dropped from more than 30% down to 15% now. Low finance rates have risen to 12% thanks to the recent changes and better returns than bank deposits registered at 25%. So investors believe the tax breaks make investing a reasonable proposition (though many would find in net cash flow terms they are underwater, without significant capital gains).

The main barriers are difficulty in obtaining finance (40%), have already bought (30%), and changes to regulation (15% – and falling now). Fears of interest rate rises have dropped from 11% in March 2019 to 1% now and the local and international economic scene has changed.

In the accompanying video we look in more detail at the differences between Solo Investor, Portfolio Investor and Super Investor motivations.

Finally, its worth noting that across the segments, when choosing a mortgage, price remains the main driver, though some segments rate other features a little more significant than others.

Prospective use of mortgage brokers also varies across the segments, with refinancers and first time buyers the most likely to use an adviser.

So, in summary, households are reacting to the changing market and economic conditions. However there is little here to suggest a significant upswing in demand.

The Property Supply Demand Disequilibrium

Digital Finance Analytics will be releasing the results from our rolling household surveys over the next few days. This is the first in the series.

These are the results from our 52,000 households looking at property buying propensity, price expectations and a range of other factors.

We use a segmented approach to the market for this analysis, and in our surveys place households in one of a number of potential segments.

Want To Buys: households who would like to buy, but have no immediate path to to purchase. There are more than 1.5 million households currently in this group.

First Timers: first time buyers with active plans to purchase. There are around 350,000 households in this segment.

Up-Traders: households with plans to buy a larger property (and sell their current one to facilitate the up-sizing. There are around 1 million households in this group.

Down Traders: households wishing to sell and down size, sometimes buying a smaller property at the same time. There are around 1.2 million households in this group.

Some of these households will hold investment property as well. We categorise investors into one of two groups.

Solo Investors: households with one or two investment properties. There are about 940,000 of these.

Portfolio Investors: households with more than two investment properties. There are around 170,000 of these.

Finally we also identify those who are planning in refinance existing loans, but are not intending to buy or sell property – flagged as Refinancers, and those with no plans to buy, sell or refinance – flagged as Holders.

It is the interplay of all these segments which drives the property market and demand for mortgages.

Around 72% of households are property active – meaning they want to buy, sell, or own property. More than 28% are property inactive, meaning they rent, live with parents or in other arrangements. Our surveys track all household cohorts. A greater proportion are falling into the inactive category.

Intention To Transact Is Rising (From A Low Base)

We ask about households intentions to transact in the next 12 months, and whether they will be buy-led (seeking to purchase a property first) or sell-led (seeking to sell a property first). (Click on Image To See Full Size).

Property investors are still coy (hardly surprising given the fall in capital values, the switch to P&I loans and receding rentals. But Down Traders, First Time Buyers and Refinancers are showing more intent.

We will look at the drivers by segment in a later post.

But the Buy Side and Sell Side Analysis is telling

Those seeking to buy are being led by First Time Buyers and Down Traders.

Those looking to sell are being led by the Down Traders, and Property Investors. In fact this suggests we will see a spike in listings as we move into spring.

Our equilibrium model suggests that currently supply is not meeting demand (adjusted for property types and locations) in a number of prime Sydney and Melbourne locations, within 30 minutes of the CBD. But beyond that demand is below current supply, and more is coming.

On this basis, we expect to see some local price uplifts, but not a return to the rises a couple of years back. What is clear, is that the property investment sector continues to slumber, and Down Traders are getting more desperate to sell.

Finally, today demand for more credit is coming from Up-Traders, First Time Buyers and Refinancers. Not Investors.

And price expectations seem to be on the improve, driven by investors. But it is still lower than a couple of years ago.

Next time we will dive into the segment specific drivers.

The Interest Only To P&I Problem

Analysis released today by Digital Finance Analytics reveals that in the coming 12 months around 124,000 interest only loans will need to be switched to principal and interest loans. This is drawing data from our rolling household surveys. This translates to an estimated value of $47 billion, and represents a significant proportion of all IO loans coming up for review. Of these 97.5% are for investment properties.

The reason why households are converting varies, with around 27% deciding to switch, while 67% were persuaded by their lender. There are state variations. NSW and WA had the highest proportion of “forced” moves.

The average repayments will rise by 25.6%, with the highest in NSW at 31.6%.

We then asked about what steps owners would take to cover the extra costs. On average 11.5% said they could cover form other income, from higher rents 4.5%, from selling other property 26.7%, and the remaining will require extra employment, either by way of extra hours, or from additional jobs. Again there are state differences.

In terms of extra jobs, on average 53% of the extra work will be taken by the primary worker, while 47% will be taken by a second family member (often the spouse). It varies across the states.

This of course is all predicated on more work being available. Perhaps this is one reason why mortgage delinquencies are rising?