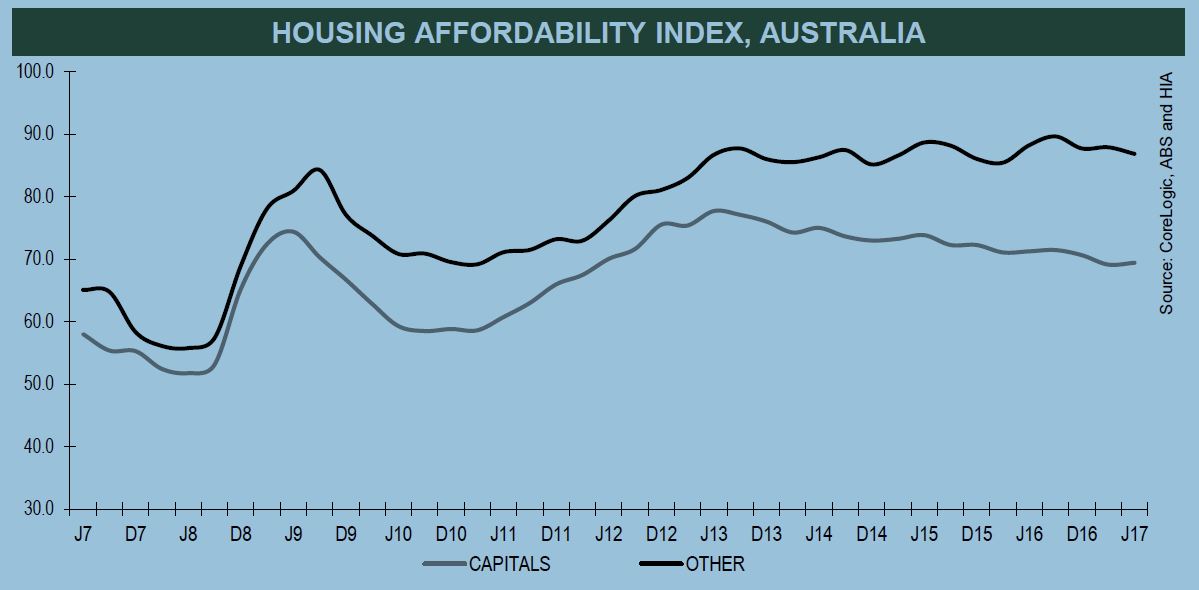
The Bank of mum and dad is growing the divide between those who can and those who can’t buy property. The latest Adelaide Bank/REIA Housing Affordability Report shows affordability is worsening, just as new research from Mozo shows increasing numbers of parents are stepping in to help their children get a foot on the property ladder. This chimes well with our own Bank of Mum and Dad research published recently.
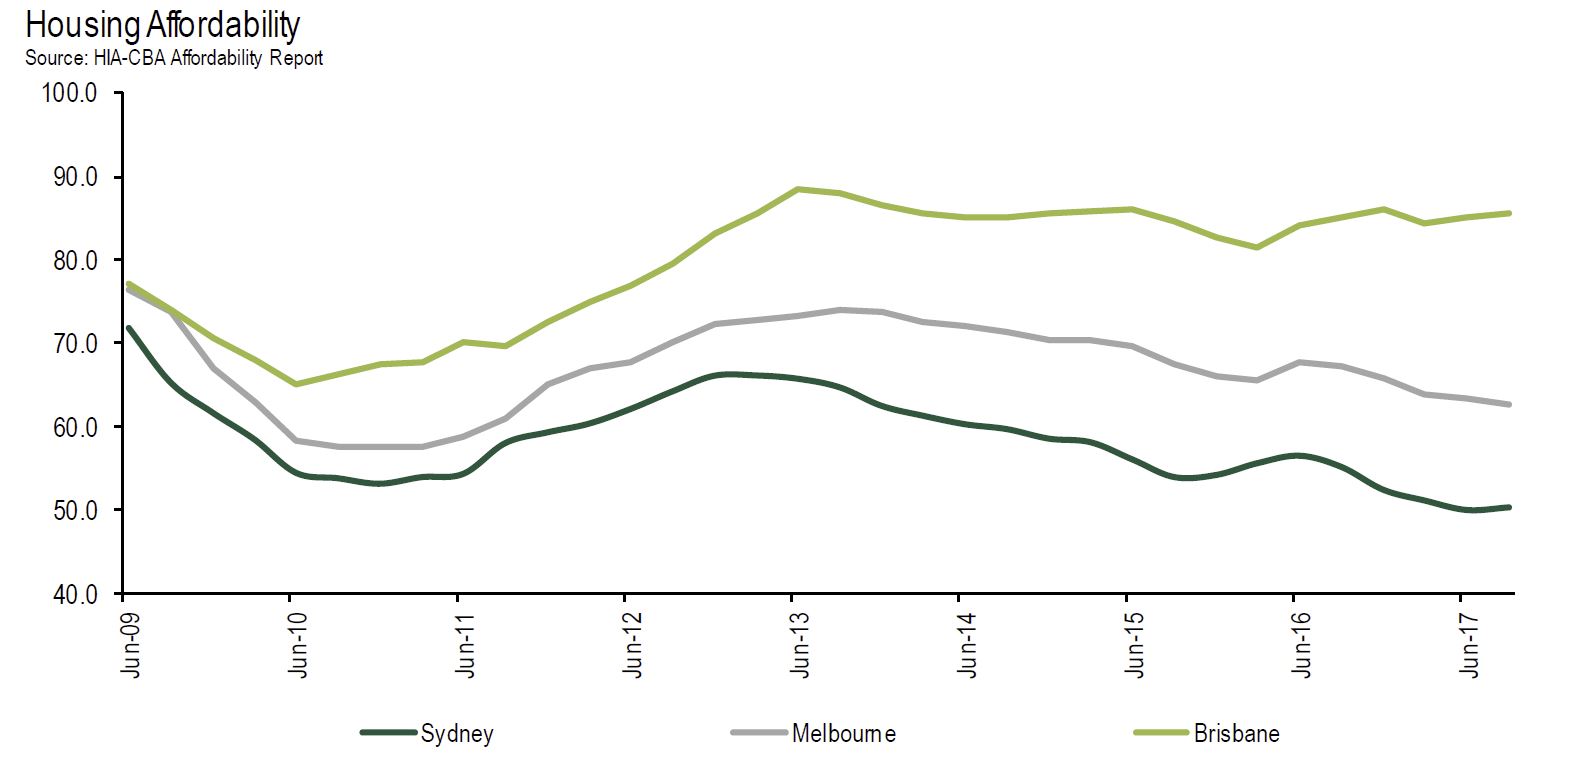
The latest Adelaide Bank/REIA Housing Affordability Report shows that buying a house became even less affordable during the June quarter.
The deterioration in affordability comes as research from Mozo.com.au shows almost a third of all parents are helping their children to buy their first home.
The Adelaide Bank/REIA Housing Affordability Report shows the proportion of median family income required to meet average home loan repayments increased by 0.2 percentage points to 31.4 per cent.
The share of first-home buyers in the market is at its highest level since 2010
There is a bright spot in the data though. The number of loans to first-home buyers increased by 14.0 per cent, with increases in all states and territories except Tasmania.
“First home buyers now make up 14.3 per cent of total owner occupied housing,” said REIA President Malcolm Gunning.
Darren Kasehagen, Head of Business Development at Adelaide Bank, said, “A slight increase in housing affordability shouldn’t overshadow the welcome news that the number of first home buyers increased by 14.0 per cent during the quarter.”
The rate of first-home buyers has been dropping steadily over the last five years, but appears to have stabilised over the past 18 months, said Gunning.
Rental affordability improved
In the June quarter, the proportion of median family income required to meet rent payments declined by 0.6 percentage points to 24.3 per cent. The improvement was recorded across all states and territories except in Tasmania and the Australian Capital Territory, said Gunning.
Rental affordability is the best it has been since the March quarter 2010, according to Gunning.
The bank of mum and dad is stepping in, expanding the divide between those who can afford to get into the market and those who can not
With it getting harder for first-home buyers to get into the property market independently, the ‘bank of mum and dad’, as lending from parents has become known, has ballooned to being the fifth largest home lender in Australia, sitting behind, ANZ, the Commonwealth Bank, NAB and Westpac.
New research from financial comparison site, Mozo.com.au, shows 29 per cent of parents, or more than 1 million families, help their children purchase a home. Around $65.3 billion has been lent to children, with 67 per cent of parents not expecting any repayment.
The average amount lent to children is $64,206.
“For many first homebuyers, it takes years to scrimp and save for a home deposit and all the while house prices are continuing to skyrocket, making the great Australian dream exactly that – a dream,” said Lamont.
Australian property prices have risen 618 per cent in the last 30 years; wages growth hasn’t kept pace
“With Australian property prices rising by a staggering 618 per cent over the past 30 years and wages failing to keep up, many mums and dads across the country feel they have no choice but to dip into their own savings to help their children get a foot on the property ladder.”
Lamont said by dipping into their own savings and helping out their children, parents are actually shaping the property market.
“We knew that mums and dads were helping their children out, but the reality is they are actually changing the face of the Australian property market,” she said.
“We expect the Bank of Mum and Dad to remain a major player in the property market for years to come, and it’s likely to cause a growing divide between the younger generation who have had assistance and those who have not.”
“Those young Australians who don’t have access to parental assistance may have to shelve the property dream and consider other ways to invest their money and build wealth,” said Lamont.
“The bank of mum and dad is proof of family generosity, but also points to a broken property market for younger generations.”
- NSW is the most generous state for parental lending with an average lend of $88,250 per family, totalling $32.7 billion.
- VIC and SA rank second equal, lending around $63,000 per family.
- ACT and NT are the least generous, lending $20,083 and $15,000 per family respectively.
The most popular ways for parents to help their kids get a foot on the property ladder is by allowing their children to live at home rent free. Other ways parents help is by acting as a guarantor, helping with repayments, or buying property on behalf of or as a partner with the child.
How Australian parents are helping their kids onto the property ladder

How Australian parents are financing their contribution to their children

Data from the Adelaide Bank/REIA Housing Affordability Report from across the nation
Victoria
The number of loans to first home buyers in Victoria increased by 10.0 per cent in the June quarter. In Victoria, first home buyers now make up 21.1 per cent of the state’s owner-occupier market. Rental affordability improved for the quarter with a decrease of 0.7 per cent of income required to meet median rents.
New South Wales
The proportion of family income required to meet loan repayments is 6.6 per cent higher than the nation’s average. New South Wales remains the least affordable state or territory in which to buy a home. Of the total number of Australian first home buyers that purchased during the June quarter, 18.2 per cent were from New South Wales. First home buyers now make up only 13.0 per cent of the state’s owner-occupier market – the lowest level across the nation. Rental affordability improved for the quarter with a decrease of 0.4 per cent of income required to meet median rents.
Queensland
The proportion of income required to meet home loan repayments increased to 27.2 per cent, a 0.5 percentage point increase over the quarter. Of all Australian first home buyers over the quarter, 25.4 per cent or 6003 were from Queensland while the proportion of first home buyers in the State’s owner-occupier market was 25.3 per cent. Rental affordability improved slightly for the quarter with a decrease of 0.7 per cent to 23.0 per cent of income required to meet median rents.
South Australia
South Australia recorded a decline in housing affordability with the proportion of income required to meet monthly loan repayments increasing to 26.8 per cent, an increase of 0.6 percentage points over the quarter but a decrease of 0.1 percentage points compared to the June quarter 2016. In the national breakdown, 5.8 per cent of first home buyers were from South Australia while the proportion of first home buyers in the State’s owner-occupier market recorded an increase of 12.6 per cent. Rental affordability improved by 0.7 percentage points.
Western Australia
The number of first home buyers in Western Australia increased by 16.0 per cent over the quarter and by 3.8 per cent compared to the same time last year. 17.5 per cent of all Australian first home buyers were from Western Australia. Housing affordability declined with the proportion of income required to meet loan repayments increasing to 23.6 per cent or 0.2 percentage points over the quarter but a decrease of 0.3 percentage points year on year.
Tasmania
Housing affordability in Tasmania declined with the proportion of income required to meet home loan repayments increasing to 23.9 per cent, an increase of 0.3 percentage points over the quarter and an increase of 0.2 percentage points year on year. Rental affordability in Tasmania improved with the proportion of income required to meet median rents decreasing to 25.8 per cent, a 0.8 percentage point drop over the quarter but an increase of 0.8 percentage points year on year. First home buyers in Tasmania decreased by 3.3 per cent over the quarter and by 17.6 per cent compared to the same quarter last year.
Australian Capital Territory
The number of loans to first home buyers in the Australian Capital Territory increased to 570, an increase of 49.6 per cent over the quarter and an increase of 21.8 per cent compared to the June quarter 2016. Housing affordability in the Australian Capital Territory improved with the proportion of income required to meet home loan repayments decreasing to 19.8 per cent, a 0.3 percentage point drop over the quarter and a decrease of 0.7 percentage points compared to the same quarter last year. Rental affordability remained stable. The proportion of income required to meet the median rent remained at 17.9 per cent.
Northern Territory
Housing affordability in the Northern Territory improved with the proportion of income required to meet loan repayments decreasing to 20.3 per cent in the June quarter or 0.8 percentage points. This was a decrease of 1.8 percentage points year on year. Rental affordability in the Northern Territory also improved with the proportion of income required to meet the median rent decreasing to 23.1 per cent or 0.6 percentage points over the quarter or a decrease of 2.0 percentage points compared to the June quarter 2016.
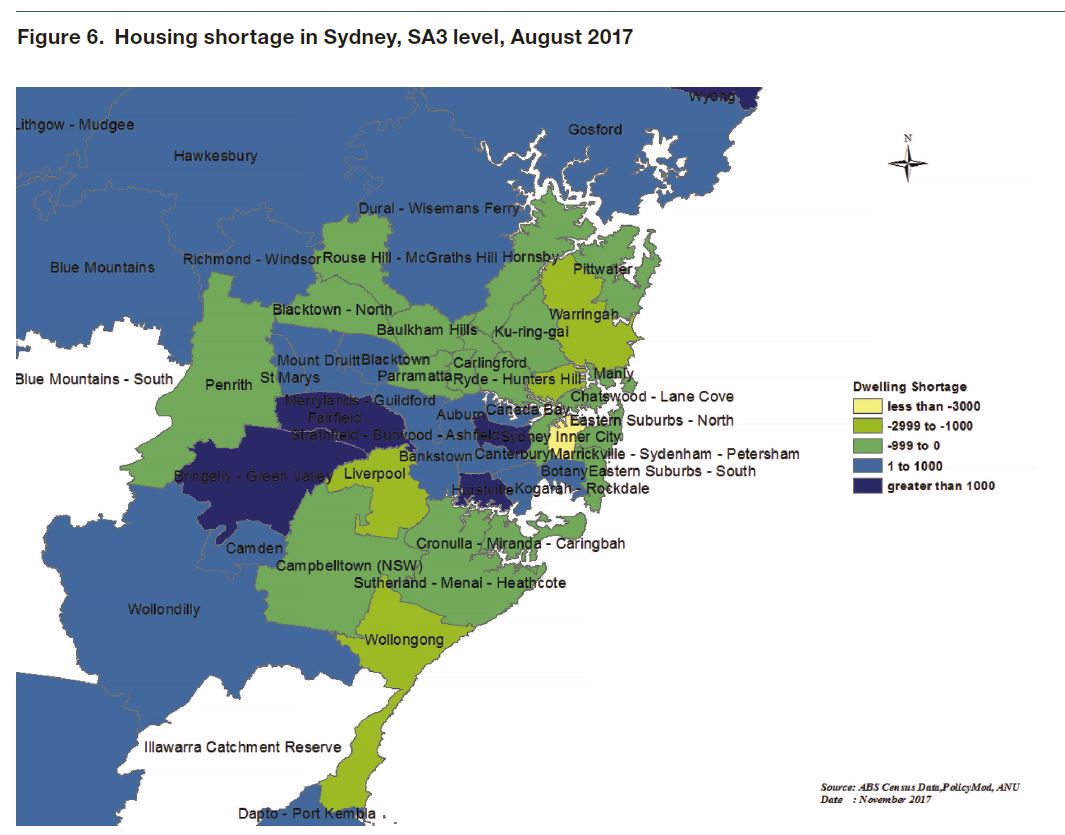
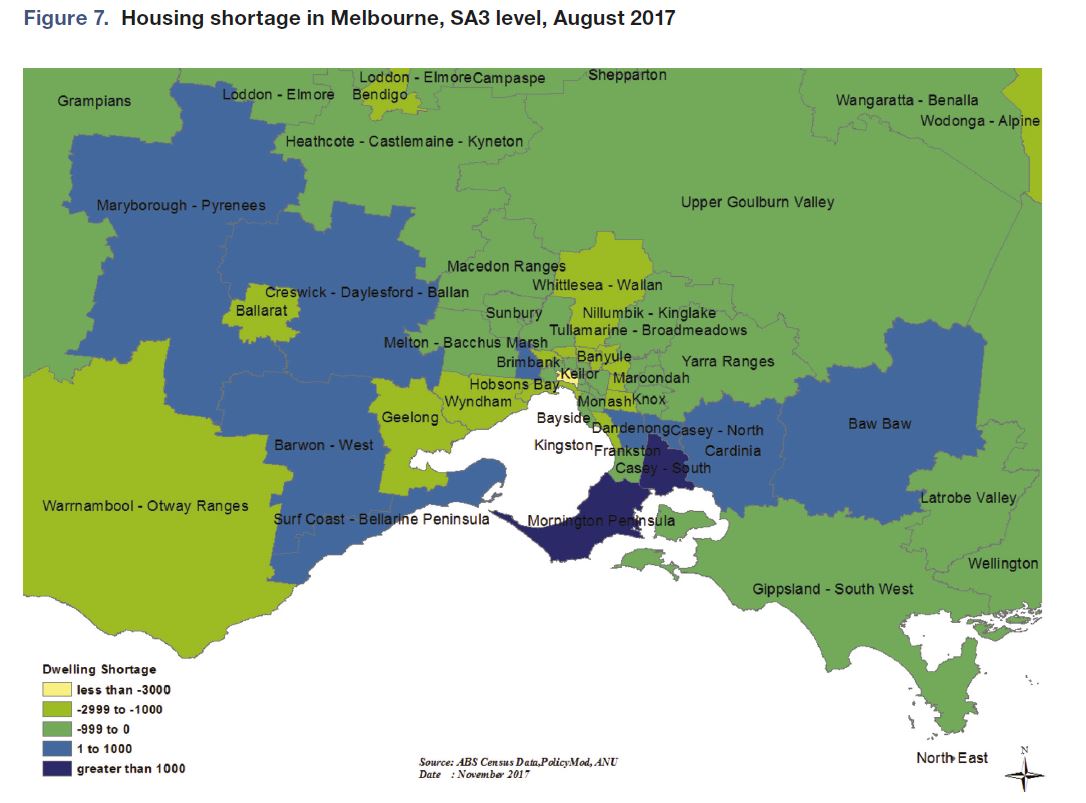
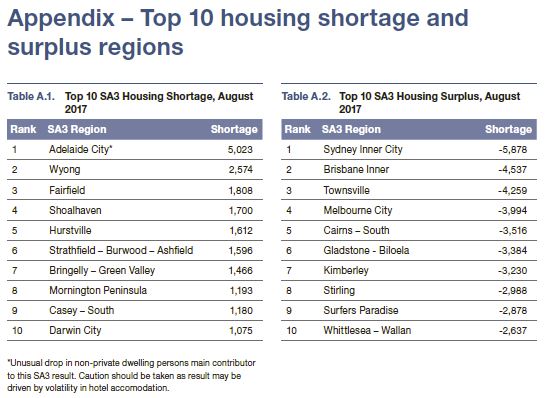 Over the year to June 2017 Australia built nearly 220,000 dwellings. Construction rates of units and other attached housing have more than doubled this decade, with around 103,000 units, townhouses and terrace houses completed in the latest financial year. Most of these completions are high-rise units in Australia’s capital cities (which is why the average home size is falling). Detached house completions have also trended up in recent years, but the growth has been more modest. This paper accounts for differential in the type of stock being built, with detached housing supporting a greater number of persons per dwelling than units and townhouses.
