The Better Affordability Silver Lining To The Home Price Clouds

The HIA Housing Affordability Index saw a small improvement of 0.2 per cent during the December 2017 quarter indicating that affordability challenges have eased thanks to softer home prices in Sydney where they are now slightly lower than they were a year ago. This makes home purchase a little more accessible, particularly for First Home Buyers. [DFA Editors note: though offset by tighter lending criteria now].

The HIA Affordability Index is produced quarterly and measures the mortgage repayment burden as a proportion of typical earnings in each market. A higher index result signifies a more favourable affordability
outcome.

Shane Garrett, HIA Senior Economist said

Softer home prices in Sydney contributed to improved housing affordability during the final quarter of 2017.

Affordability conditions in Sydney are still more challenging than any other city. After Sydney, Melbourne has the second highest mortgage repayment burden.

It is often overlooked that affordability conditions are favourable in the markets outside of Sydney and Melbourne. Housing prices are more affordable in the other six capital cities today than has typically been the case over the past 20 years – primarily due to very low interest rates. Housing affordability is still a very acute problem.

To win the affordability battle, governments need to make tough decisions on reducing the tax burden on new home building, speeding up the planning process and releasing new residential land in a more timely fashion.

To Buy, Or Not To Buy, That IS indeed the Question

We get a steady flow of questions from those who read our research, or follow our posts, but one question, more than any other we get asked is –  Should I Buy Property Now? Many cite the real estate industry claims that now is a great time to buy – but is it really? Today we are going to explore this question, but with a caveat. This is NOT financial advice, and is simply my opinion, based our own research and surveys. Your mileage may vary. The market is different across states and locations.

Watch the video or read the transcript.

But it is an important question given that home prices appear to have reached something of a peak, and may be sliding in some areas; housing is Australia is unaffordable, as the recent Demographia report showed; banks are tightening their lending standards under regulatory pressure; net rental streams are looking pretty stressed; many households are under severe financial pressure, and mortgage interest rates are likely to rise.

In fact, we have a generation of home buyers and prospective home buyers who have only ever seen home values rise, and if you are in the property owning system, is has become a significant source of wealth creation, amplified if you are a property investor, and assisted by ultra-low interest rates, tax breaks and other incentives.  But will the good times continue to roll? Not necessarily.

So to decide if now is a good time to buy, consider these questions.

First, why do you want to buy a property? Up until recently, our surveys have shown the number one reason to buy was capital appreciation and wealth building, with finding somewhere to live a poor second. But now, if you are wanting to buy to grow wealth, we say be careful, as the market dynamics are changing, and its likely prices will slide. Also there may be changes to negative gearing under a Labor government, and property investment mortgage rates are likely to rise, while rental streams are not, so more investment properties, on a cash flow basis will be under water. At the moment there are much better returns from the buoyant stock market, though of course that may change. Remember that prices crashed by 40% in Ireland, 35% in the USA and 25% in UK after the GFC. Prices can go down as well as up. Property is not a one-way bet!

But, if you are seeking to buy, for somewhere to live, and capital growth is less important to you, then it may still be a good time to transact. Prices are already down, and many sellers are accepting deeper discounts off the asking price to make a deal. In addition, if you are a first time buyer, there are state incentives and really low mortgage rates available. But remember you are still buying into a highly unaffordable market, and the capital value of your property may fall. This could turn into a paper loss, and indeed should you need to sell, a real financial hit. The way a mortgage works is you put in a deposit, and the bank lends the rest. But in a falling market, it is your deposit which is eroded. After the GFC many households in the northern hemisphere ended up in negative equity, meaning the value of their mortgage was larger than the market value of their property. As a result, people were stuck living in their properties unable to move, hoping the market would rise again. In fact, it did over the next 10 years, so now many are no longer in negative equity. But it can be a long and winding road.

Next, if you do decide to buy, do the work. First look around at property available, and recent sales, to get a sense of the market. Also look in different areas, and even different states. Often locations a little further from public transport are cheaper – but then is the trade-off worth it? Also compare new builds with existing property. Often newly constructed homes carry a premium, which just like a new car, on first use falls away. On the other hand, there are some desperate builders out there, with big projects, and few buyers, especially in the high-rise belts of Brisbane, Melbourne and Sydney, so they may do a deal. We are seeing a steady stream of people who sign up for off the plan builds, but then when it comes to getting a mortgage, they cannot find one, so cannot complete. So read the small print on these contracts. Ask yourself, what happens if you cannot complete the transaction.

It is also harder to add any value to a new property, whereas an older one may offer more potential for investment and upgrade, and this can be a way of helping to preserve value. There is an old adage – buy the worst property on the best street. This is still true, with caveats – you should check the condition of the property so you know what you are up for.

Also, do the work when it comes to a mortgage. Our research shows you can often get better mortgage rates from some of the smaller customer owned lender, as opposed to the big four by going direct to them. So shop around. Whilst using a broker may help, again we find that some of the best rates are found by borrowers who do the work themselves. Many brokers will do the right thing, and really help, but there is a risk that the commission and ownership structure of broker firms may mean they do not have access to the best rates, and they may not always be working in your best interests, so be careful.

There is more work to do also, on affordability. A lender will make an offer of a mortgage, based on your financial details as contained in the application, and supporting evidence. Remember lenders want to make a loan – it is the only game in town in terms of their profitability – but there is evidence that some lenders will offer a bigger loan, by using more aggressive living expenses, and income assumptions. That said, the industry is getting more conservative, with lower allowable loan to value ratios, and some income categories now reduced.

Just because the lender says you can have a loan, does not mean you should get the loan. The lender is looking at risk of loss from their perspective, not yours. If you have a large deposit, then the bank can assume that capital is available on default to recover their mortgage. Remember in Australia, you cannot just walk away and return the keys, the liability stays with you. So, ask the lender, not just about repayments at current interest rates, but also what happens if they rise. A good rule of thumb is catering for a 3% rise in rates. Get the lender to tell you what the revised repayments would be at this higher rate, and ask yourself if you could still make the repayments. This is important, as incomes are not growing in real terms and mortgage rates may well rise. If you cannot make the repayments at 3% high, get a smaller loan, and buy a smaller place.

You may need to build your own cash flow to test what is affordable – again do not rely on the bank for this – remember they are concerned about risk of loss to their shareholders, not to you.  ASIC’s MoneySmart Budget Planner is a good starting point. Also, remember to include the transaction and stamp duty costs in your calculations.

Another area is the deposit you will need. These days you are likely to need a bigger deposit. 20% would be a good target, as this then avoids having to pay for expensive Lenders Mortgage Insurance. Above that, you will need this facility – which to be clear, protects the bank, not you!

More prospective borrowers are turning to the Bank of Mum and Dad, for help, but there are also risks attached to this arrangement – see our earlier Video Blog on the Bank of Mum and Dad. Some buyers are clubbing together to purchase, but there are risks attached to these arrangements too.

Finally, if you do buy, work on the assumption you will need to hold the property for some time – say a minimum of 3-5 years. The old trick of flicking after a year or so will not work if, as we expect prices fall. Remember too that there are additional costs to owning a property from council rates, running costs – such as electricity – and maintenance costs. Owning property is an expensive business.   Make sure these costs are included in your cash flows.

So what’s the bottom line?  If you are wanting to buy to put shelter over your family’s head, and can afford the mortgage, and are willing to accept a risk of loss of capital, then do the work, and it might be the right thing to do.  A capital gain is by no means certain in the current climate!

But, if you are looking at property as a wealth building tool, I think you might do better to hold off, as prices are likely to slide, and the costs of an investment mortgage are on the rise. At very least look in areas around Hobart and Adelaide where value is better at the moment.

In fact, though, the only reason I can see to transact in this case is to lock in a negative gearing arrangement now, before the next Federal election. But then, that seems to me to be a long bow, and our modelling suggests that the removal of negative gearing will have only a minor impact on the market. There are a bunch of other more compelling reasons to think the market will fall.

So in summary, whatever type of borrower you are, do the work and be very careful. Prices may rise, but they can also certainly fall, and a mortgage could just be a noose around your neck.

If you found this useful, do like the post, leave a comment, and subscribe to receive future updates. Keep an eye out for our upcoming special post on Cryptocurrencies and Bit Coin.

Housing Affordability and Employment – The Property Imperative Weekly 27 Jan 2018

Housing in Australia is severely unaffordable, and despite the growth in jobs, unemployment in some centres is rising. We look at the evidence. Welcome the Property Imperative Weekly to 27th January 2018.

Thanks to checking out this week’s edition of our property and finance digest.   Watch the video or read the transcript.

Today we start with employment data. CommSec looked at employment across regions over the last year. Despite the boom in jobs, the regional variations are quite stark, with some areas showing higher rates of unemployment, and difficult economic conditions. Unemployment has increased in several Queensland regional centres in recent years. Queensland’s coastal regional centres such as Bundaberg, Gympie, Bundaberg and Hervey Bay, known more broadly as Wide Bay (average 9.0 per cent), together with Townsville (albeit lower at 8.5 per cent) have elevated jobless rates. Unemployment also increased along the suburban fringes and city ‘spines’ such as Ipswich (8.1 per cent) in Brisbane and the western suburbs of Melbourne (9.0 per cent). In Western Australia, Mandurah, south of Perth, experienced a significant decline in the jobless rate to an average of 7.0 per cent in December from 11.2 per cent a year ago. Higher income metropolitan areas, especially in Sydney’s coastal suburbs, dominate the regions with the lowest unemployment rates. However, the corridor between Broken Hill and Dubbo has Australia’s lowest regional unemployment rate at 2.9 per cent, benefitting from agricultural, tourism and mining-related jobs growth. You will find there is a strong correlation with mortgage stress, as we will discuss next week.

The Victorian Government has reaffirmed their intent to shortly accept applications for its shared equity scheme known as HomesVic from up to 400 applicants. We do not think such schemes help affordability, they simply lift prices higher, but looks good politically.  This was first announced in March 2017. The $50-million pilot initiative aims to make it easier for first-home buyers to enter the market by reducing the size of their loan, hence reducing the amount they need to save for a deposit. The initiative targets single first-home buyers earning an annual income of less than $75,000 and couples earning less than $95,000. Eligible applicants must buy in so-called “priority areas” which include 85 Melbourne suburbs, seven fringe towns and 130 regional towns and suburbs. In Melbourne, the list includes suburbs around Box Hill, Broadmeadows, Dandenong, Epping, Fishermen’s Bend, Footscray, Fountain Gate, Frankston, LaTrobe, Monash, Pakenham, Parkville, Ringwood, Sunshine and Werribee. Regional centres on the list include Ballarat, Bendigo, Castlemaine, Geelong, La Trobe, Mildura, Seymour, Shepparton, Wangaratta, Warrnambool and Wodonga. The state government said the locations were chosen in growth areas where there was a high demand for housing and access to employment and public transport. Some of these locations are where mortgage stress, on our modelling is highest – we will release the January results next week. The scheme is not available in most of Melbourne’s bayside suburbs, the leafy inner eastern suburbs or some pockets of the inner north.

Overseas, the US Mortgage Rates continue to rise, heading back to the worst levels in more than 9 months.  Rates have risen an eighth of a percentage point since last week, a quarter of a point from 2 weeks ago, and 3/8ths of a point since mid-December.  That makes this the worst run since the abrupt spike following 2016’s presidential election. While this doesn’t necessarily mean that rates will continue a linear trend higher in the coming months, the trajectory is up, reflecting movements in the capital markets, and putting more pressure on funding costs globally.

The Bank for International Settlements (BIS) has published an important reportStructural changes in banking after the crisis“. The report highlights a “new normal” world of lower bank profitability, and warns that banks may be tempted to take more risks, and leverage harder in an attempt to bolster profitability. This however, should be resisted. They also underscore the issues of banking concentration and the asset growth, two issues which are highly relevant to Australia. The report says that in some countries the 2007 banking crisis brought about the end of a period of fast and excessive growth in domestic banking sectors.  Worth noting the substantial growth in Australia, relative to some other markets and of particular note has been the dramatic expansion of the Chinese banking system, which grew from about 230% to 310% of GDP over 2010–16 to become the largest in the world, accounting for 27% of aggregate bank assets.

Back home, an ASIC review of financial advice provided by the five biggest vertically integrated financial institutions (the big four banks and AMP) has identified areas where improvements are needed to the management of conflicts of interest. 68% of clients’ funds were invested in in-house products. ASIC also examined a sample of files to test whether advice to switch to in-house products satisfied the ‘best interests’ requirements. ASIC found that in 75% of the advice files reviewed the advisers did not demonstrate compliance with the duty to act in the best interests of their clients. Further, 10% of the advice reviewed was likely to leave the customer in a significantly worse financial position. This highlights the problems in vertically integrated firms, something which the Productivity Commission is also looking at. The real problem is commission related remuneration, and cultural norms which put interest of customers well down the list of priorities.

The Financial Services Royal Commission has called for submissions, demonstrating poor behaviour and misconduct. It will hold an initial public hearing in Melbourne on Monday 12 February 2018. The not-for-profit consumer organisation, the Consumer Action Law Centre (CALC) said the number of Aussie households facing mortgage stress has “soared” nearly 20 per cent in the last six months, and argued that lenders are to blame. Referencing Digital Finance Analytics’ prediction that homes facing mortgage stress will top 1 million by 2019, CALC said older Australians are at particular risk. The organisation explained: “Irresponsible mortgage lending can have severe consequences, including the loss of the security of a home. “Consumer Action’s experience is that older people are at significant risk, particularly where they agree to mortgage or refinance their home for the benefit of third parties. This can be family members or someone who holds their trust.” Continuing, CALC said a “common situation” features adult children persuading an older relative to enter into a loan contract as the borrower, assuring them that they will execute all the repayments. “[However] the lack of appropriate inquiries into the suitability of a loan only comes to light when the adult child defaults on loan repayments and the bank commences proceedings for possession of the loan in order to discharge the debt,” CALC said. We think poor lending practice should be on the Commissions Agenda, and we will be making our own submission shortly.

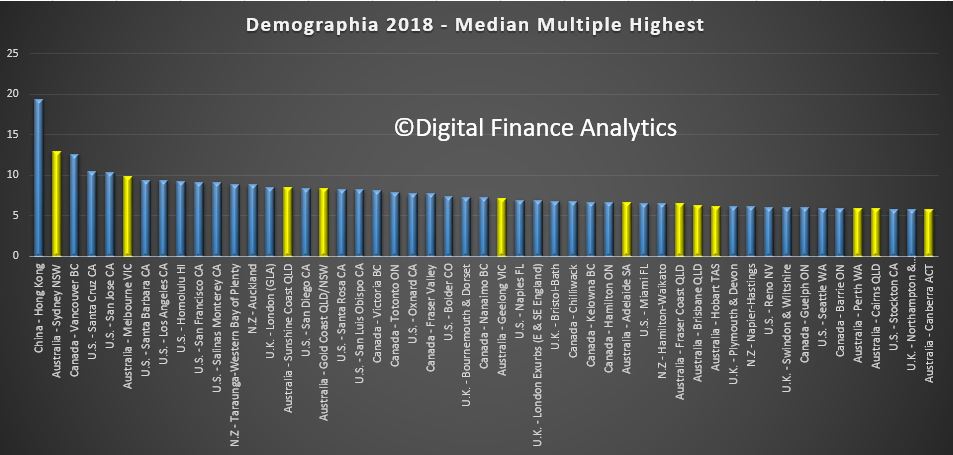
The latest 14th edition of the Annual Demographia International Housing Affordability Survey: 2018, continues to demonstrate the fact that we have major issues here in Australia. There are no affordable or moderately affordable markets in Australia. NONE! Sydney is second worst globally in terms of affordability after Hong Kong, with Melbourne, Sunshine Coast, Gold Coast, Geelong, Adelaide, Brisbane, Hobart, Perth, Cains and Canberra all near the top of the list. You can watch our separate video where we discuss the findings and listen to our discussion with Ben Fordham on 2GB.  When this report comes out each year, we get the normal responses from industry, such as Australia is different or the calculations are flawed. I would simply say, the trends over time show the relative collapse in affordability, and actually the metrics are well researched.

Fitch Ratings published its Global Home Prices report. They say price growth is expected to slow in most markets and risks are growing as the prospect of gradually rising mortgage rates comes into view this year. Their data on Australia makes interesting reading. Fitch expects Sydney and Melbourne HPI to stabilise in 2018, due to low interest rates, falling rental yields, increasing supply, limited investment alternatives and growing dwelling completions, partially offset by high population growth. Fitch expects the increase in FTB to be temporary; low income growth, tighter underwriting and rising living costs will maintain pressure on affordability for FTB. As mortgage rates are currently low, any material rate rise will weigh further on mortgage affordability and serviceability. The rising cost of living and sluggish wage growth are likely to increase pressure on recent borrowers who have little disposable income. Fitch expects mortgage lending growth to slow to around 4% in 2018, based on continued record low interest rates and stable unemployment. This will once again be offset by continued underemployment, reduced investor demand and tougher lending practices.

Finally, the latest weekly data from CoreLogic underscores the weakness in the property market. First prices are drifting lower, with Sydney down 0.4% in the past week and Melbourne down 0.1%.  The indicator of mortgage activity is also down, suggesting demand is easing as lending rules tighten. But then we always have a decline over the summer break. The question is, are we seeing a temporary blip, over the holiday season, or something more structural? We think the latter is more likely, but time will tell.

So that’s the Property Imperative Weekly to 27th January 2018. If you found this useful, do like the post, add a comment and subscribe to receive future editions. Many thanks for taking the time to watch.


The Housing Affordability Crisis In Australia

Our latest Video Blog discusses the Demographia Housing Affordability Report with specific reference to Australia.

The latest 14th edition of the Annual Demographia International Housing Affordability Survey: 2018, using 3Q 2017 data continues to demonstrate the fact that we have major issues here. There are no affordable or moderately affordable markets in Australia. NONE!

Housing Unaffordable In Australia – Demographia

The latest 14th edition of the Annual Demographia International Housing Affordability Survey: 2018, using 3Q 2017 data continues to demonstrate the fact that we have  major issue in Australia. There are no affordable or moderately affordable markets in Australia. NONE!

The major markets of Australia (6.6), New Zealand (8.8) and China (19.4) are severely unaffordable. By international standards houses are big in both Australia and New Zealand but relatively unaffordable.

Using a standard methodology across geographies, the study benchmarks affordability of middle income housing, using an index on average prices and incomes – formally, Median Multiple: Median house price divided by median household income.

Sydney is second worst in terms of affordability after Hong Kong, with Melbourne, Sunshine Coats, Gold Coast, Geelong, Adelaide, Brisbane, Hobart, Perth, Cains and Canberra all near the top of the list.  [Click on the graphic to see it larger].

In recent decades, house prices have escalated far above household incomes in many parts of the world. In some metropolitan markets house prices have doubled, tripled or even quadrupled relative to household incomes. Typically, the housing markets rated “severely unaffordable” have more
restrictive land use policy, usually “urban containment.”

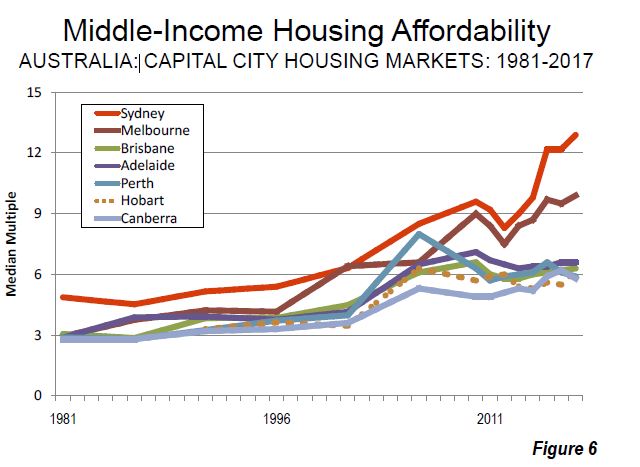
Sydney is again Australia’s least affordable market, with a Median Multiple of 12.9, and ranks second worst overall, trailing Hong Kong. Sydney’s housing affordability has worsened by the equivalent of 6.6 years in pre-tax median household income since 2001. This is a more than doubling of the Median Multiple. In contrast, Sydney’s housing affordability worsen less than one-fourth as much between 1981 and 2001.

At 12.9 Sydney’s Median Multiple is the poorest major housing affordability ever recorded by the Survey outside Hong Kong. Additionally, the UBS Global Real Estate Bubble Index rates Sydney as having the world’s fourth worst housing bubble risk (tied with Vancouver).

Melbourne has a Median Multiple of 9.9 and is the fifth least affordable major housing market internationally. Only Hong Kong, Sydney, Vancouver, and San Jose are less affordable than Melbourne. Melbourne’s Median Multiple has deteriorated from 6.3 in 2001 and under 3.0 in the early 1980s. Just since 2001, median house prices have increased the equivalent of more than three years in pre-tax median household income.

Adelaide has a severely unaffordable 6.6 Median Multiple and is the 16th least affordable of the 92 major markets. Brisbane has a Median Multiple is 6.2 and is ranked 18th least affordable, while Perth, with a Median Multiple of 5.9 is the 21st least affordable major housing market in Australia.

The report argues that:

The key to both housing affordability and an affordable standard of living is a competitive market that produces housing (including the cost of associated land) at production costs, including competitive profit margins.

None of that currently exists in Australia, with land prices sky high, linked to lack of supply (strange given the size of the country!) as well as the financialisation of property and the massive investment sector.

In contrast with well functioning housing markets, virtually all the severely unaffordable major housing markets covered in the Demographia International Housing Affordability Survey have restrictive land use regulation, overwhelmingly urban containment. A typical strategy for limiting or prohibiting new housing on the urban fringe an “urban growth boundary,” (UGB) which leads to (and is intended to lead to) an abrupt gap in land values.

Australia is perhaps the least densely populated major country in the world, but state governments there have contrived to drive land prices in major urban areas to very high levels, with the result that in that country housing in major state capitals has become severely unaffordable.

The RBA On Housing Affordability

The RBA released their latest Bulletin today  and it contained an interesting section on Housing Accessibility For First Time Buyers.  They suggest that in many centers, new buyers are able to access the market, at the current low interest rates. But the barriers are significantly higher in Melbourne, Sydney and Perth.

They also highlight that FHBs (generally being the most financially constrained buyers) are not always able to increase their loan size in response to lower interest rates because of lenders’ policies. Indeed, the average FHB loan size has been little changed over recent years while the gap between repeat buyers and FHBs’ average loan sizes has widened.

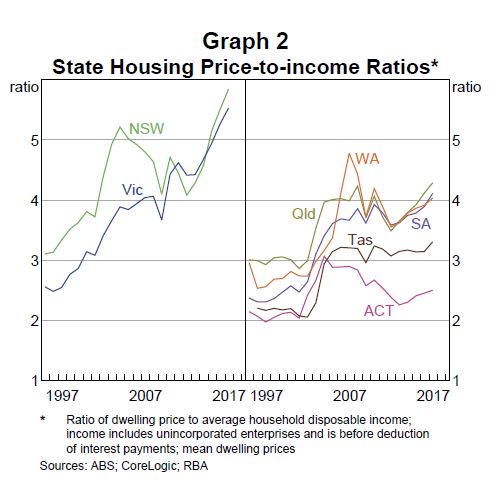
The article starts with an analysis of housing price-to-income ratios.

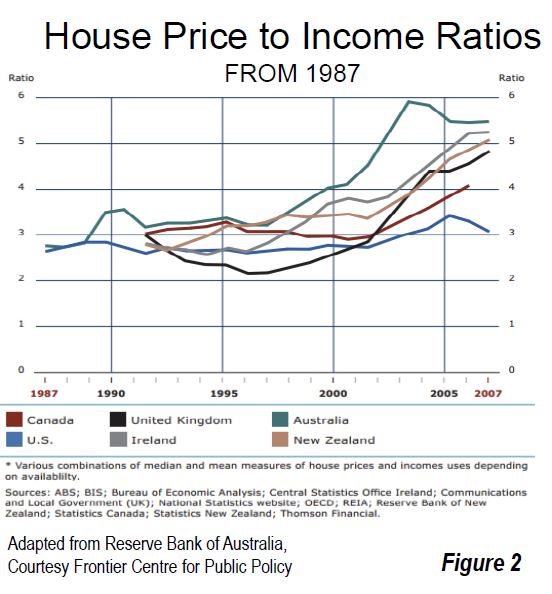
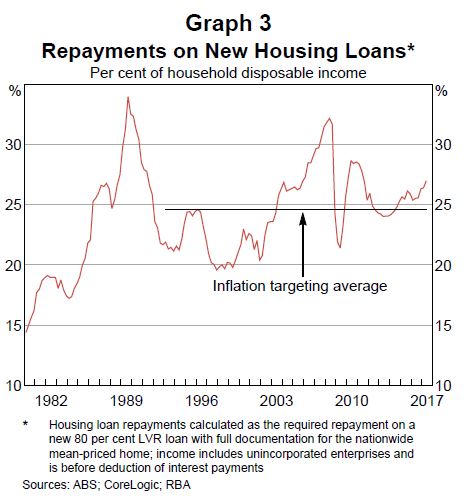
In Australia, the housing price-to-income ratio has increased since the early 1990s, and has increased particularly rapidly over the past five years to reach its highest level on record. At face value, this suggests that housing affordability is at a record low. However, this masks significant differences across states. The recent trend increase in the housing price-to-income ratio is largely due to increases in the ratios in New South Wales and Victoria (Graph 2). The housing price-to-income ratios have increased by less in other states in recent years and suggest that housing affordability in those states is at a similar level to the mid 2000s.

This housing affordability measure accounts for changes in average housing prices and household income. However, it ignores the effect of changes in interest rates on borrowing costs and other financial factors that may affect a household’s purchasing capacity and therefore their ability to purchase a home.

If interest rates fall, households can afford to repay a larger mortgage, all other things being equal. This would be reflected in a lower mortgage debt-servicing ratio, and would imply greater affordability. There is no role for changes to the deposit burden in the mortgage debt-servicing ratio, as the LVR is considered to be fixed. Looking at the trends over time, the aggregate mortgage debt-servicing ratio has risen over the
past year or so and is currently above the average of the inflation-targeting period but below historical peaks

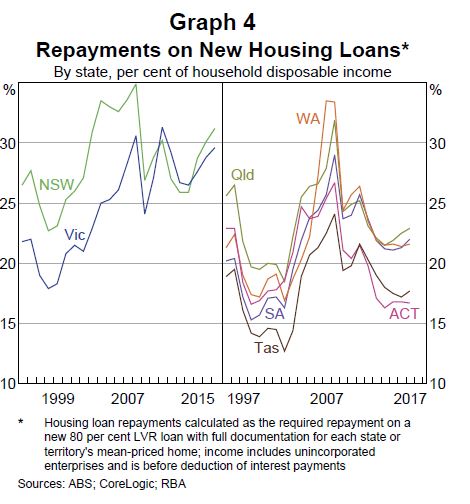
There are significant state variations.

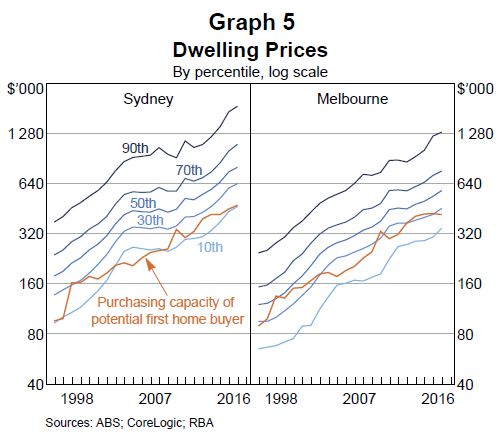
A shortcoming of the conventional estimates of housing affordability is that, by focussing on the average home price and average household income, they measure affordability for the average household. But the typical FHB is not the same as the average household – they tend to be younger and less wealthy. Also, if most FHBs buy homes that are cheaper than the average, then measures that focus on the average home will provide a poor guide to the ability of FHBs to purchase their first home (i.e. housing accessibility). To address these shortcomings, we construct a housing accessibility index that specifically focuses on the purchasing capacity of potential FHBs

This measure combines information from household surveys with data on all housing sale transactions in Australia. It shows housing accessibility is around the long-run average in aggregate in Australia, with the median potential FHB being able to afford around one-third of all homes sold in 2016, although this share is significantly lower in Sydney, Melbourne and Perth. Moreover, the quality of homes that potential FHBs can afford has fallen over time, as measured by location and the number of bedrooms. This measure also shows accessibility is lower in capital cities, particularly in areas close to the CBD.

The cost of renting is also an important component of housing affordability and the number of households renting has trended up over the past few decades. In aggregate, rents have grown broadly in line with household incomes, although rent-to-income ratios suggest housing costs for lower-income households have increased over the past decade.

Housing Affordability Improves For Some

From The Real Estate Conversation.

Housing affordability has improved across all states and territories, allowing for a large increase in the number of loans to first-home buyers, according to the September quarter edition of the Adelaide Bank/REIA Housing Affordability Report.

The report shows the proportion of median family income required to meet average loan repayments decreased by 1.2 percentage points over the quarter to 30.3 per cent. The result was decrease of 0.6 percentage points compared with the same quarter in 2016.

REIA president Malcolm Gunning said first-home buyers now make up 24.5 per cent of the total owner occupied housing market, excluding refinancing.

“This is the highest rate since September 2013,” he said, noting the rate had been dropping steadily for the last five years until this latest rise.

Gunning said the number of first home buyers increased by 22.8 per cent over the quarter and 32.6 per cent over the year.

Darren Kasehagen, Head of Business Development, Adelaide Bank said, “The increase in housing affordability across all states and territories is to be welcomed and is reflected by heightened activity in the number of first home buyers coming back into the market.

“Housing affordability is still a major issue in Sydney and Melbourne, but there are some bright spots in the latest report from the other capitals that are also worthy of note.

The largest increases in first-home buyers were New South Wales (up 57.7 per cent), Victoria (up 32.2 per cent), the Northern Territory (up 14.3 per cent) and the Australian Capital Territory (up 20.0 per cent).

“Nationally, the average loan size to first home buyers increased to $319,500, or by 0.6 per cent over the September quarter – but decreased by 0.1 per cent over the past twelve months,” said Kasehagen.

For all borrowers, the average loan size decreased to $380,900 with the total number of loans increasing by 4.2 per cent for the quarter or 12.5 per cent year on year.

Rental market affordability

The report shows varied affordability across rental markets.

“Over the quarter, the proportion of median family income required to meet rent payments increased by 0.3 percentage points to 24.6 per cent,” said Gunning.

Rental affordability improved in Queensland, South Australia, Western Australia and the Northern Territory, he said, and remained steady in Victoria but declined in New South Wales, Tasmania and the Australian Capital Territory.

Western Australia recorded a “standout” result, said Kasehagen.

Western Australia knocked the ACT from their position of being the state or territory with the lowest proportion of family income devoted to meeting median rents. Western Australians only contribute 17.4 per cent of their family income to rent, according to the report. The figure for Canberra was 18.1 per cent.

“This bides well for future first home buyers in the West seeking to build a deposit and take the step toward eventual home ownership,” said Kasehagen.

In Canberra, 18.5 per cent of family income in Canberra was devoted to meeting average loan repayments – the lowest percentage in the country. The gap between renting and buying in Canberra is now only 0.4 per cent, said Kasehagen.

“An equation that may see more people now renting in the ACT deciding to take the step towards home ownership,” he said.

Adelaide Bank/REIA Housing Affordability Report: State by State

New South Wales

Over the September quarter, housing affordability in New South Wales improved with the proportion of income required to meet loan repayments decreasing to 36.1 per cent, a fall of 1.9 percentage points over the quarter and a decrease of 1.0 percentage points compared with the corresponding quarter 2016. With the proportion of income required to meet loan repayments 5.8 percentage points higher than the nation’s average, New South Wales remained the least affordable state or territory in which to buy a home.

In New South Wales, the number of loans to first home buyers increased to 6,775, an increase of 57.7 per cent over the quarter and a rise of 70.9 per cent compared to the September quarter 2016. Of the total number of first home buyers that purchased during the September quarter, 23.4 per cent were from New South Wales while first home buyers make up 19.0 per cent of the State’s owner-occupier market. The average loan to first home buyers decreased to $361,333, a decrease of 1.2 per cent over the quarter and a decrease of 1.0 per cent compared to the same quarter last year.

Rental affordability, declined in New South Wales over the September quarter with the proportion of income required to meet median rent payments increasing to 29.8 per cent, an increase of 1.2 percentage points over the September quarter and an increase of 1.7 percentage points compared to the same quarter last year.

Victoria

Over the September quarter, housing affordability improved in Victoria with the proportion of income required to meet loan repayments decreasing to 32.2 per cent, a decrease of 1.2 percentage points over the quarter and a decrease of 0.2 percentage points compared to the same quarter of the previous year.

The number of loans to first home buyers in Victoria increased to 8,786, an increase of 32.2 per cent over the quarter and an increase of 33.0 per cent compared to the September quarter 2016. Of the total number of first home buyers that purchased during the September quarter, 30.4 per cent were from Victoria while first home buyers make up 26.2 per cent of the State’s owner-occupier market.

Rental affordability in Victoria has remained steady over the quarter with the proportion of income required to meet median rent remaining at 23.1 per cent. Compared to the September quarter 2016, rental affordability has declined with the proportion of income required to median rent increasing by 0.2 percentage points.

Queensland

Housing affordability in Queensland improved over the September quarter with the proportion of income required to meet home loan repayments decreasing to 26.8 per cent, a decrease of 0.5 percentage points over the quarter and a decrease of 1.0 percentage points compared to the same quarter last year.

Over the September quarter, the number of loans to first home buyers in Queensland increased to 6,271, an increase of 4.5 per cent over the quarter and an increase of 18.5 per cent compared to the same quarter of 2016. Of all Australian first home buyers over the quarter, 21.7 per cent were from Queensland while the proportion of first home buyers of the State’s owner-occupier market was 26.1 per cent.

Rental affordability in Queensland improved over the quarter with the proportion of the median family income required to meet the median rent decreasing to 22.8 per cent, a decrease of 0.2 percentage points over the quarter and a decrease of 0.6 percentage points compared to the same quarter 2016.

South Australia

Over the September quarter, housing affordability in South Australia improved with the proportion of income required to meet monthly loan repayments decreasing to 25.3 per cent, a decrease of 1.5 percentage points over the quarter and a decrease 1.1 percentage points compared to the September quarter 2016.

Over the September quarter, the number of loans to first home buyers in South Australia increased to 1,385, an increase of 2.0 per cent over the quarter and an increase of 12.6 per cent compared to the September quarter 2016. Of all Australian first home buyers over the quarter, 4.8 per cent were from South Australia while the proportion of first home buyers in the state’s owner-occupier market was 19.2 per cent.

Rental affordability in South Australia also improved over the quarter with the proportion of income required to meet rent payments decreasing to 21.7 per cent, a decrease of 0.2 percentage points over the quarter and a decrease of 0.7 percentage points compared to the September quarter 2016.

Western Australia

Over the September quarter, housing affordability in Western Australia improved with the proportion of income required to meet loan repayments decreasing to 22.4 per cent, a decrease of 1.2 percentage points over the quarter and a decrease of 1.4 percentage points compared to the September quarter 2016.

The number of first home buyers in Western Australia increased to 4,432 in the September quarter, an increase of 7.4 per cent over the quarter and an increase of 17.9 per cent compared to the same time last year. Of all Australian first home buyers over the quarter, 15.3 per cent were from Western Australia while the proportion of first home buyers in the state’s owner-occupier market was 36.2 per cent.

Rental affordability in Western Australia also improved during the September quarter with the proportion of family income required to meet the median rent decreasing to 17.4 per cent, a decrease of 0.7 percentage points over the quarter and a decrease of 1.8 percentage points compared to the year before.

Tasmania

Housing affordability in Tasmania improved over the September quarter with the proportion of income required to meet home loan repayments decreasing to 23.3 per cent, a decrease of 0.6 percentage points over the quarter and a decrease of 0.5 percentage points from the September quarter 2016.

The number of first home buyers in Tasmania increased to 386, an increase of 1.6 per cent over the quarter but a decrease of 3.3 per cent compared to the same quarter of the previous year. Of all Australian first home buyers over the quarter, 1.3 per cent were from Tasmania while the proportion of first home buyers in the state’s owner-occupier market was 17.5 per cent.

Rental affordability in Tasmania, however, declined over the quarter with the proportion of income required to meet median rents increasing to 26.3 per cent, an increase of 0.5 percentage points over the quarter and an increase of 2.3 percentage from the same quarter 2016.

Northern Territory

Housing affordability in the Northern Territory improved with the proportion of income required to meet loan repayments decreasing to 19.4 per cent in the September quarter, a decrease of 0.9 percentage points over the quarter and a decrease of 1.1 percentage points when compared to the September quarter 2016.

The number of loans to first home buyers in the Northern Territory increased to 200, an increase of 14.3 per cent over the September quarter and an increase of 37.9 per cent compared to the September quarter 2016. Of all Australian first home buyers over the quarter, 0.7 per cent were from the Northern Territory while the proportion of first home buyers in the Territory’s owner-occupier market was 28.8 per cent.

Rental affordability in the Northern Territory also improved over the quarter with the proportion of income required to meet the median rent decreasing to 22.7 per cent, a decrease of 0.4 percentage points over the quarter and a decrease of 2.0 percentage points compared to the September quarter 2016.

Australian Capital Territory

Housing affordability in the Australian Capital Territory improved over the September quarter with the proportion of income required to meet home loan repayments decreasing to 18.5 per cent, a decrease of 1.3 percentage points over the quarter and a decrease of 1.5 percentage points compared to the same quarter last year.

The number of loans to first home buyers in the Australian Capital Territory increased to 684, an increase of 20.0 per cent over the quarter and an increase of 64.4 per cent compared to the September quarter 2016. Of all Australian first home buyers over the quarter, 2.4 per cent were from the Australian Capital Territory while the proportion of first home buyers in the Territory’s owner-occupier market was 26.8 per cent.

Rental affordability in the Australian Capital Territory, however, declined over the September quarter with the proportion of income required to meet the median rent increasing to 18.1 per cent, an increase 0.2 percentage points over the quarter and an increase of 0.8 percentage points compared to the September quarter 2016.

Housing – All About Supply and Demand; But Not What You Think

The Government view is high home prices is ultimately driven by lack of supply, relative to demand, including from migration. So the solution is to build more (flick pass to the States!). It has nothing to do with excessive debt, nor does the fact the average number of people per home is falling signify anything.  And tax policy is not the problem.

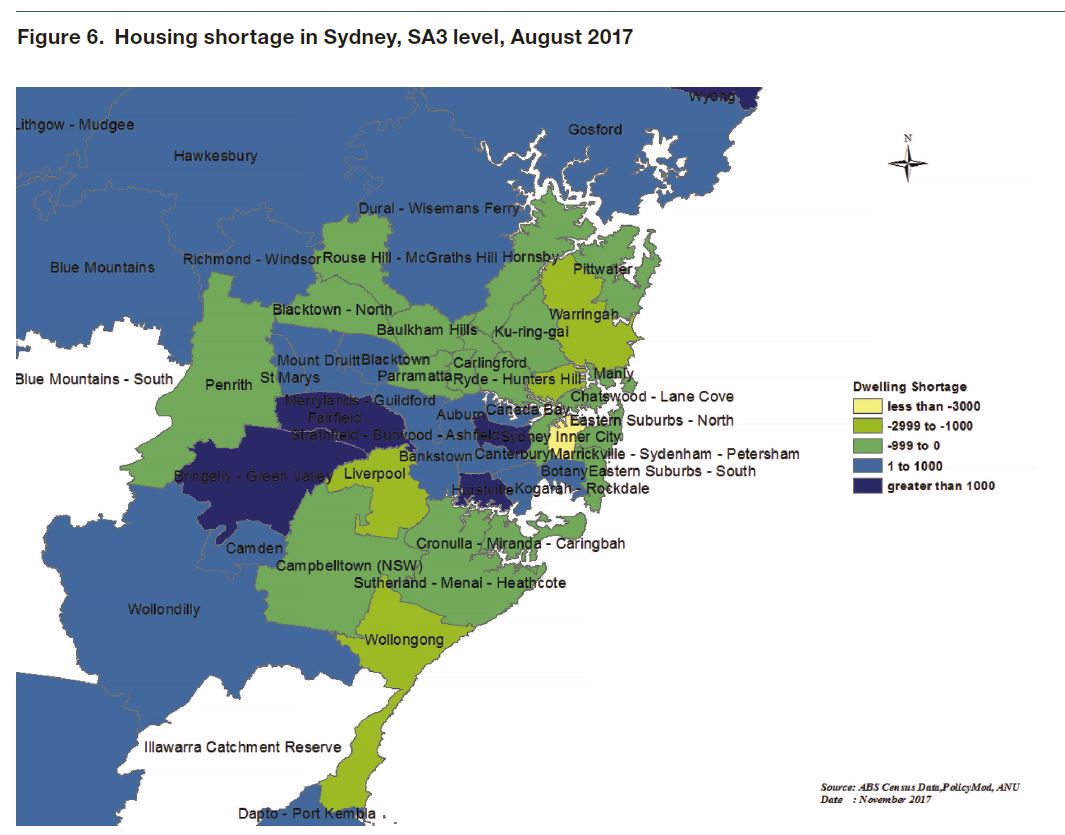
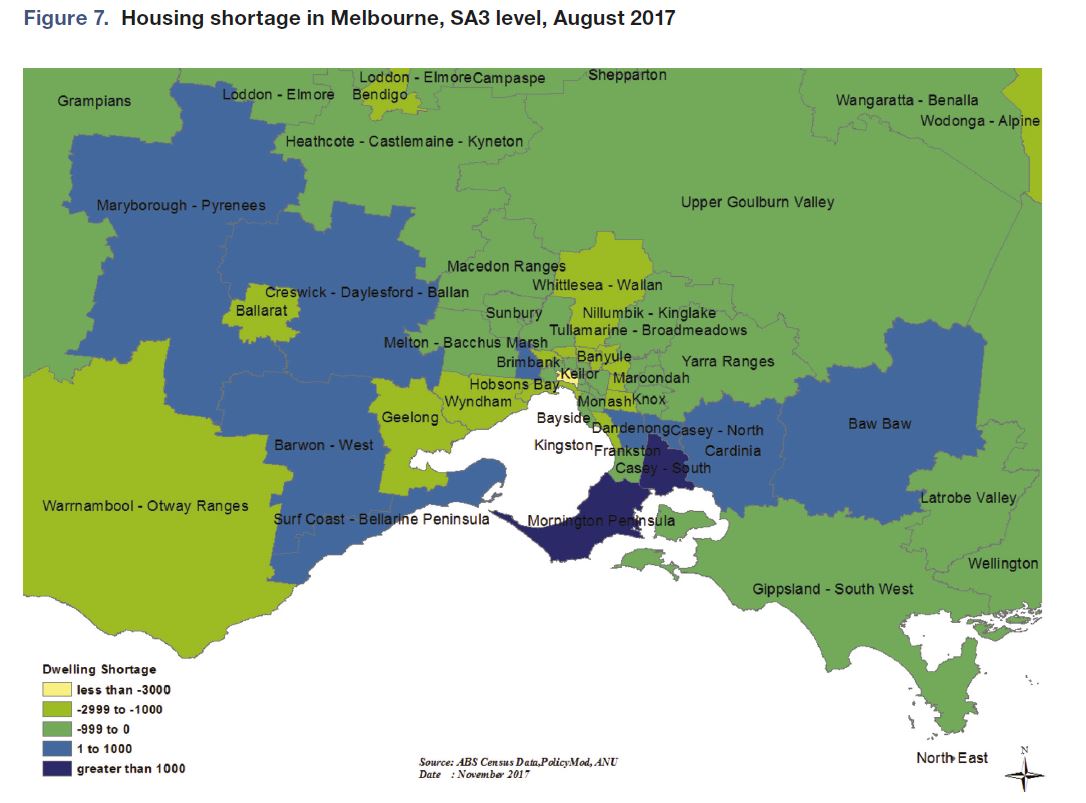
However, a new working paper “Regional housing supply and demand
in Australia” from the ANU Center for Social Research and Methods blows a mighty hole in that mantra.  They suggest that demand factors (availability of loans, tax concessions etc.) have a significant impact, while demand and supply equilibrium varies significantly across different regions, with some hot spots, and some where vacant property exists (yet prices remain high, because of these demand factors). Significantly, much of the surplus is in areas where high-rise development has been strong. We think this may signal further downward pressure on prices in these areas.

Over the year to June 2017 Australia built nearly 220,000 dwellings.  Construction rates of units and other attached housing have more than doubled this decade, with around 103,000 units, townhouses and terrace houses completed in the latest financial year. Most of these completions are high-rise units in Australia’s capital cities (which is why the average home size is falling). Detached house completions have also trended up in recent years, but the growth has been more modest. This paper accounts for differential in the type of stock being built, with detached housing supporting a greater number of persons per dwelling than units and townhouses.

The paper measures the gap between housing supply and demand at
a regional level in Australia. They have taken into account a range of complicating factors such as changing demographics, building types and the increase in unoccupied dwellings at the regional level.

Previous research efforts in Australia focus on national estimates of the housing ‘gap’ or shortage but here we recognise that housing markets tend to be regional and that house price movements and affordability are likely to be as influenced by local demand and supply conditions as by broad national conditions.

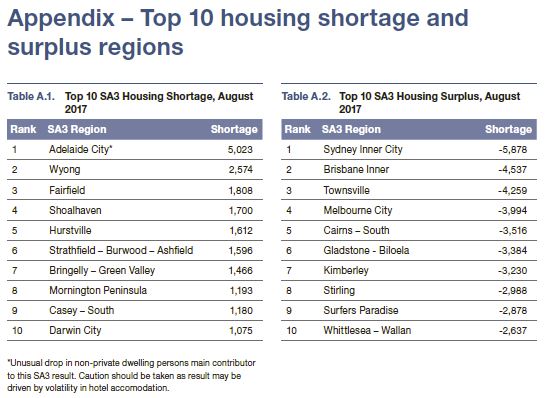
Between the years 2001 and 2017, we estimate the Australian housing market experienced an oversupply of 164,000 dwellings. However, there are significant regional differences with some regions experiencing significant undersupply while others have significant housing surpluses.

Nationally, we do find periods of significant undersuppy, particularly between 2007 and 2014 but for other periods beyond 2001 we find oversupply more than compensated.

The majority of Australia’s housing surplus is situated in the inner-city areas of its major capitals, with Inner Brisbane, Melbourne and Sydney all oversupplied due to recent strong growth in unit developments. Many regional centres, particularly those in mining-sensitive areas such as North
Queensland and Western Australia, also retain housing surpluses.

Many regions in the middle and outer rings of our major capital cities, particularly Sydney, face modest housing shortages.

The modelling suggests that there is some evidence, albeit relatively weak, that a housing shortage is associated with higher house price growth.

The analysis exclusively concerns the concept of underlying demand, recognising that this may not be representative of the demand for housing in a traditional economics sense. The paper also acknowledges the limitations of the analysis in terms of both its conceptual basis and the data it relies on.

This paper does not conclude that people’s housing needs are being met or that what is being supplied is at an affordable price point for all families.

The lack of a housing shortage may have significant implications for housing policy in Australia and the economy more broadly. If Australia’s current record home-building levels are not balanced by a large housing shortage, then there is the risk that these current levels will reduce in the near future. Policy makers will also need to place greater emphasis on other potential drivers of house price growth and housing affordability, such as a range of demand influences.

Housing Affordability, A Complex Equation

Industry Super Australia, a research and advocacy body for Industry super funds, has published an excellent discussion paper on “Assisting Housing Affordability” which endeavors to identify the underlying causes of affordability issues, and to consider some useful policy responses in the current and historical context. They rightly consider both supply and demand related issues.

They call out specifically the impact of incoming migration, especially around university suburbs in the major centres as one major factor.

More broadly, they articulate the problem facing many, in that access to affordable housing – a basic need – is now more difficult than ever and the issue is affecting household spending decisions:

  • Key workers like police officers, teachers and nurses can’t afford to live near the communities they serve.
  • Children are staying at home for longer, marrying later and taking longer to save for a home deposit.
  • Many older Australians are locked into big houses that no longer suit their needs while a greater number of near retirees are renting or paying off a mortgage.
  • Commuters spend too much time on congested roads and trains which are now the norm in certain Australian cities.
  • More Australians are renting.

This has been a long standing issue, but they say from 2013 the problem of housing affordability became more serious.

Many property developers (small and large) entered the market, chasing short-term speculative capital gains. This coincided with a ramping up of student arrivals who drew on their parents’ savings (a safe haven strategy) to acquire bricks and mortar, usually near centres of education. Alarm bells did not ring for Australian governments, even though most new arrivals were settling in a limited number of localities. These factors and market dynamics combined to drive record house prices in key centres. The key drivers of low housing affordability are due to imbalances in demand and supply in certain key markets.

  • On the demand side, key factors include the extent of unanticipated or uncoordinated immigration flows to growth centres; the relationship between international student intake and the dynamics of foreign investment in established dwellings; the interaction between record low interest rates and investors chasing future capital gains via gearing-oriented tax concessions; and lax lending practices.
  • On the supply side, key factors include poorly coordinated land release and infills approvals and the outright restriction of supply by state governments; private land developers stockpiling tracks of land around the urban fringe, and restrictive town planning and zoning rules by local governments that have produced very long lead-times for the construction of new, denser housing stock in areas where affordability is worsening.

There are significant risks attached to ignoring affordability issues.

The lack of coordination in housing policy across all levels of Australian government has generated hotspots in property markets that have undermined macroeconomic stability. Destabilising wealth effects and the continuing expansion of household debt are feeding an unsustainable cycle of property price inflation. Net foreign indebtedness has risen to concerning levels for a small open economy that lacks a diversified economic structure and runs persistent current account deficits. Australia is far too dependent on property and pits (extraction of iron ore, coal and now liquefied natural gas) as the launch pad of its economic advance. This is very risky and may end in tears.

Booming house prices are good news for existing owners and bad news for those entering the market for the first time. Prospective buyers paying 2017 prices must have faith, at a time when even investment professionals believe a purchase now is, over the short to medium term, ill-advised. They must also have faith in their capacity to maintain an adequate income to service their debt, or hope that prices will just keep rising. In Sydney, where prices have risen 87 per cent over five years, whilst incomes have risen around 15 per cent on average, that is a tough call. Yet so many people (mostly Australians below age 35) have been prepared to take out home loans valued at over six times their income, facilitated by the relatively lax lending standards of banks.

The paper confirms the complexity which is housing affordability, and that there are no simple single point solutions.

The key findings of the paper are:

  • Australia’s housing affordability problem has developed over several decades and will require a long-term commitment by all levels of government to resolve.
  • Destabilising wealth effects and the continuing expansion of household debt are feeding a cycle of property price inflation which looks unsustainable.
  • Policy responses that increase the buying power of households (for example, through grants, or reduced taxes) will only increase demand, and therefore prices.
  • Ignoring the emerging crisis in assisted housing (affordable, public and community) now risks major future social and productivity costs.
  • Simply increasing overall housing stock will not ensure that more assisted housing becomes available. Instead, increasing the supply of assisted housing specifically is required.
  • Waitlists for social housing remain intractable and this system no longer serves as a safety net.
  • Achieving the necessary growth in assisted supply is beyond the capacity of Australian governments, and private investment is required.

To resolve the issues in assisted housing, Federal, state and local governments need to coordinate their activity without duplication or political interference. The core elements of any strategy will require:

  • A central body to provide rigorous housing supply forecasting, which will assist with planning.
  • Developing appropriate incentives (for example, tax policy) to encourage institutional investment in a new assisted housing asset class.
  • Expanding the capacity and professionalism of the community housing sector to deal with larger scale developments and tenant administration.

Additionally, some general policy suggestions to address broader housing affordability issues are as follows:

  • Explicitly linking state and local government planning and housing approvals to estimates of regional housing supply gaps.
  • Encouraging more work and student visa holders to reside outside of property market hot-spots.
  • Directing all foreign investment in residential property to new buildings.
  • Streamlining town planning procedures by mandating the removal of unreasonable height restrictions within urban infill development zones (including ‘inner’ and ‘middle-ring’ suburbs).
  • Discouraging land hoarding by identifying underutilised assets for redevelopment (including assisted housing), and providing recycling bonuses to incentivise the release of public and private sites.
  • Reorienting some current tax concessions for existing property towards investment in new housing and institutional investment in new assisted housing.
  • Reforming land taxes in Australia via the abolition of stamp duties and replacing them with a mix of land and betterment taxes.
  • Promoting stability around property – the largest asset class held by ordinary Australians.