Finance Momentum Sags

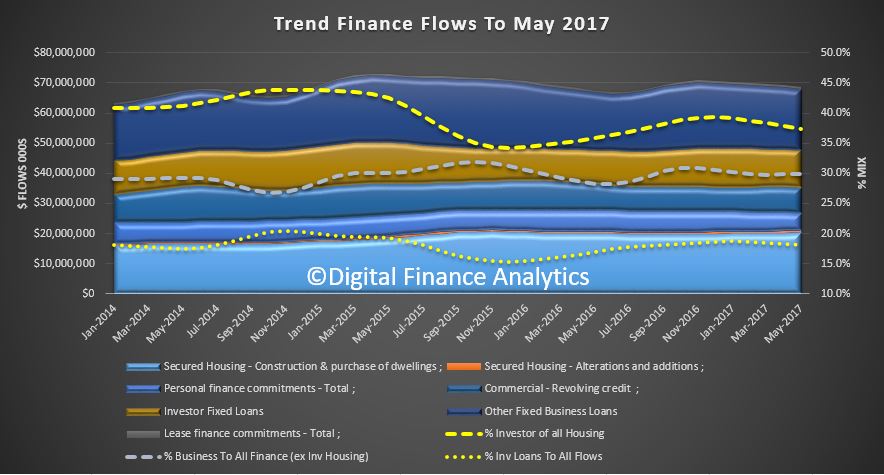
The ABS published the final piece of their May 2017 finance data, showing the flows to May 2017.  It really is a rather sad tale. Owner Occupied housing apart, all other lending flows were lower, whether you look at the trend or seasonally adjusted figures.

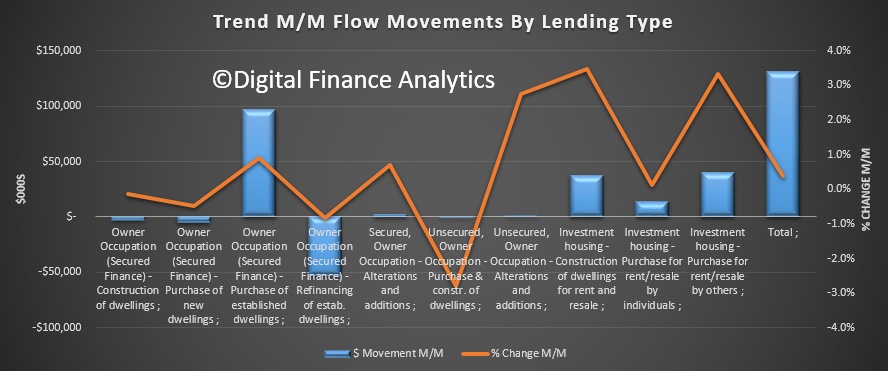
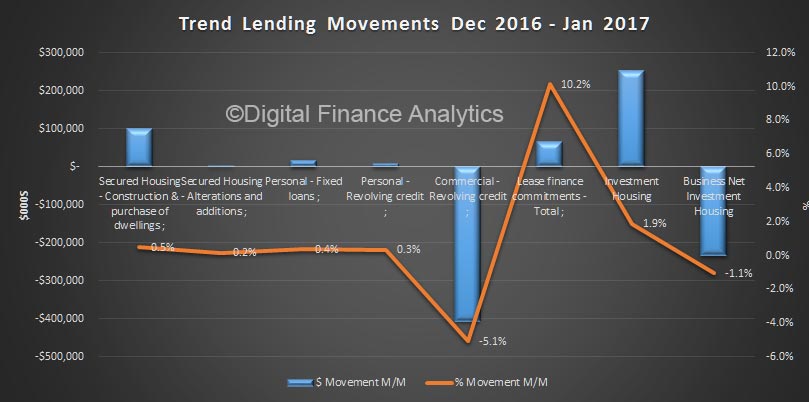
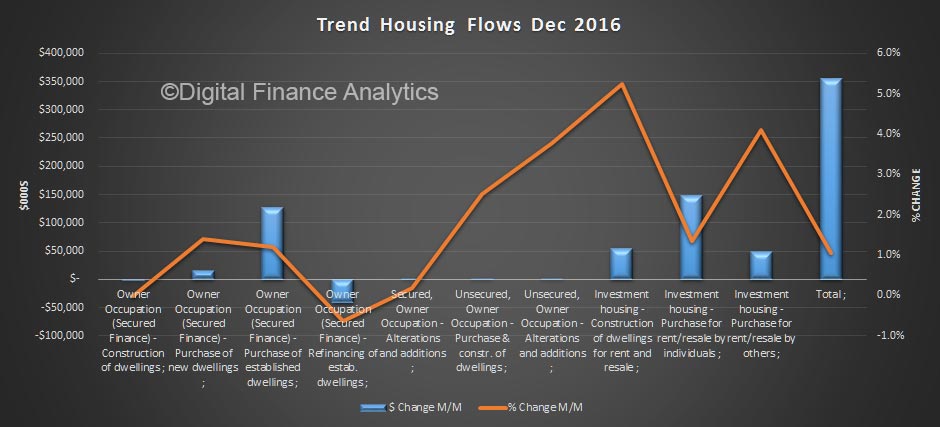
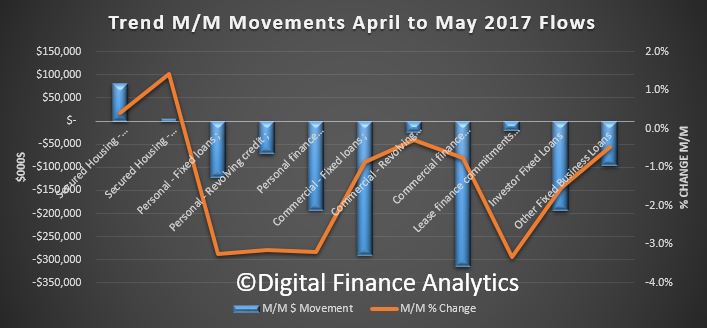
Looking at the moving parts, Secured housing flows rose 0.4% or $80 million, whilst secured housing alterations rose 1.9% or $5m.

Personal credit continues to fall, the flows fell 3.2% of $193 million, with similar rates of decline across both fixed and revolving loans.

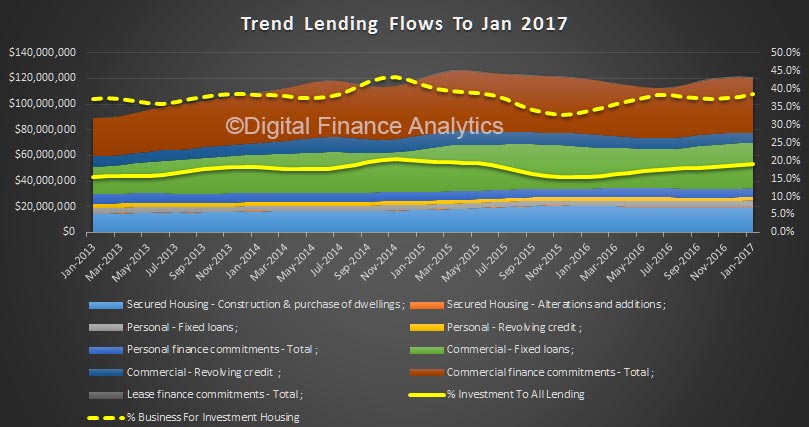
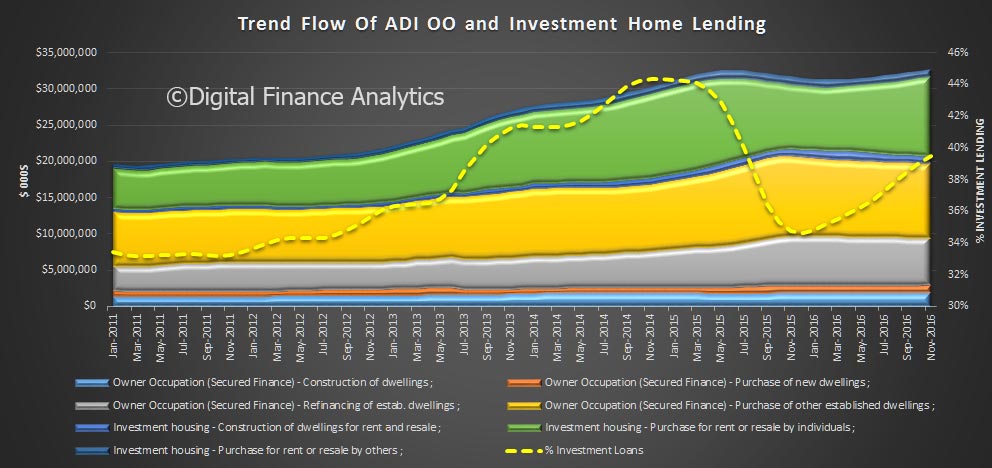
Total commercial lending fell 0.8% of $314 million. Within that lending for investment housing fell 1.5% or $194 million, whilst other fixed commercial lending fell 0.5% or $96 million. Revolving commercial credit fell 0.3% or $24 million.  If business confidence is really so strong, why no growth in borrowing – something does not add up!

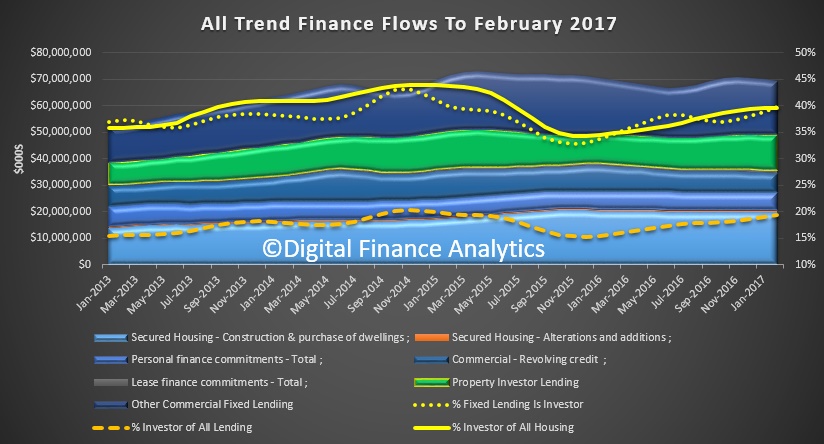
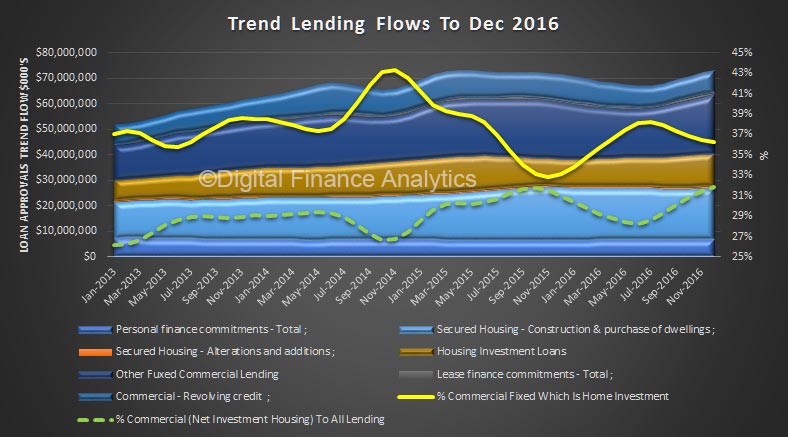
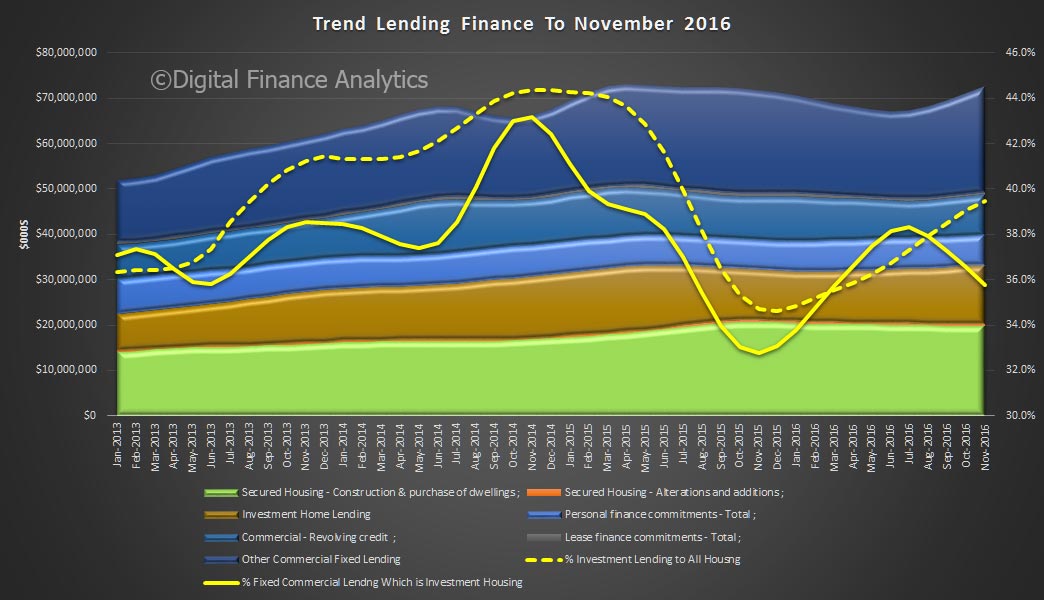
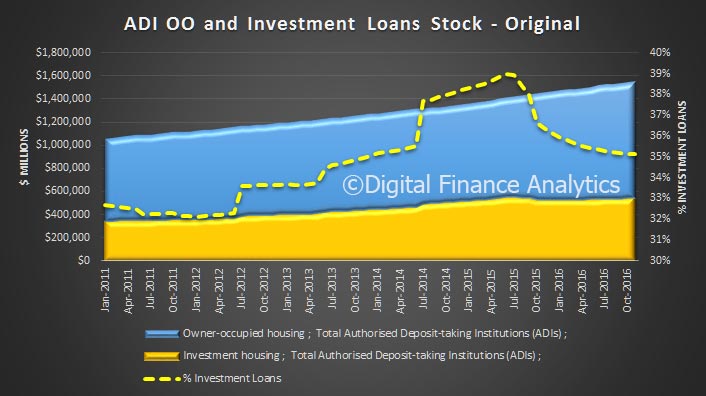
As a result, the total proportion of business lending to total lending stood at 29.9% down from a peak of 30.9% in December 2016. The proportion of investment property lending flows slipped to 18.1% of all lending, and 37.4% of all housing lending.

So whilst the regulatory tightening is crimping demand for investor finance, it is not being replaced with a rise in productive business lending, so commercial finance has fallen. This will put downward pressure on growth, at a time when mortgage interest rates are rising. We cannot see how the future growth expectations from the RBA are going to be met on these figures.

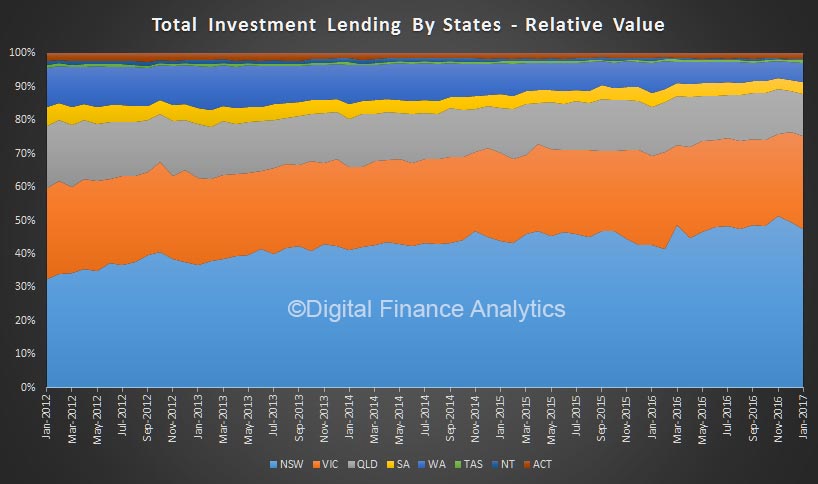
It is clear however, that secured lending for owner occupation which is up a little, will not fill the void. Interestingly the state by state figures show that investor lending remains strongest in the two overheated markets of Sydney and Melbourne. Much of the fall in investment sector lending resides in the other states, who are already experience economic pressure.

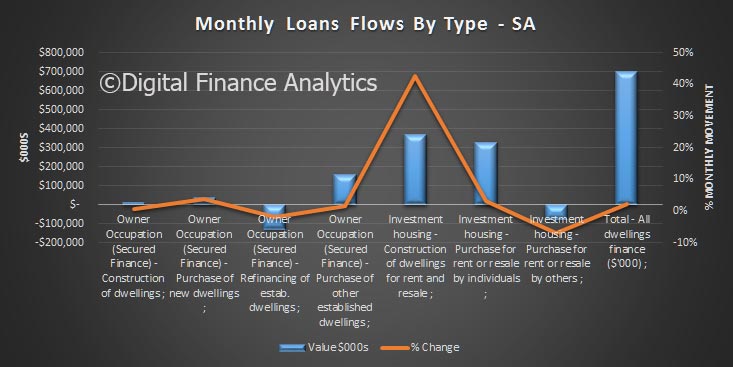
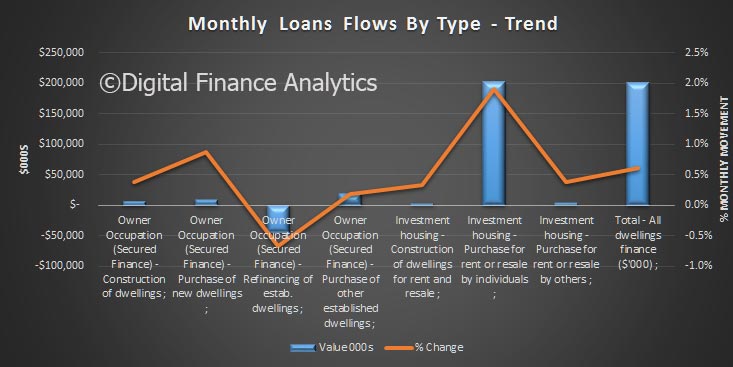
The total value of owner occupied housing commitments excluding alterations and additions rose 0.4% in trend terms, and the seasonally adjusted series rose 2.9%.

The trend series for the value of total personal finance commitments fell 3.2%. Fixed lending commitments fell 3.2% and revolving credit commitments fell 3.1%.

The seasonally adjusted series for the value of total personal finance commitments fell 0.5%. Revolving credit commitments fell 3.1%, while fixed lending commitments rose 1.2%.

The trend series for the value of total commercial finance commitments fell 0.8%. Fixed lending commitments fell 0.9% and revolving credit commitments fell 0.3%.

The seasonally adjusted series for the value of total commercial finance commitments fell 6.4%. Revolving credit commitments fell 12.5% and fixed lending commitments fell 4.9%.

The trend series for the value of total lease finance commitments fell 3.3% in May 2017 while the seasonally adjusted series rose 1.1%, following a rise of 4.3% in April 2017.

Lending Finance In March Still About Housing

The ABS released their lending finance statistics for March 2017.  We see the problem again of not enough productive commercial lending, as banks chase property lenders. Revolving commercial credit did rise.

Overall trend finance flow in trend terms rose 1.3% to $70 billion, up $691 million. Within that, the total value of owner occupied housing commitments excluding alterations and additions rose 0.1% in trend terms, to $20.1 billion, up $26 million; and the seasonally adjusted series rose 0.9%.

The trend series for the value of total commercial finance commitments fell 0.3% to $42.3 billion, down $142 million. Fixed lending commitments fell 1.4% down $461 million to $33.5 billion, while revolving credit commitments rose 3.8%, up $319 million to $8.8 billion.

The seasonally adjusted series for the value of total commercial finance commitments rose 13.0%. Revolving credit commitments rose 36.8% and fixed lending commitments rose 7.1%.

Within the fixed commercial lending category, lending for investment housing fell 0.3%, down $44 million to $13.2 billion, whilst lending for other commercial purposes fell 2%, down $416 million to $20.3 billion. 39% of fixed commercial lending was for investment housing and this continues to climb.  Most of the investment in housing was in Sydney and Melbourne.

Once again the rise unproductive investment housing lending does not support true growth, and continues to create more pressure on home prices.

The trend series for the value of total personal finance commitments fell 1.3%. Fixed lending commitments fell 1.7% and revolving credit commitments fell 0.7%.

The seasonally adjusted series for the value of total personal finance commitments fell 1.7%. Fixed lending commitments fell 3.2%, while revolving credit commitments rose 0.8%.

The trend series for the value of total lease finance commitments rose 1.3% in March 2017 and the seasonally adjusted series fell 13.0%, following a fall of 32.1% in February 2017.

Higher Investment Property Lending Flows In February Offset Wider Falls

The ABS finalised their finance data today with the overall flows for February 2017. It is not pretty. Overall lending flows, in trend terms, which irons out some of the statistical bumps, shows an overall fall of 1% to $62.2 billion in the month.

Looking in more detail, lending for investment property rose 0.7% to $13 billion, whilst other fixed lending to business fell 2.9% to $20 billion.  So overall productive business lending fell again. Not good for productive growth. Actually the bulk of investor lending was in Sydney and Melbourne, highlighting again the lopsided property market, and why investor lending needs real attention from regulators and Government.

As a result of this, the proportion of fixed business lending for investment housing rose again, to 39.7%, and the share of lending for housing investment rose to 19.4%, the highest it has been since 2015

The total value of owner occupied housing commitments excluding alterations and additions rose 0.2% in trend terms, and the seasonally adjusted series fell 0.5%.

The trend series for the value of total personal finance commitments fell 0.3%. Fixed lending commitments fell 0.6%, while revolving credit commitments rose 0.2%.

The seasonally adjusted series for the value of total personal finance commitments fell 3.8%. Fixed lending commitments fell 4.7% and revolving credit commitments fell 2.2%.

The trend series for the value of total commercial finance commitments fell 1.8%. Revolving credit commitments fell 3.2% and fixed lending commitments fell 1.5%.

The seasonally adjusted series for the value of total commercial finance commitments rose 1.8%. Revolving credit commitments rose 25.5%, while fixed lending commitments fell 2.8%.

The trend series for the value of total lease finance commitments rose 6.4% in February 2017 and the seasonally adjusted series fell 31.5%, after a rise of 73.6% in January 2017.

Finally, here are the movements within the housing sector, with falls in new construction and refinance, offsetting rises in investor lending and purchase of existing dwellings.

Investors Rule (For Now)

The latest data from the ABS for Lending Finance in January just reinforces the story that investor loans were so, so strong.  Owner occupation housing finance grew 0.5%, to $20.1 billion, personal finance was up 0.4% to % 6.9 billion and overall commercial lending fell 0.9%, down to $43 billion (thanks to significant falls in non-investment housing)

However, the share of lending for investment properties, of fixed commercial lending rose to 38.4%, the highest proportion since May 2015, and the share of commercial lending for investment property now stands at 19.1% of all lending, again the highest since May 2015.

The individual monthly movements reinforce how strong investment lending was.  There was also a 5.1% fall in revolving commercial lending.

Another view, which looks just at housing confirms the story, with construction lending for investment up 5%, and investment lending for investment up well over 1%.

The state level data also confirms that the bulk of the investment property lending is in Sydney and down the east coast to Melbourne.

We say again, this is not good news, because such strong growth in finance for investment properties simply inflates banks balance sheets and home prices, raises household debt, and escalates systemic risks. We need to funnel investment into productive business enterprise, not more housing.

Expect regulatory intervention soon.  Better (very) late than never.

Lending Still Running Ahead Of Inflation

The latest release from the ABS provides lending flow data to December 2016. It reconfirms the growth in investment property loans at 36% of commercial lending (especially in Sydney which is at a 5 month peak), but also reveals more momentum in lending for other commercial proposes, (potentially a good thing if for productive business purposes) and a Christmas led growth in personal debt. Total trend borrowing grew 1.52%  or $1.9 billion in the month (which would be a 12 month rate of 18.3%), way ahead of the current inflation rate of an annual (yes annual) rate of 1.5%! Total debt flows rose to $73 billion in the month. Australia is borrowing its way to obviation.

Looking in more detail at the trend data (which smooths out the monthly noise), owner occupied loans rose just 0.2% to $20 billion, lending for property alterations fell 0.6%, and personal finance rose 0.69% to $6.9 billion (fixed loans were up 0.52% to $4.4 billion and revolving loans/credit cards rose 0.97% to $2.5 billion.

Investment housing loans rose 1.68% to 13.2 billion, (equivalent to an annual rate of 20.2%) other commercial fixed lending rose 2.86% to $23 billion and revolving commercial loans rose 1.62% to $8.7 billion.

Recent regulator moves are likely to slows investment housing lending in the next few months, but households are burdened with massive debts, which will start to bite should interest rates rise.

Meantime bank shareholders will be “laughing all the way TO the bank” thanks to higher loan volumes and improved margins following recent out of cycle rate rises.

Credit Grew In November 2016 Thanks to Commercial Flows

The latest trend finance data from the ABS shows that total lending flows were up in November 2016. Overall $72 billion of credit was written, up 2.3% from the previous month, thanks to momentum in the commercial sector.

Within that, secured lending for residential construction and purchase was $19.8 billion, down slightly from October, whilst finance for alterations and additions rose 0.13%. Personal finance grew just a little, at 0.07%.

Looking at total fixed business lending, this grew $1.4 billion, up 3.74% to $45 billion, comprising  a rise of $1.2 billion, or 5.26% to $23.2 billion for commercial lending other than housing investment, and $0.2bn for investment housing, up 1.6%, to $12.9 billion.

Revolving business credit flows grew 2.95% to $8.9 billion, and leasing rose 0.19% to 0.5 billion.

So we see a rise in investment housing lending to 39.5% of all housing lending flows, driven by strong growth in NSW mainly, and a slowing in owner occupied lending. We also see an overall rise in business lending, even after isolating investment lending. We need to see ongoing growth in non-housing related business investment if economic momentum is to be sustained.

Home Lending On The Rise

The latest housing finance data from the ABS underscores the renewed momentum in home mortgage lending, especially in the investment sector, and there was also a rise in first time buyers accessing the market.

  • The trend estimate for the total value of dwelling finance commitments excluding alterations and additions rose 0.6%. Investment housing commitments rose 1.7%, while owner occupied housing commitments was flat.  In seasonally adjusted terms, the total value of dwelling finance commitments excluding alterations and additions rose 2.2%.
  • In trend terms, the number of commitments for owner occupied housing finance fell 0.1% in November 2016 whilst the number of commitments for the purchase of new dwellings rose 0.7%, the number of commitments for the construction of dwellings rose 0.2%, and the number of commitments for the purchase of established dwellings fell 0.2%.
  • In original terms, the number of first home buyer commitments rose by 13.4% to 8,281 in November from 7,302 in October; the number of non-first home buyer commitments also rose. The number of first home buyers as a percentage of total owner occupier commitments rose from 13.7% to 13.8%.

Total commitments in trend terms was $32.7 billion, of which $19.8 billion was owner occupied loans, and $12.9 billion for investment purposes. 39.5% of new lending was for investment purposes, and we see the proportion of investment loans continuing to rise, it is already too high.

Looking at the month on month movements, the seasonally adjusted changes highlight the rise in the investment funding for new construction, with a 40% rise on last month. Owner occupied refinancing fell.

The more reliable trend analysis shows the monthly movements, with a strong surge in investment loans by individuals, and a stronger fall in owner occupied refinancing.

Looking at total loan stock (in  original terms) around 35% of all loans outstanding are for investment purposes, and the slide we saw late 2015 appears to be easing.

Turning to the first time buyer, original data, the number of first time owner occupied buyers rose compared with last month, and the overall mix also increased.

Combining the first time buyer property investor data from our surveys, we see a spike in overall first time buyer activity.

Last month, around 1,100 more first time buyers entered the owner occupied market than the prior month (12%), and around 150 more in the investment sector.  We also saw a rise in the fixed rate loans, as borrowers try to lock in lower rates ahead of expected rises.

So overall, still strong momentum in the housing sector, and powered largely by an overheated investment sector.


Is Business Lending Momentum On The Turn?

The latest data from the ABS, Lending Finance for October 2016, shows total credit flows in October were $68.1 billion, up 0.72% compared with last month, in the more reliable trend terms. Within that, the total value of owner occupied housing commitments excluding alterations and additions fell 0.5% in trend terms, to $19.7 billion. Alterations and additions, fell 0.5%.

The trend series for the value of total personal finance commitments fell 1.2%. Revolving credit commitments fell 3.5%, while fixed lending commitments rose 0.1%. Total personal finance flows fell to $6.6 billion.

The trend series for the value of total commercial finance commitments rose 1.7% to $40.9 billion. Fixed lending commitments rose 2.0% to $32.8 billion and revolving credit commitments rose 0.4% to $8.1 billion

The trend series for the value of total lease finance commitments rose 0.1% in October 2016 and the seasonally adjusted series fell 11.8%, after a rise of 10.1% in September 2016.

What is possibly significant is that within the fixed business lending category, we have a combination of lending for investment property and lending for other business purposes. We are beginning to see a rise in other business lending, alongside lending for investment property. We need to see more of the former, and less of the latter.

Lending for investment property rose 1.5% to $12.5 billion, whilst lending for other business purposes rose 2.3% to $20.3 billion. As a result, the share of lending for business (other than for investment property) rose, whilst the share of commercial lending for investment property fell from 38.2% to 38%.

Looking at the investment property data, investors were hot to trot in Sydney, and Melbourne. Much of the investment property remains in these two centres.

Investment Lending Stronger In Latest Finance Data

The latest data from the ABS on all lending flows shows the continued rise in investment housing, offset by a fall in owner occupied lending, and a small rise – housing apart – in commercial finance. Growth, other than for investment housing is insipid. We are walking a tightrope.

Overall lending flows, in trend terms, rose 0.1%, to $66.9 bn. Owner occupied housing commitments excluding alterations and additions fell 0.5% in trend terms. Total personal finance commitments fell 1.5% (within which revolving credit commitments fell 3.7%, and fixed lending commitments fell 0.1%). Total commercial finance commitments rose 0.6% with fixed lending commitments up 1.0%, while revolving credit commitments fell 0.6%. The value of total lease finance commitments rose 1.0%.

But looking at commercial lending (which includes both lending to investment property purchasers, and lending for other commercial purposes) we see lending for housing investment rose a massive 1.3% to $12.2bn, whilst lending for other commercial purposes rose 0.7% to $19.1bn. So the strongest growth was in investment housing.

housing-fin-sept-2016-all-flows-2As a result, the key ratios show a rise in investment lending as a proportion of the total, to 18.3%, a fall in owner occupied lending at 30.2% and non housing commercial up a little at 28.6%. Clearly without the surge in investment lending, total lending would have fallen.

housing-fin-sept-2016-all-flowsThe same story is told looking at the more detailed housing series. Investment lending rose from 37.2% to 37.6% of flows ($12.2 bn), whilst refinance fell slightly to 20.8% ($6.7 bn). Funding for new buildings for owner occupied, and construction rose 0.4% ($2.8 bn), whilst purchase of established dwellings fell 0.8% and refinance ($6.7 bn) fell 0.5%.

On the investment side, new construction fell 8.7% (0.9 bn) whilst purchase of existing housing stock rose 2.4% to $10.2 bn. The momentum was strongest in NSW and VIC.

This shows the dilemma for the RBA. The main growth engine in terms of credit is investment lending, yet this is the higher risk, and more concerning area of lending because if capital growth were to slow or reverse many investors would vote with their feet. We are on the edge of a precarious ridge, on one side is the slide into risky lending, on the other is the need for growth (at any cost). The pathway appears to becoming narrower, and the room more maneuver smaller.  It is “the sharp edge” of policy.

We need to find a way to boost business lending, other than for investment housing. Current settings do not help. Cutting rates further will not either, and in all likelihood, the next turn in interest rates will be higher.


Who Says Home Lending Is Easing?

The RBA Financial Stability Review, released today, says

Risks to financial stability from lending to households have lessened a little over the past six months, as serviceability metrics and other lending standards have continued to strengthen and the pace of credit growth has slowed. Housing price growth is also slower than it was a year or so ago, although it has picked up a little in Sydney and Melbourne in recent months. The risk profile of new borrowing has improved further. The share of new high loan-to-valuation (LVR) lending and interest-only loans has fallen; high-LVR lending is now at its lowest share in almost a decade.

Nonetheless, the household debt-to-income ratio is still drifting higher, even after adjusting for the rapid growth of balances in offset accounts. Non-performing mortgage loans have also picked up nationally but remain low. This pick-up has been most pronounced in mining areas where housing market conditions have deteriorated sharply, though only a small share of banks’ mortgage lending is to these areas.

But, the latest release from the ABS seems to tell a rather different, and more disturbing story. I will focus in the trend series, which irons out month on month distortions.

In trend terms owner occupation loans fell 0.9% compared with the previous month, to $19.8 bn, personal finance fell 0.8% to $6.9bn and commercial finance fell 0.7% to $38.3bn. But this does not tell the full story.

Here are the month on month movements by a more granular set of categories. The only segment which rose was lending for housing investment purposes (which is reported within the commercial sector numbers). This rose 1%, t0 $11.9 bn. Other lending for commercial purposes, excluding for housing investment fell, commercial fixed loans fell 0.5% to $18.6 bn and revolving commercial credit fell 3.6% to $7.7 bn.

abs-finance-aug-2016Therefore the total fixed commercial credit (sum of housing investment loans and other commercial fixed loans) netted off with a rise of 0.04%.

All other lending categories saw a fall in month on month movements, owner occupied housing indeed fell 0.9% $19.8 bn.

Turning to the trend analysis, the chart below shows a fall in overall lending, but the mix of lending is the main concern. The only thing holding up bank lending is growth in the investment property sector, whilst the rest of the commercial sector continues to borrow less. The ratio of fixed commercial lending for investment housing has moved up from 31% in 2012 to 39% now, whilst the proportion of lending for productive commercial investment has fallen from 69% in 2012 to 61% now. Another way to look at it is commercial lending, excluding for housing has fallen to 40% of all lending, from 46% in 2012.

abs-finance-aug-2016-trends So, it is momentum in investment lending which is supporting overall lending, which would have otherwise fallen significantly, but this is not a productive activity. The lack of business investment growth is hobling overall economic outcomes, whilst our housing stock value, and bank balance sheets are artificially being inflated.

This mix of lending and the implications, is what the RBA should be discussing. Ultra-low interest rates are not helping to restore productive growth.

Also, it is worth bearing in mind, interest only loans tend to be used by property investors to maximise their tax refunds, one reason why more are being written than earlier in the year.