Home Loans Still Rising Too Fast

The latest monthly banking statistics for July 2017 from APRA are out. It reconfirms that growth in the mortgage books of the banks is still growing too fast. The value of their mortgage books rose 0.63% in the month to $1.57 trillion. Within that, owner occupied loans rose 0.73% to $1,017 billion whilst investor loans rose 0.44% to $522 billion.
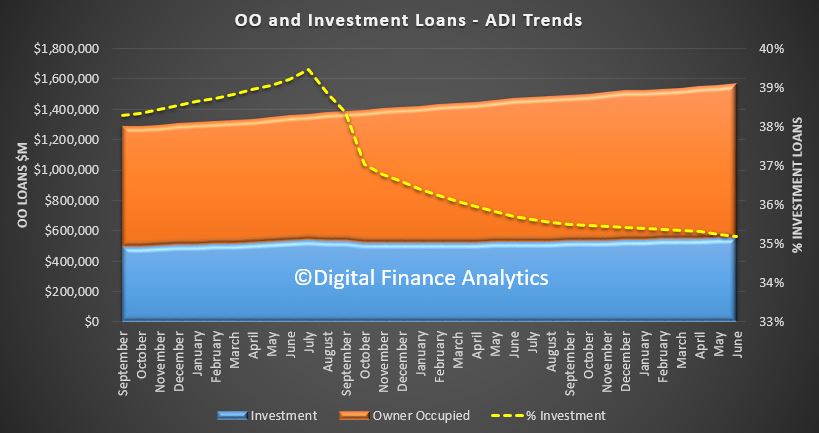
Investor loans were 35.18% of the portfolio.

The monthly growth rates continues to accelerate, with both owner occupied and investor loans growing (despite the weak regulatory intervention).  On an annual basis owner occupied loans are 6.9% higher than a year ago, and investor loans 4.8% higher. Both well above inflation and income growth, so household debt looks to rise further. The remarkable relative inaction by the regulators remains a mystery to me given these numbers. Whilst they jawbone about the risks of high household debt, they are not acting to control this growth.

Looking at individual lenders, there was no change in the overall ranking by share.

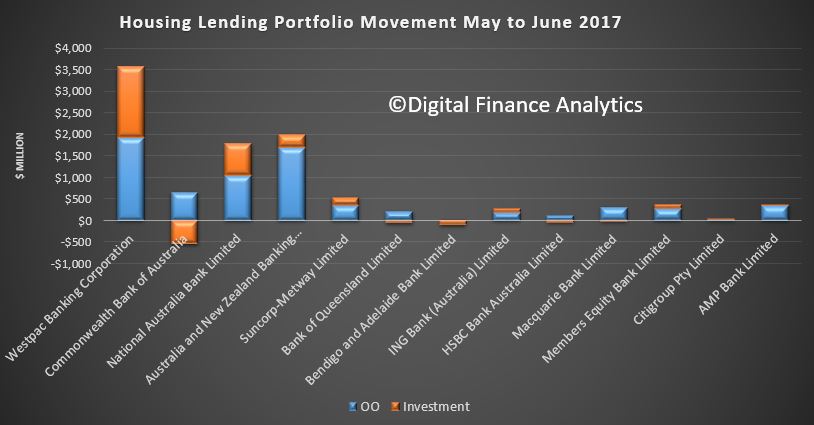
But interestingly, we see significant variations in strategy working through to changes in the majors month on month portfolio movements.

ANZ has focussed on growing its owner occupied book, WBC is still in growth mode on both fronts, whilst CBA dropped their investor portfolio. We also saw a number of smaller lenders expand their books.
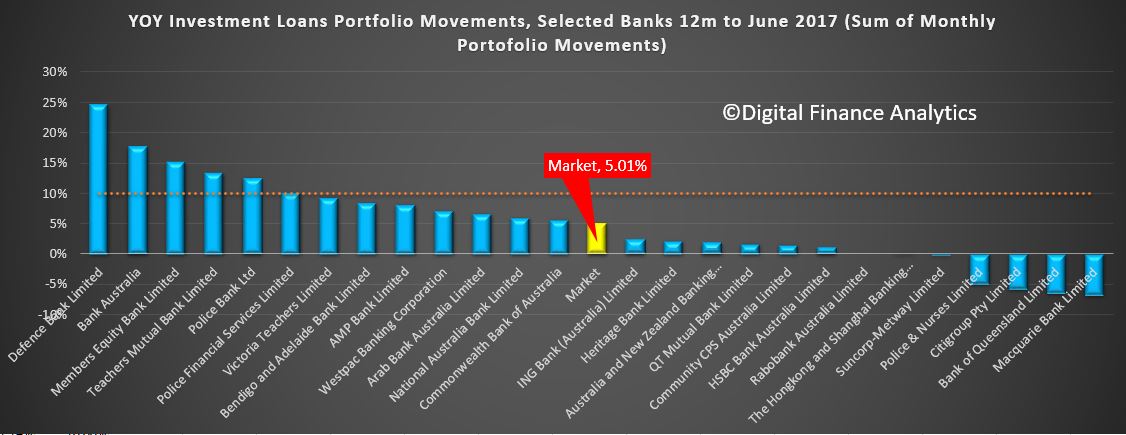
Looking at the speed limit on investor loans – 10% is too high -we see the investor market at 5% (sum of monthly movements), with all the majors well below the limit. But some smaller players are still growing faster.
We have to conclude one of two things. Either the regulators are not serious about slowing household debt growth, and the recent language is simply lip service (after all the strategy has been to use households as the growth engine as the mining sector faded), or they are hoping their interventions so far will work though, given time. Well given the recent auction results (still strong) and the loan growth (still strong) we do not believe enough is being done. Time is not their friend.

Indeed, later this week we will release our mortgage stress update. We suspect households will continue to have debt issues, and this will be exacerbated by interest rate rises in a flat income, high cost growth scenario many households are facing. The bigger the debt burden, the longer it will be to work through the system, with major economic ramifications meantime.

The RBA data will be out later, and we will see if there have been more loans switched between category, and whether non-banks are also growing their books. Both are likely.



Mortgage Lending Remains Too Strong

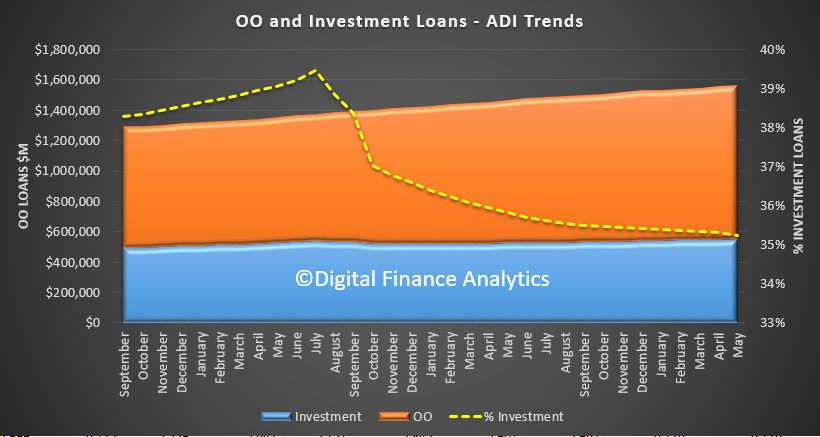
The monthly banking stats from APRA for May 2017 were released today. The banks lifted their mortgage books by $9.2 billion to $1.56 trillion, up 0.6% in the month, still well ahead of income growth, thus household debt is still rising. The APRA controls are not strong enough.

Within this, owner occupied loans grew 0.7% to $1,010 billion and investment loans grew 0.42% to $549.9 billion (higher than the 0.39% last month). The proportion of loans for investment purposes stands at 35.4% on  a portfolio basis.

Growth is accelerating, supported by stronger owner occupied lending – as expected seeing the change of emphasis we have seen from the banks.

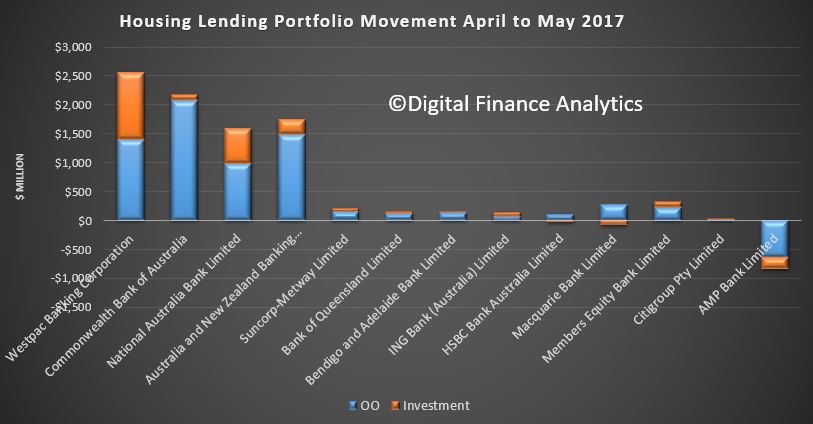
Looking at the individual lenders, Westpac wrote the most investment loans (which may explain their recent moved to tighten criteria and reduce loan types).

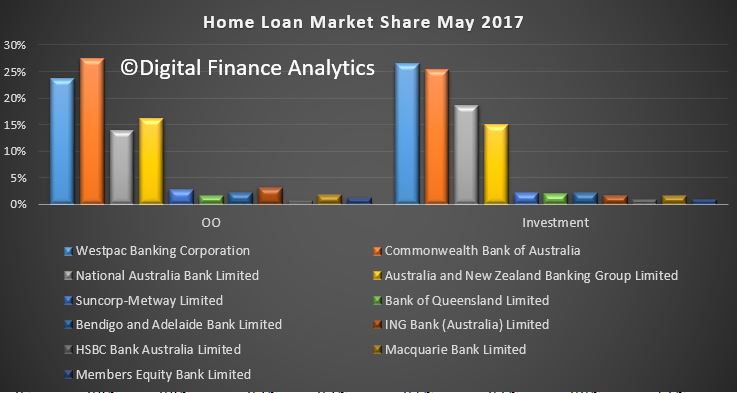
There were small changes in market share, with CBA leading the way on owner occupied lending, and Westpac on investment loans, suggesting different risk profiles.

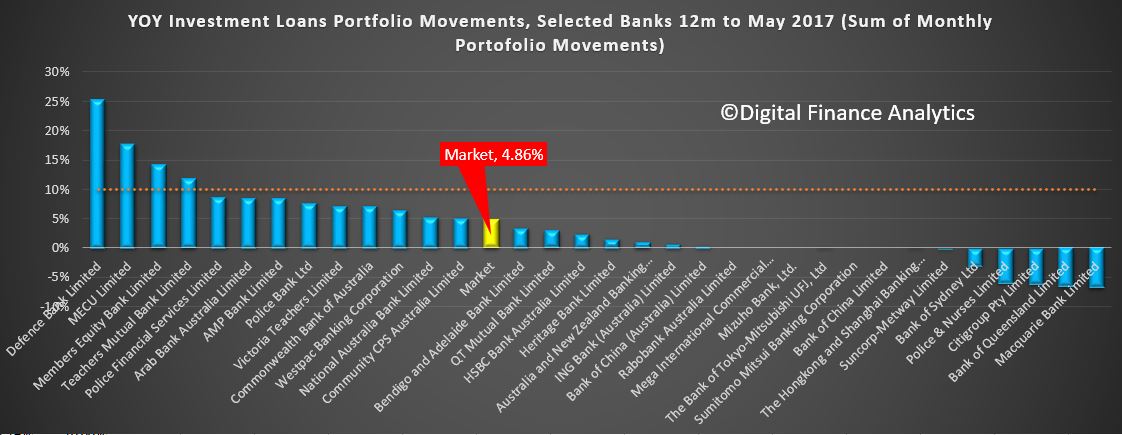
Finally, looking at the APRA speed limit, of 10%, the 12 month market growth for investment lending is sitting at 4.8% (sum of the monthly movements, as we still see a number of lenders above the limit, but not the majors.

A caveat, of course APRA uses its internal measures to assess growth, which may not be the same as the public disclosures.

So, we think further steps need to be taken to cool the mortgage market – too much debt is being loaded on to households in a rising interest rate, low/no income growth environment.  This also suggests home prices will continue to rise, after recent slowing trends were reported.

The RBA will release their credit aggregates shortly, and this will give a whole of market view. But debt growth just cannot continue at these levels.

Bank Mortgage Up To $1.55 Trillion

The latest data from APRA, the monthly banking statistics for April 2017, shows that mortgage book growth is still well above inflation and income growth, at 0.5% in the month. Total loans are now $1.55 trillion, up from $1.54 trillion last month and 4.5% across the 12 months.

An additional $8 billion of net loans were added, with owner occupied loans accounting for $5.8 billion and investment loans $2.1 billion.

Investment loans are 35% of the portfolio.

Looking at the monthly trends, we see that the growth in investment loans slowed slightly, rising by 0.39%, whilst owner occupied lending accelerated, rising by 0.59%. Overall growth was 0.5%.

Looking at the lending profiles, CBA grew their book the most, followed by ANZ. Members Equity Bank and AMP Bank also grew quite fast and above portfolio.

CBA still leads the owner occupied market, and is continuing to chase down Westpac in the investment sector, though has not yet overtaken.

Finally, looking at 12 month portfolio growth for investment loans, the majors are well under the APRA limit. Some smaller players are still speeding.

So, whilst we see some adjustment in terms of risks in the market, growth remains strong, which explains why the auction clearance rates remain strong.

Analysis of the RBA market figures, which includes the non-banks will follow.

Mortgage Lending Strong in March 2017

APRA have just released their monthly banking statistics for March 2017. Overall lending by the banks (ADI’s) rose $7.1 billion to $1.54 trillion, up 0.47% or 7.5% over the past 12 months, way, way ahead of income growth!

Owner occupied  loans grew by 0.49% to $998 billion and investment loans rose 0.43% to $545 billion. No slow down yet despite the recent regulatory “tightening” and interest rate rises. Investment loans are 35.3% of all book.  Housing debt will continue to climb, a worry in a low income growth environment, and unsustainable.

In fact the rate of lending is ACCELERATING!

Looking at the banks share of loans, the big four remain in relatively similar places.

The four majors grew the fastest whilst the regional banks  lost share.

Looking at the investment loan speed limits, the majors are “comfortably” below the 10% APRA limit. Some smaller players remain above.

So, the current changes to regulatory settings are not sufficient to control loan growth. Perhaps they are relying on tighter underwriting and rising mortgage rates to clip the speed, but remember many investors are negatively geared, so rising mortgage interest costs are actually born by the tax payer! The only thing which will slow the loan growth is if home prices start to fall.

The RBA data comes out shortly, this will give a view of all lending, including the non-bank sector (though partial, and delayed).


Banks and Investment Lending – The Non-Bank Winners!

APRA released their monthly statistics for February 2017 today. Overall lending for housing rose 0.4% (which is lower than the market rate of 0.6%, implying the non-bank sector is growing faster, and may account for APRA today saying they wanted to limit the bank’s ability to warehouse mortgages for other lenders prior to their securitisation).

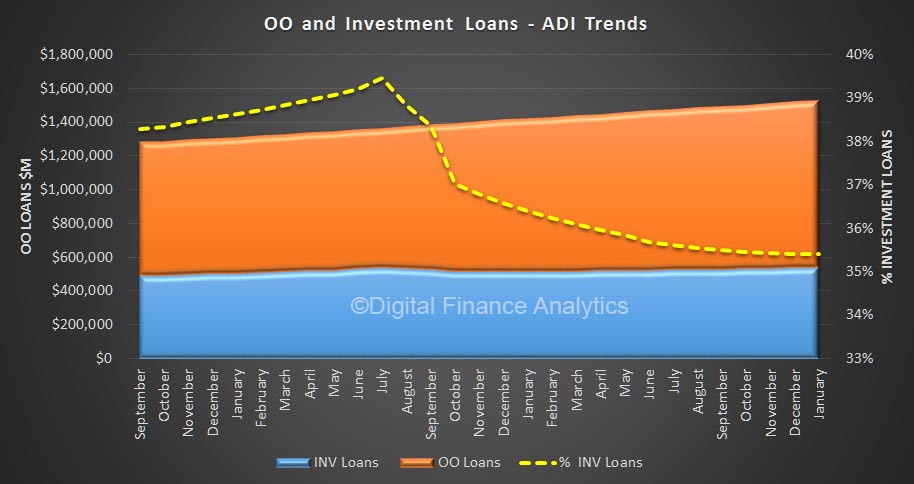
This means the banks total book is now worth $1.54 trillion. Within that owner occupied loans rose 0.48% to $993 billion, whilst investment loans rose 0.33% to $543 billion, or 35.4%.  This tells us that more investors are going to the non-banks – which are not regulated by APRA, but by ASIC as commercial companies – and they do not have the same capital requirements as the banks – this is a major regulatory blind-spot.

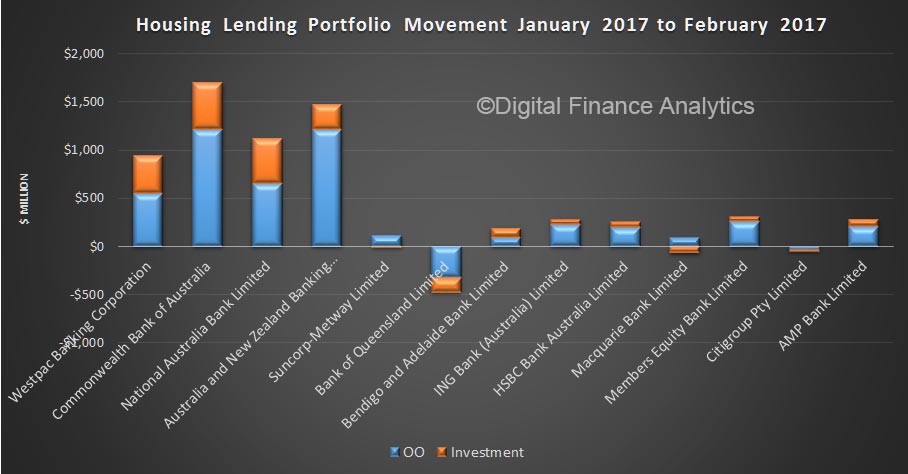
Looking at the ADI’s portfolio movements, CBA wrote the net largest loan volumes, followed by ANZ, then NAB. Westpac had the weakest growth among the big four. Among the smaller players, Bank of Queensland went backwards, whilst ME Bank and and AMP Bank grew relatively strongly.

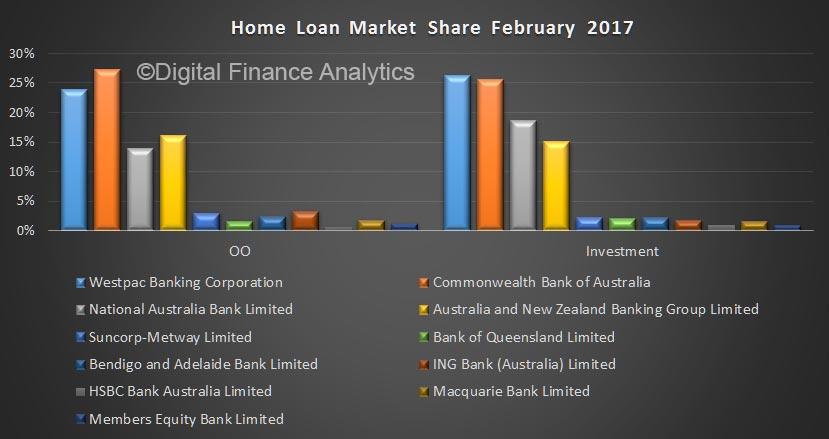
The overall market share of the majors show CBA with the largest share of the OO market, and Westpac still in pole position (just) on investment loans. ANZ has a larger share than NAB of owner occupied loans, whilst in the investment loan sector, the position is reversed.

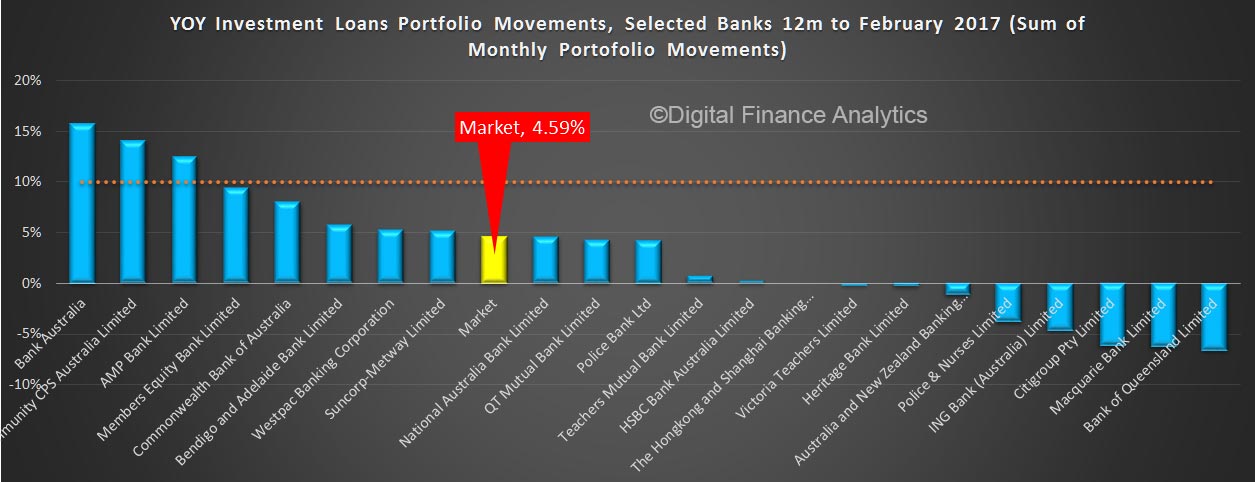
  The APRA speed limit of 10% is higher than the annualised growth rate (which we calculate by summing the monthly movements from APRA), and we see that all the major players are “comfortably below” the 10%.

All in all then, we think the banks will still be writing more investment loans, and as a result, we expect the investor lending party will continue until such time as the tax breaks are reduced (which just might happen in the budget?). Therefore home prices are set to continue to push higher, as household debt rises higher.  In addition, the out of cycle rises on investor loans will bolster bank profits, whilst the additional interest costs will be born by tax payers, as investors who are negatively geared offset the higher borrowing costs. There is nothing here that will fundamentally change the trajectory of the market.

One final point, APRA in their earlier release mentioned the Council of Financial Regulators, the body where the Treasury, RBA APRA and ASIC all sit to discuss strategy, so we have to assume there was agreement to adopt the current stance across these bodies.


ADI’s Still Growing Their Mortgage Books

The latest ADI data from APRA, to end January 2017 shows that the banks  have $1,529 billion in mortgage loan stock, up from $1,523 billion in December, a rise of nearly $6 billion.  The RBA credit number was $1,637.4 billion, up 1% or $15.2 billion, suggesting the non-banks have been more active recently.
When we dig into the mix between owner occupied and investment loans, we need to make an adjustment to the December numbers where ING had (we estimate) about $3 billion of investment loans reported as owner occupied loans. This was reversed this month, so a casual observer will pick a stronger growth in investment loans than is the case. Nothing in the APRA release mentions this significant movement – again!
We think owner occupied loans grew by $3.9 billion and investment loans by $1.7 billion.

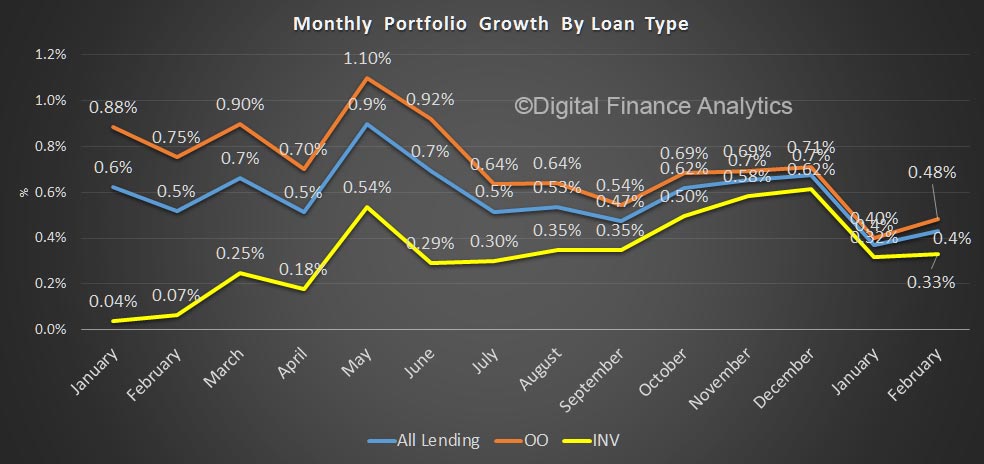
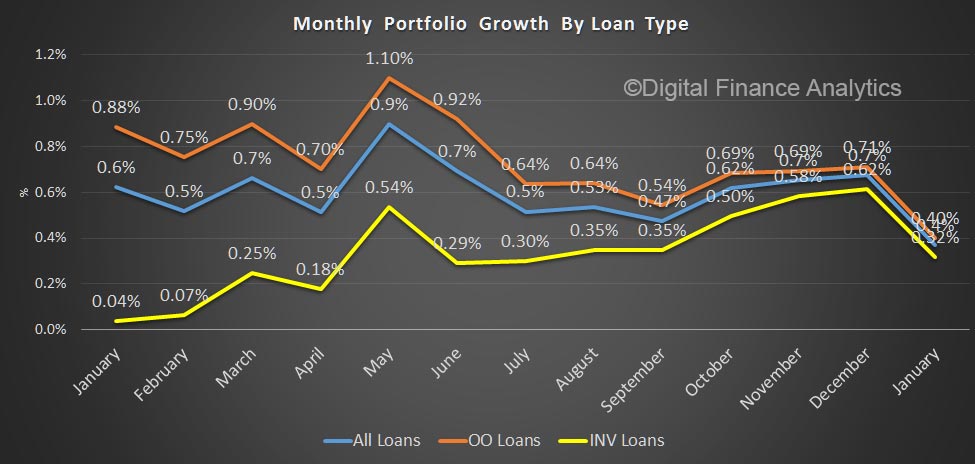
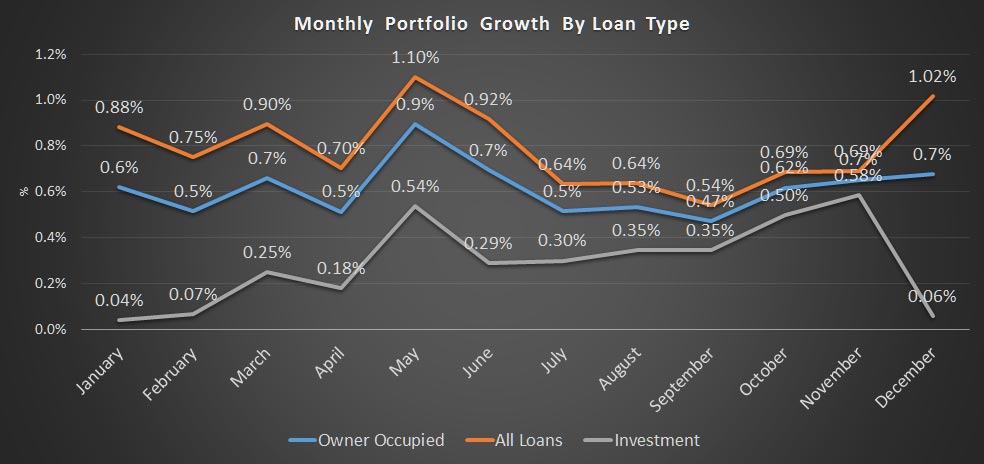
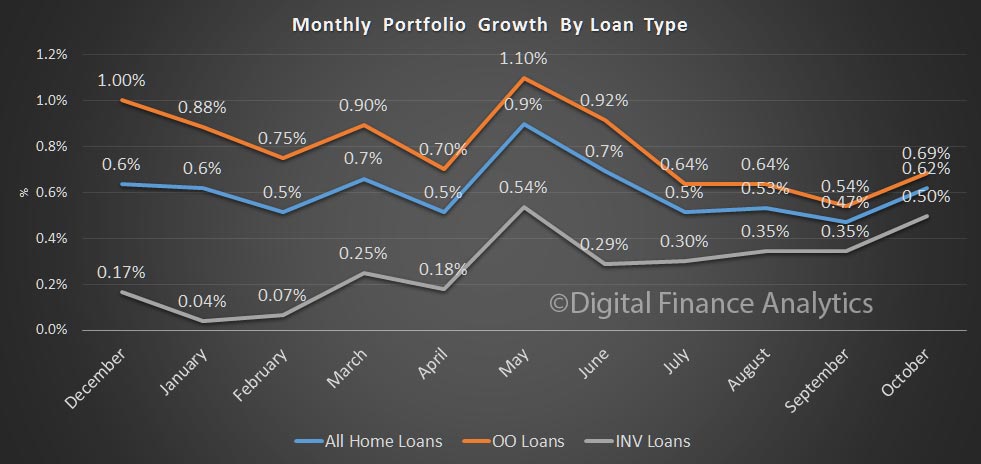
The corrected movements over the months look like this, with average growth around 0.4%, down from December. Given the holidays, no surprise.

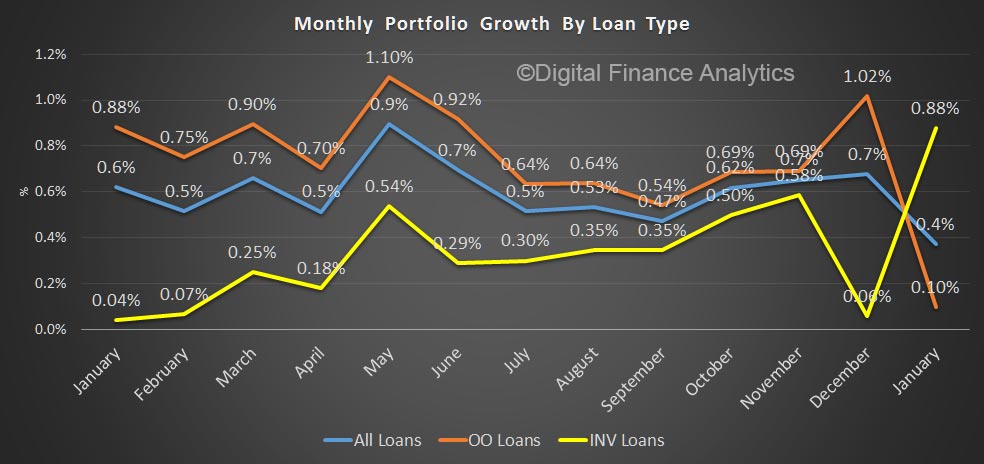
This is the silly chart you get if you do not adjust the ING reversal, with investment loans at 0.9%.

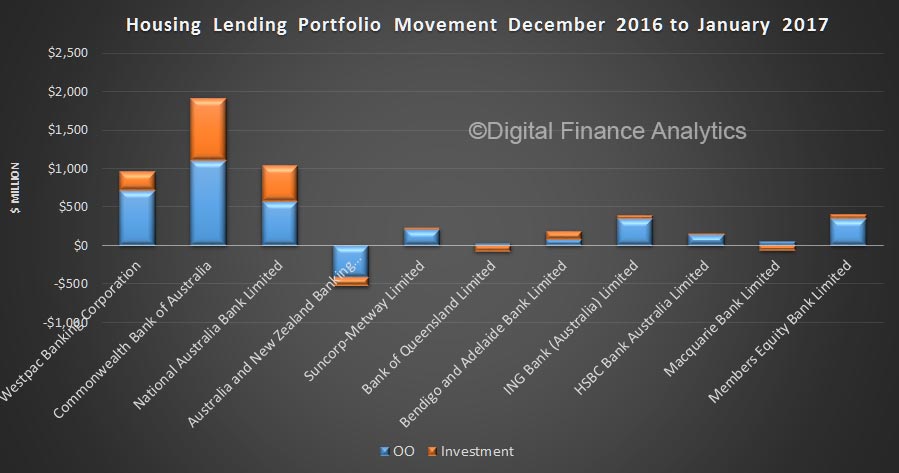
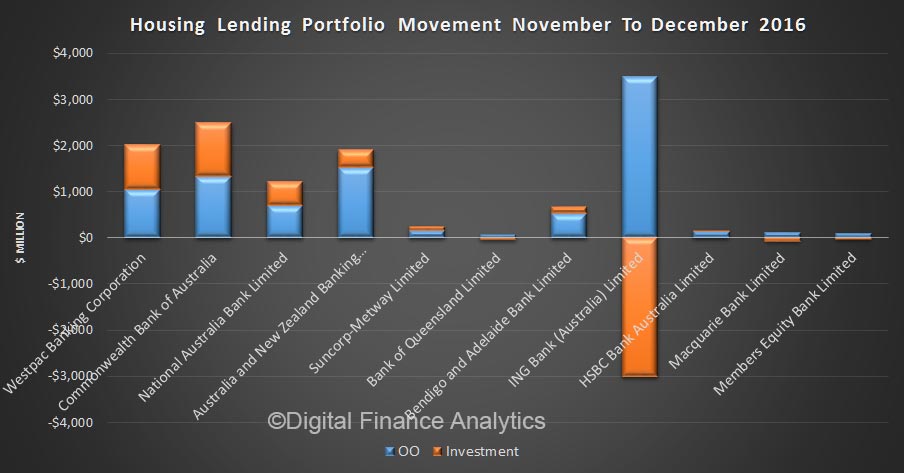
In the month, and using the adjusted data, we see CBA wrote the most loans, with Westpac and NAB in joint second place. ANZ reduced its portfolio a little.

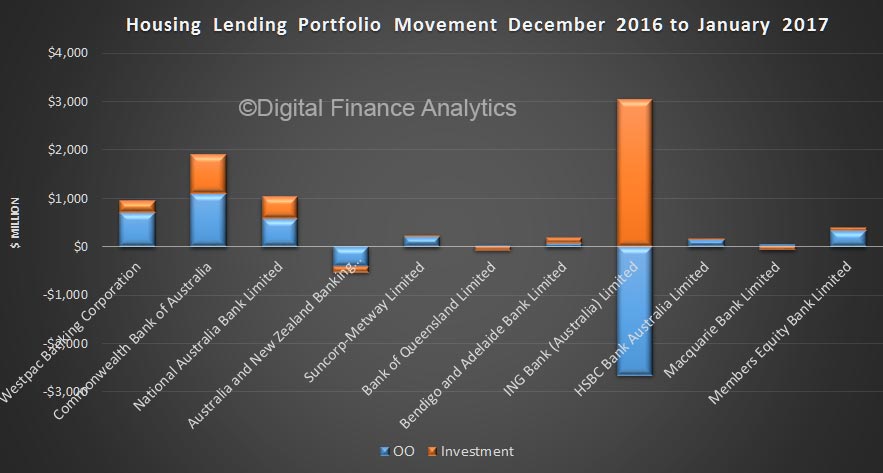
Here is the same data, but now with ING showing the offsetting changes from last month.

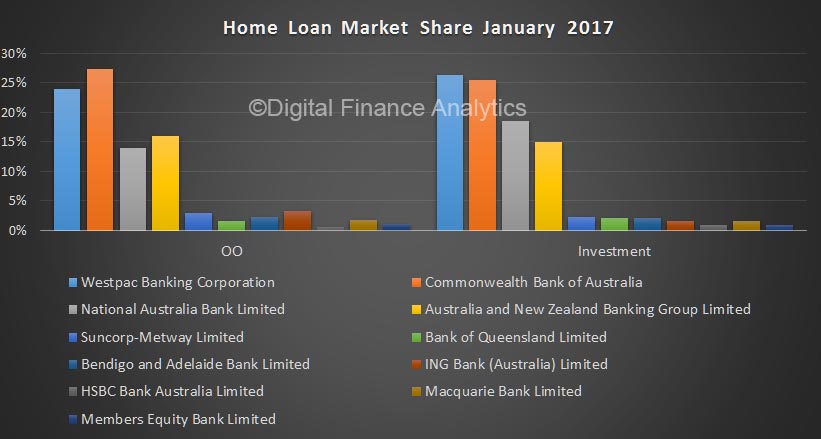
CBA has the largest share of OO loans, and WBC of investment loans, though CBA was catching up prior to the recently announced changes to investment lending policies.

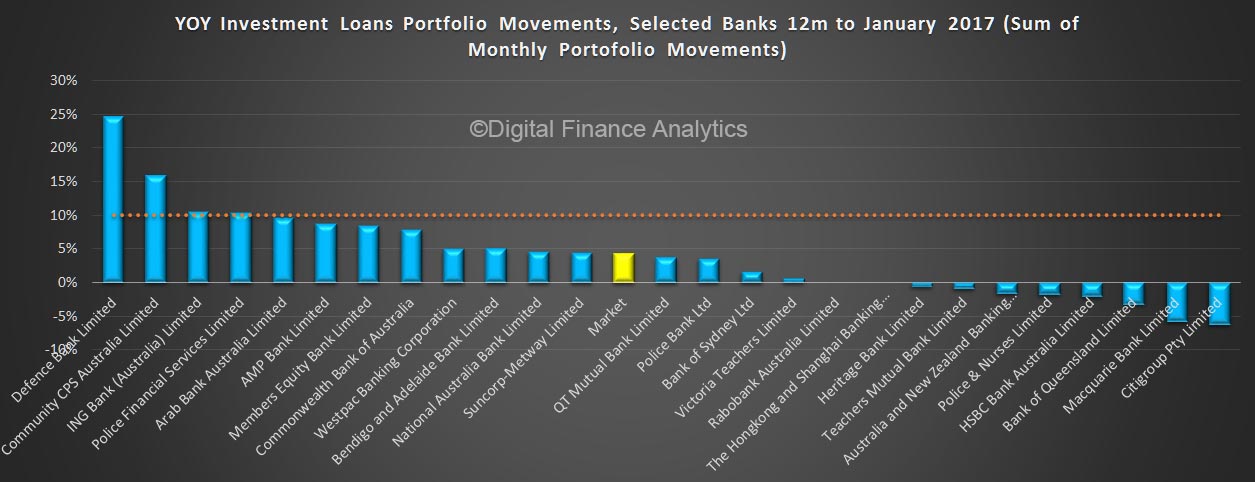
Here is a map of the 10% speed limit. We added a year’s worth of portfolio movements to get this data (though others may choose to gross up the past 3 or 6 months). However, on this basis, CBA is running closer to the 10% speed limit which APRA reconfirmed recently.

Tighter underwriting requirements from APRA are likely to reduce future loan growth, but we reached yet another record in January.


APRA Says Banks Home Lending Up In December … But

APRA has released their monthly banking statistics, which shows the portfolio movements of the major banks. Total lending for housing was up 0.68% to $1.52 trillion, with owner occupied lending up 1% to $987 billion and investment lending up 0.06% to $537 trillion. But there are adjustments in these numbers which make them pretty useless, especially when looking at the mix between investment and owner occupied loans.

The trend here is quite different from the RBA data also out today, which showed growth of 0.8% for investment loans and 0.4% for owner occupied loans (and includes non-banks in these totals). A quick look at the monthly movements shows that there was a significant ($3bn+) adjustment at ING, which distorts the overall picture. No explanation from APRA, and this movement is much bigger than the $0.9 billion net figure the RBA mentioned in their release.

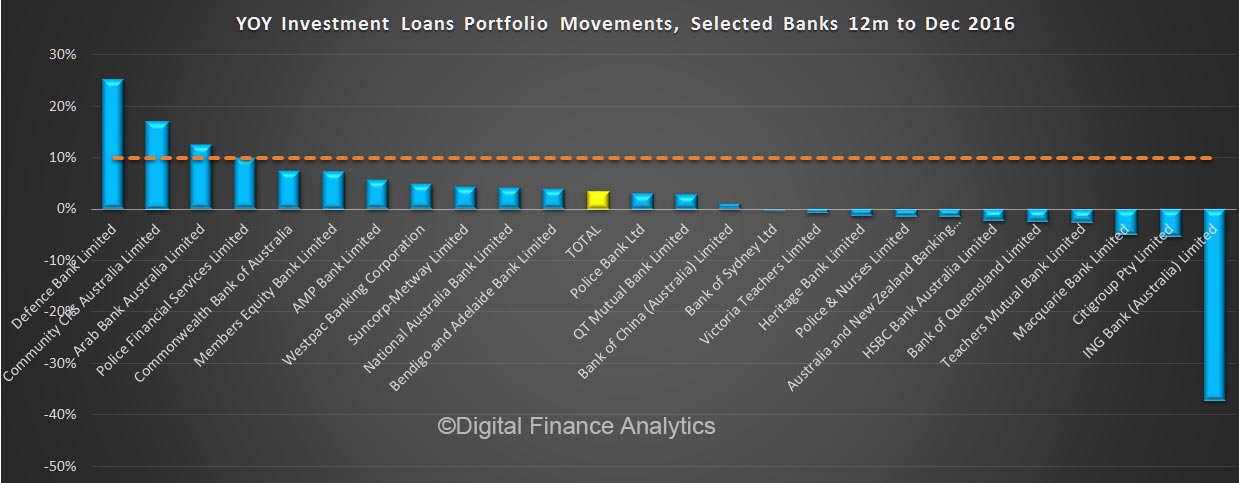
For what it is worth, here is the sorted 12 month growth trend by lending, showing the 10% “hurdle”. ING is to the right of the chart thanks to their adjustment.

But the point is, we really do not know where we stand as i) data quality from the banks is still poor, and ii) the regulators are unable to provide a reconciled and transparent picture of lending. Given the debate about housing affordability, we need better and consistent data to aid the debate.

Bank Home Loan Portfolio Now Up To $1.51 Trillion

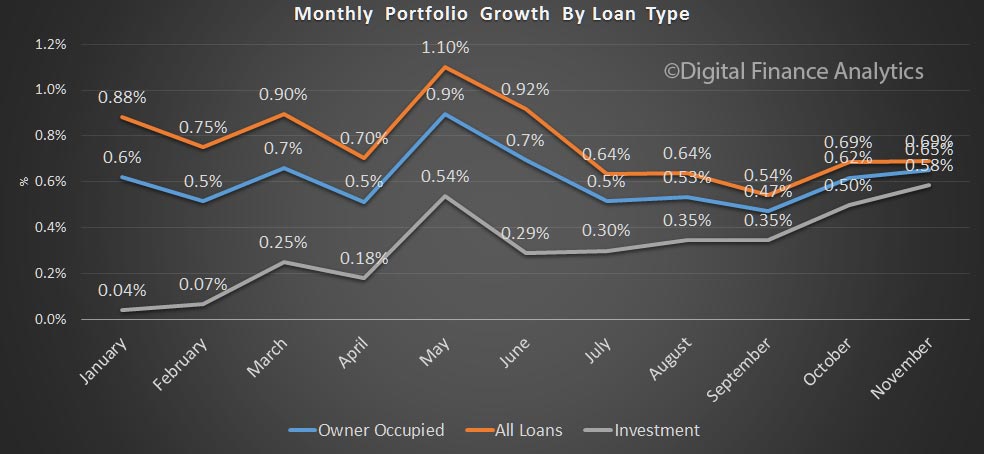
APRA released their monthly banking stats for November 2016.  The total loan portfolio rose 0.65% in the month to a new high of $1.51 trillion. Within that, owner occupied lending rose 0.69% by $6.7 billion, to $977 billion and investment lending rose 0.58%, by $3.1 billion to $536 billion; accounting for 35.44% of all loans. We see investment lending still accelerating (as expected, based on our household surveys).

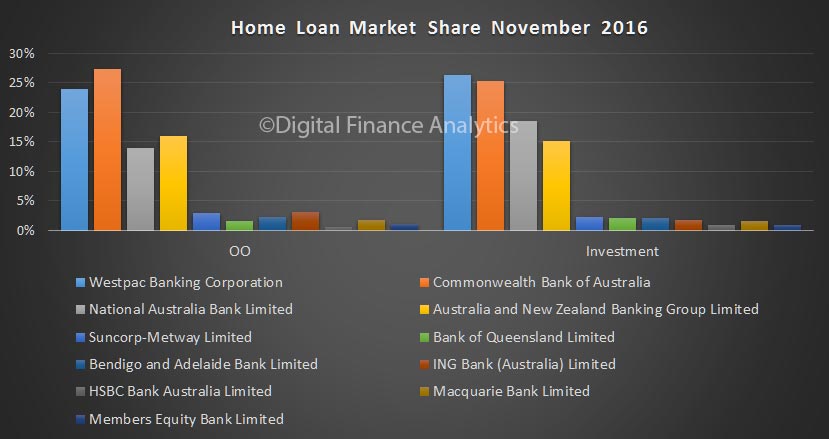
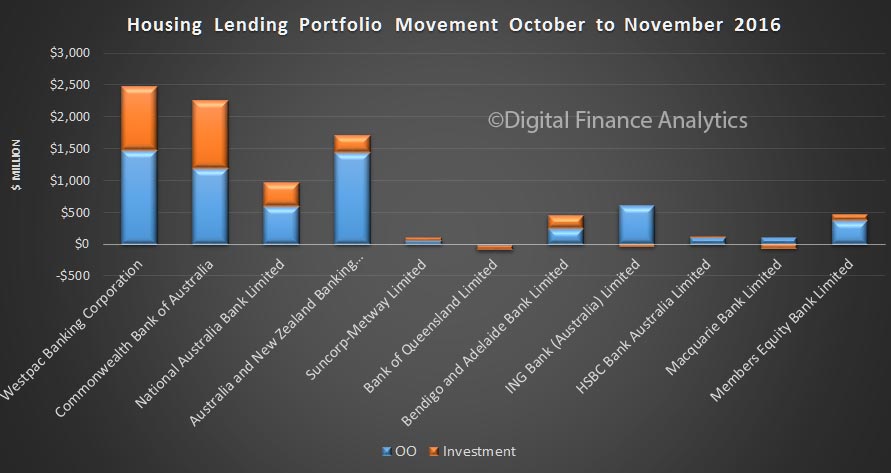
Looking at the individual lenders, CBA wrote more investment loans than WBC in the month, though WBC just holds on to its prime position for investment loans.

Overall WBC wrote the most new business, $2.48 billion. compared with CBA’s $2.26 billion.

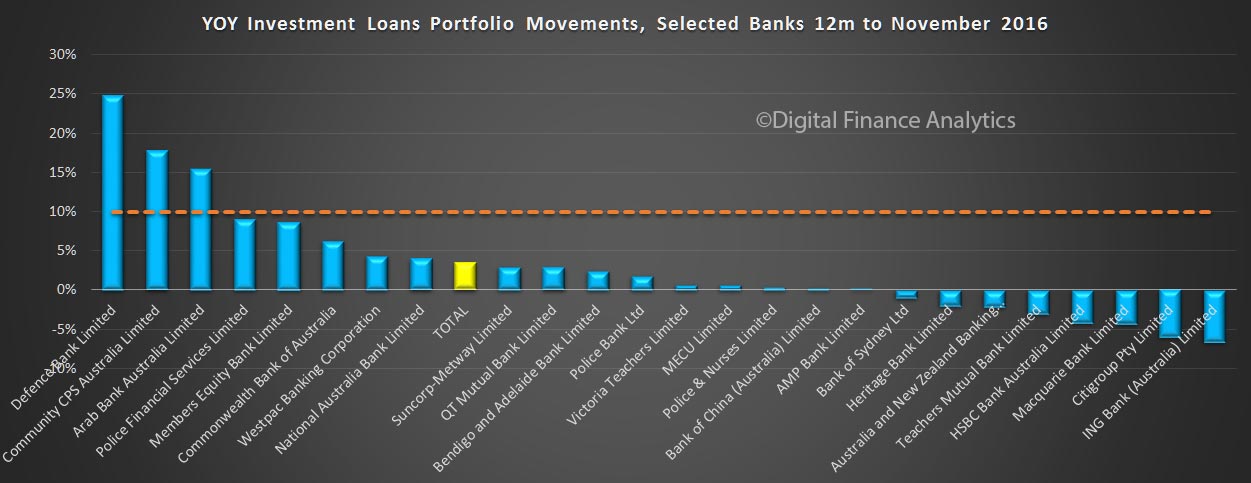
The 12 month system investment portfolio movement is 3.5%, but has accelerated in recent months. Testing against the 10% APRA speed limit, we see that most lenders are well below this threshold. We think the limit should be dropped, as investment loan momentum is too strong, and well above inflation and wage growth. APRA never really explained why they picked 10% – time for more macro-prudential action!

The RBA data will be out soon, so we will see if the market – including the non-banks moved the same way.

Home Lending Momentum Increases In October

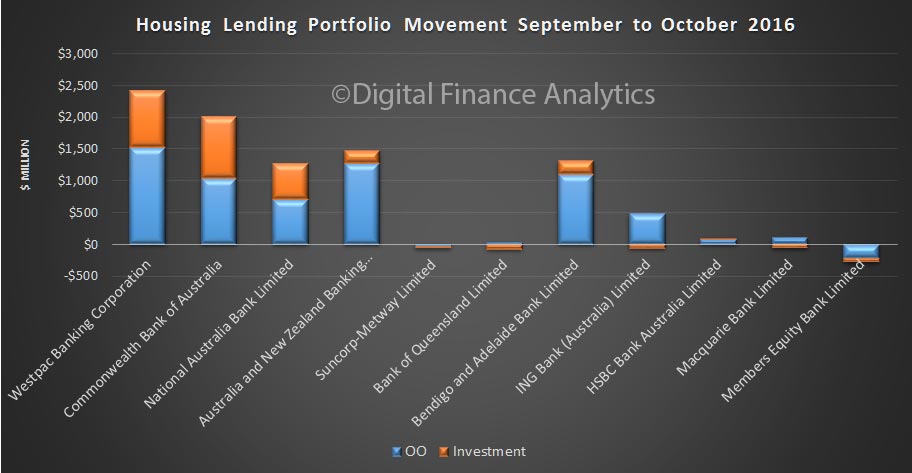
The latest monthly banking statisticsdata from APRA for October 2016 shows the total home lending portfolios held by the ADI’s grew from $1.49 trillion to 1.51 trillion, up 0.62%. Within that, owner occupied loans rose by 0.69% to $970 billion (up $6.6bn) and investment loans rose 0.5% (up $2.6 billion). 35.46% of the portfolio is for investment lending purposes.  Momentum is increasing (and matches the high rate of auction clearances we have seen recently).

apra-oct-2016-all-moveLooking at the individual banks, in value terms, CBA lifted their investment portfolio by $975m, compared with WBC $892m. Bendigo Bank shows an uplift of $1.1bn, thanks to their portfolio acquisition of $1.3bn of loans from WA. Suncorp, Members Equity and Citigroup saw their portfolios fall in value. Macquarie saw a small fall in their investment lending portfolio.

Collectively, the big four grew their investment portfolio by $2.6 billion, and their owner occupied portfolio by $4.5 billion.

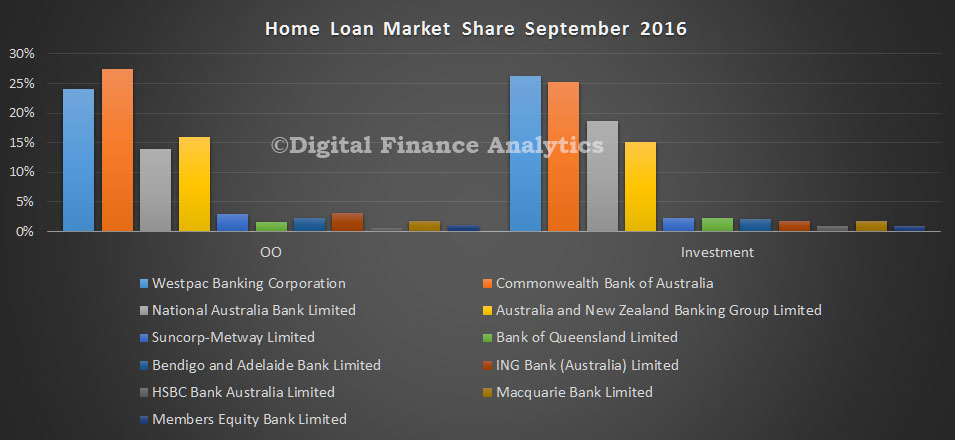
apra-oct-2016-port-moveWestpac and CBA remain the largest home lenders.

apra-oct-2016-mix-moveLooking at the APRA 10% speed limit, based on an average annualised 3m growth rate, the market shows a 3.4% growth in investment lending, with CBA, WBC and NAB all growing faster than system, but below the 10% speed limit.

apra-oct-2016-yoy-3mThis data would indicate that i) further rate cuts from the RBA are off the agenda and ii) they should consider further tightening, using either macroprudential controls, or a rate rise.

We will get the RBA aggregates later today, and we will be able to assess the growth in the non-bank sector, as well as look at the changed classification which took place in the month between investment and owner occupied loans.

Remember that default rates on mortgages are already rising, especially in the mining heavy states, although overall provisions are low at the moment. The banks remain highly leveraged to the housing sector.

Investment Lending On Again

The latest data from APRA for September shows the portfolios of individual banks in Australia as well as details of total loan exposures.

Total lending for housing went to $1.5 trillion, up 7 billion in the month. Of that $5.2 billion was for owner occupation and $1.8 billion for investment loans. As a result 35.5% of loans are for investment purposes.

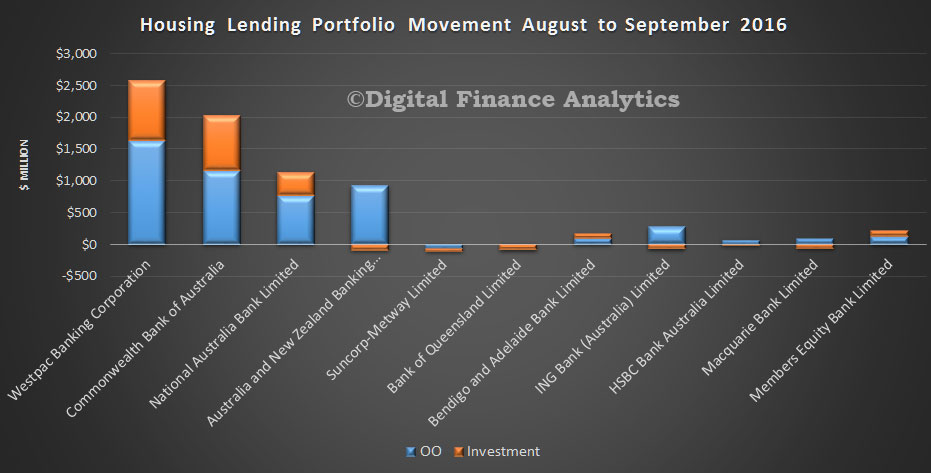
Looking at the portfolio data, we see that Westpac and CBA had the bulk of the growth, across both owner occupied and investment loans. NAB grew in both categories, whereas ANZ dialed back their investment lending (perhaps from reclassification?). It is worth noting that ING is also growing their owner occupied portfolio and Members Equity Bank grew strongly.  Pressure on some of the regional banks continues.

apra-adi-sept-portfolioThis has done little to change the relative market shares, with CBA in first place on owner occupied loans, and Westpac first on investment lending, but with CBA now nipping at their heals.

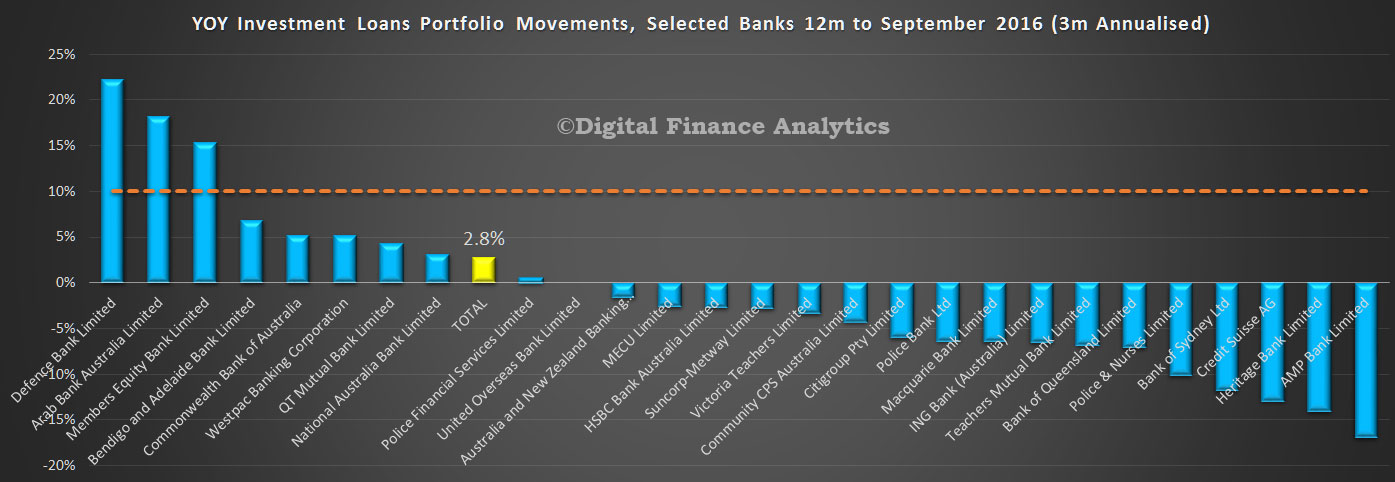
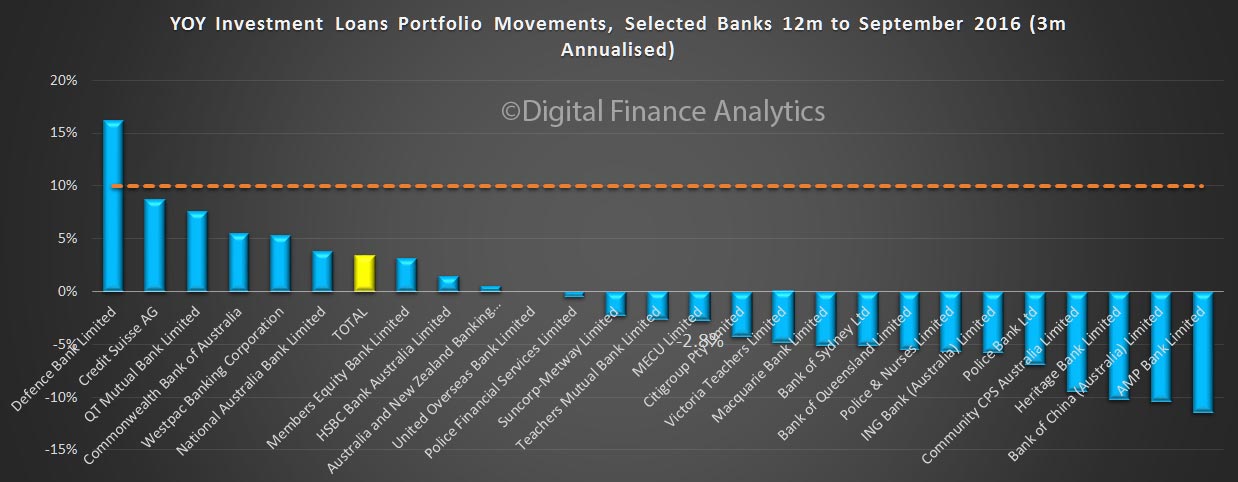
apra-adi-sept-sharesFinally, here is the relative investment lending portfolio growth. On a 3 month annualised basis, the total market grew 2.8%, but now three of the major players are operating above system growth, though still below the 10% speed limit imposed by APRA last year.

apra-adi-sept-trends There has clearly been a focus on energising investment lending, as we predicted in our Property Imperative report.  We expect momentum to continue for some time to come, hampering the RBA’s ability to cut the cash rate if they needed to.  We still believe further macroprudential measures are needed.