Mortgage Growth Slows Again In April

APRA has released their monthly banking statistics for ADI’s to April 2018. And now we are really seeing the tighter lending standards biting.  In fact, Westpac apart, all the majors have reduced their investor property lending.

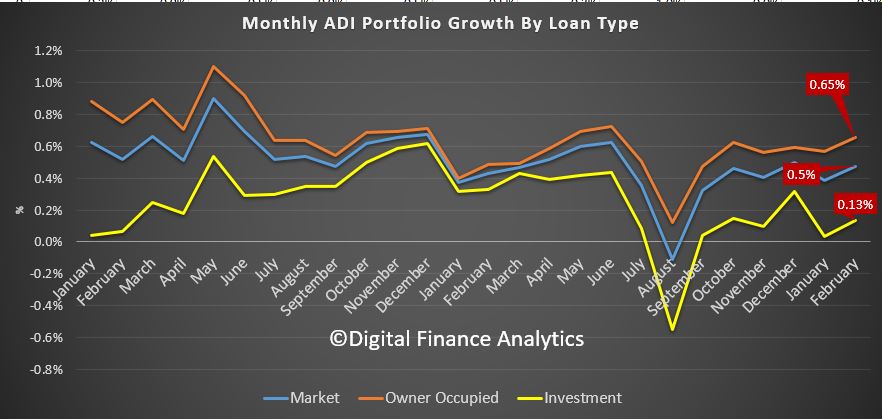
APRA reports for each lender the net total balance outstanding at the end of each month and by looking at the trends we see the net of  loan roll offs and new loans. This is important, as we will see.

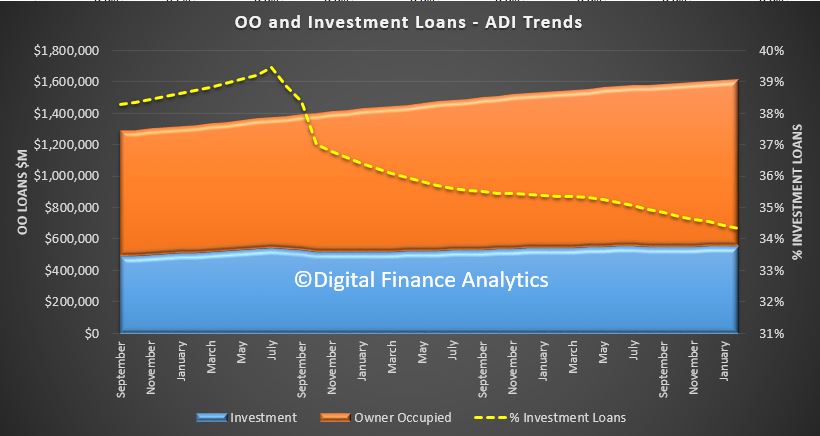
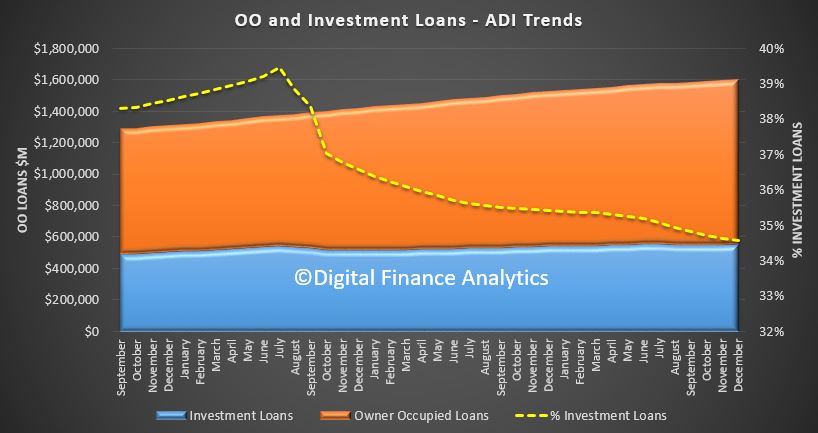
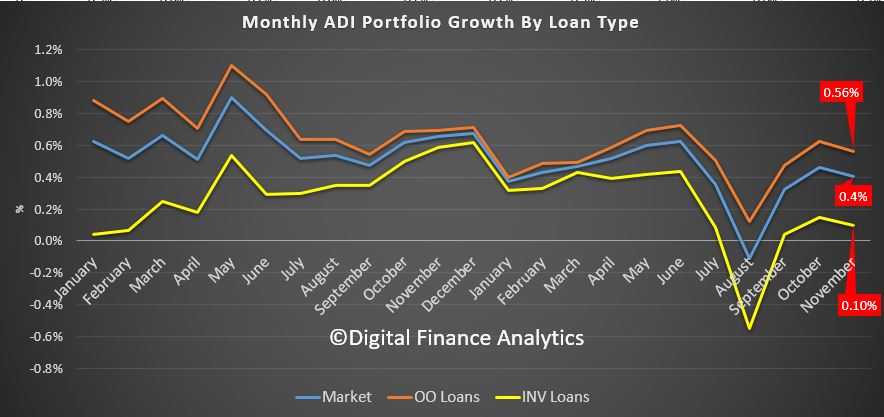
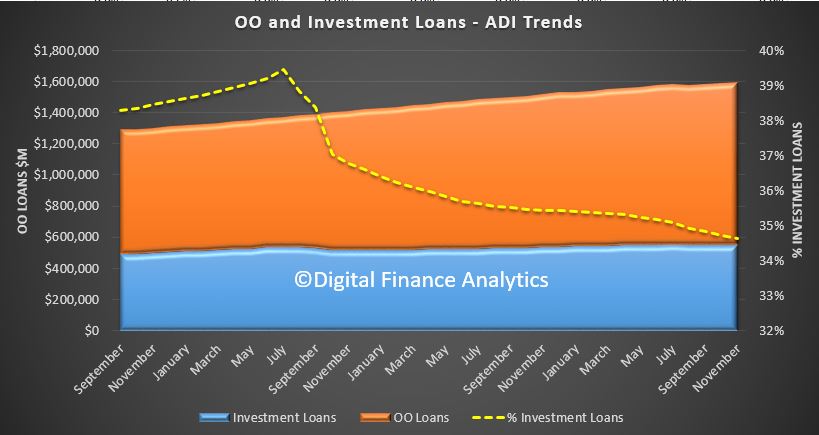
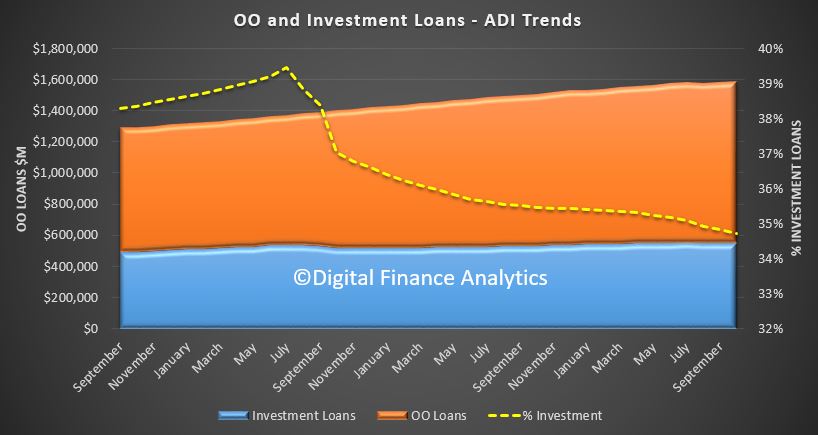
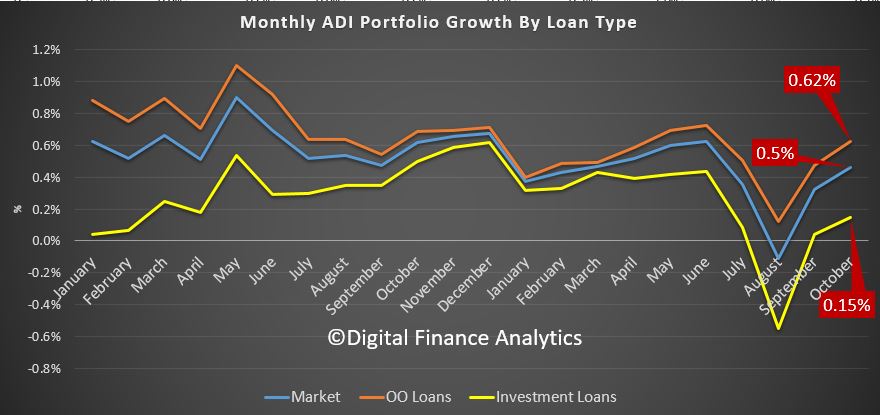
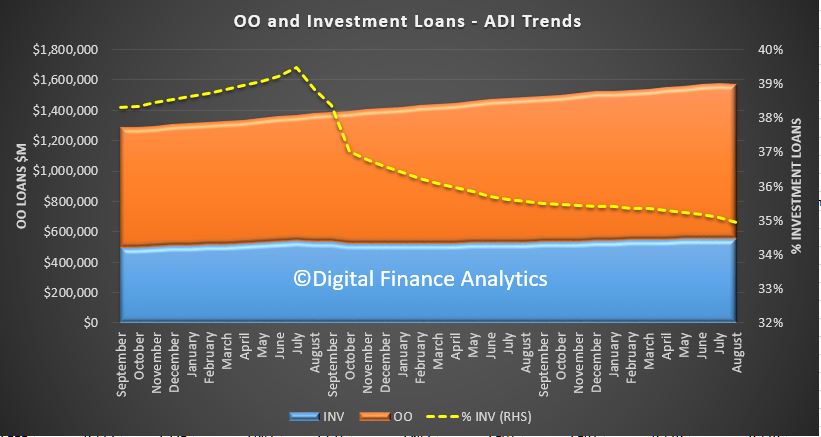
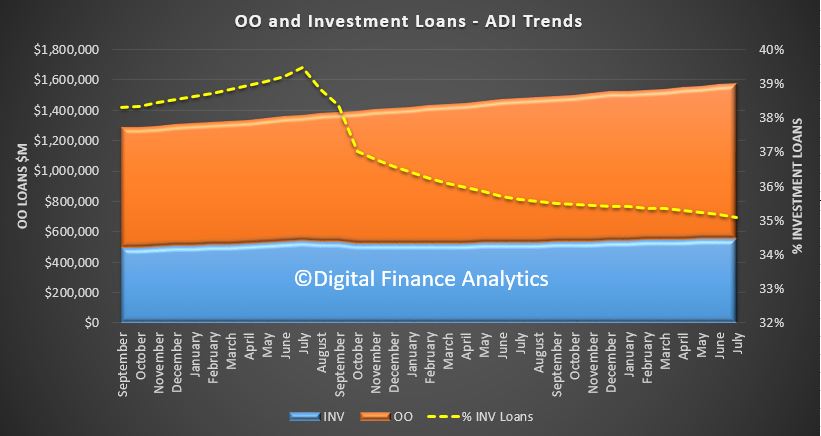
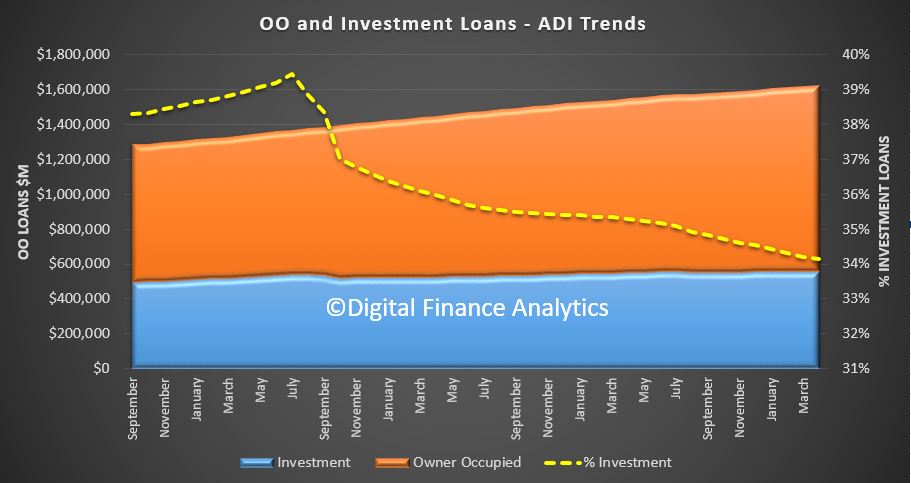
At the aggregate level, total lending for mortgages from ADI’s rose 0.2% in the month, up $3.0 billion to $1.62 trillion. Within that owner occupied loans grew by 0.29% or $3.1 billion to $1.07 trillion while investment loans fell slightly, down 0.01% of $42 million.  As a result the relative share of investment loans fell to 34.14%.

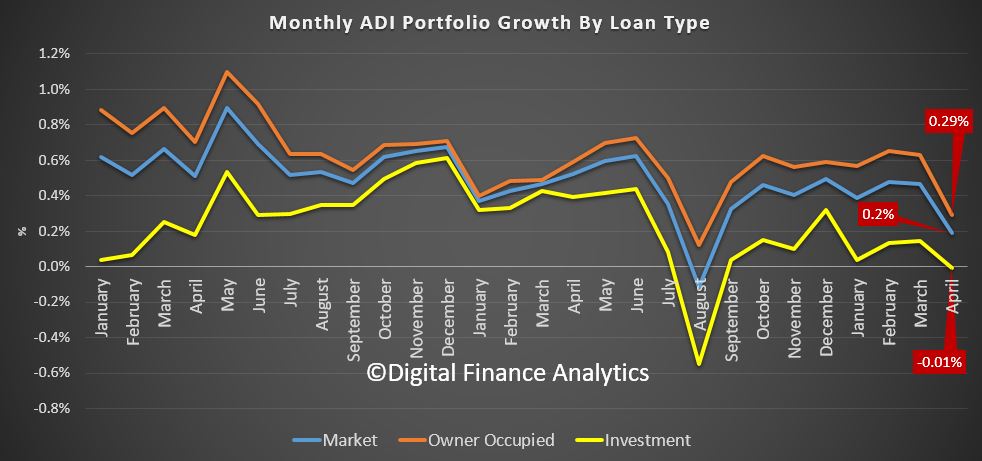
The trend movement highlights the significance of the fall (the August 2017 point is an outlier thanks to reclassification), this is the weakest result for years.  At an aggregate level, over 12 months this would translate to a rise of just 2.3%, significantly down from the 5-6% range of recent months.

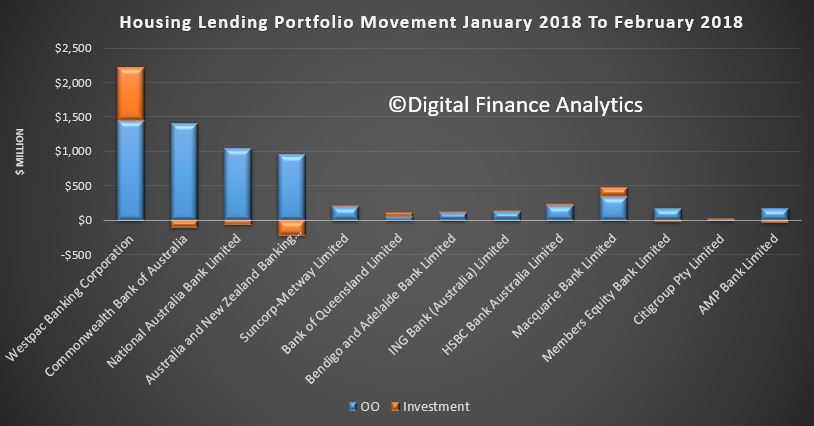
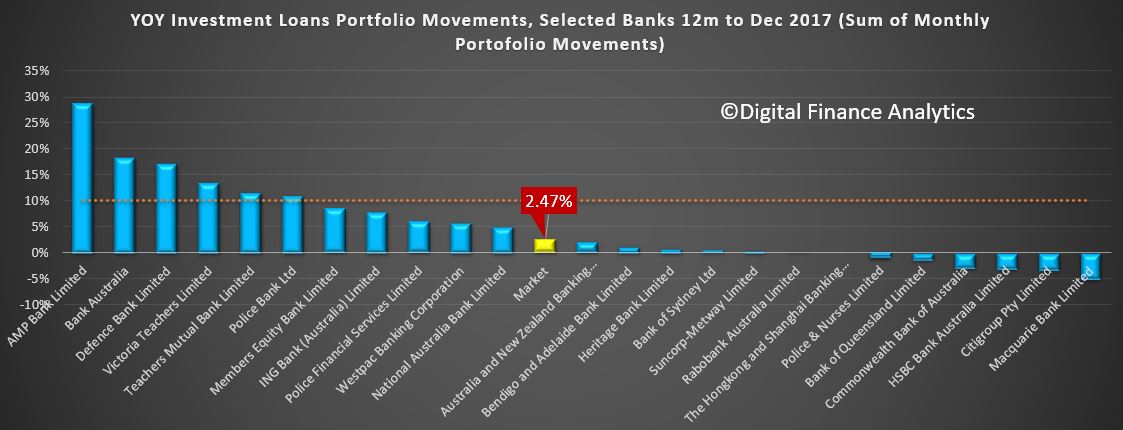
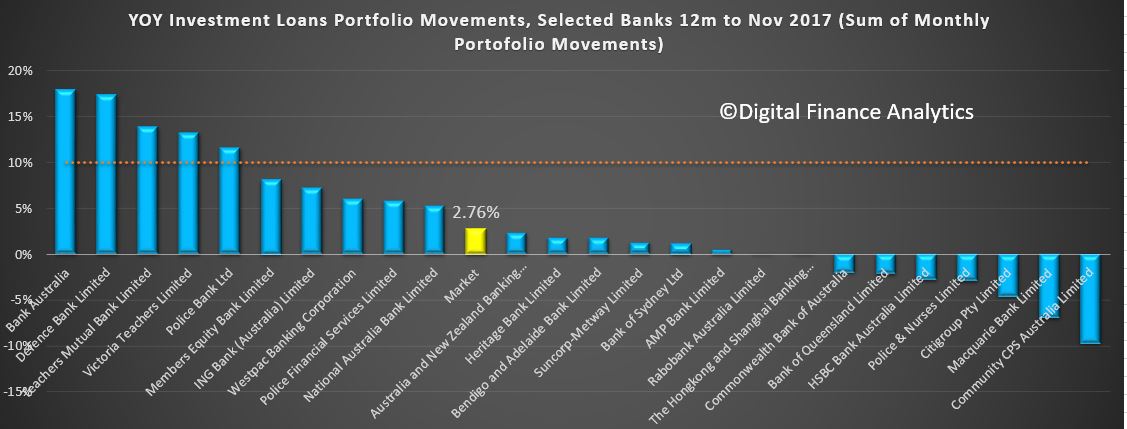
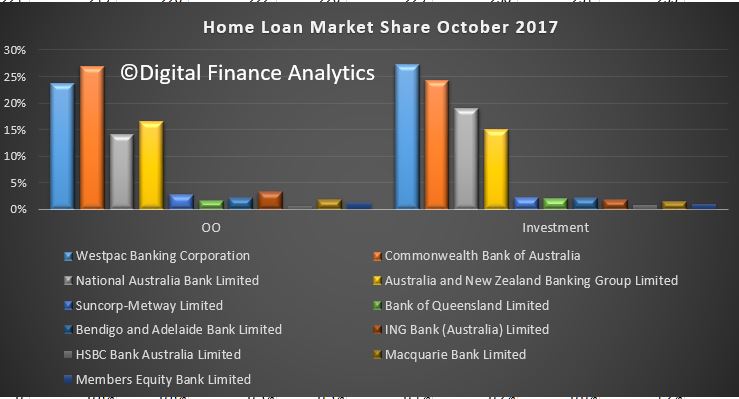
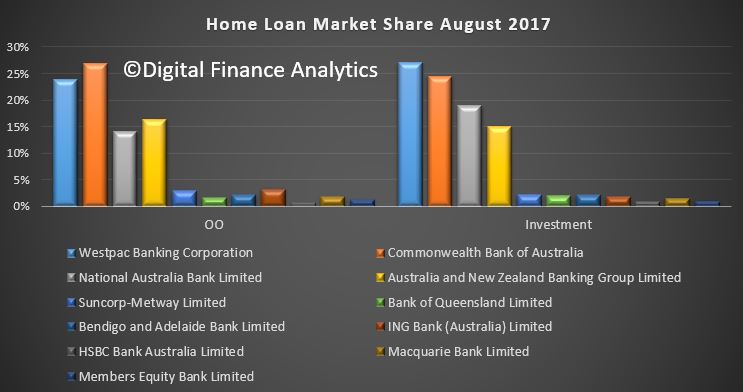
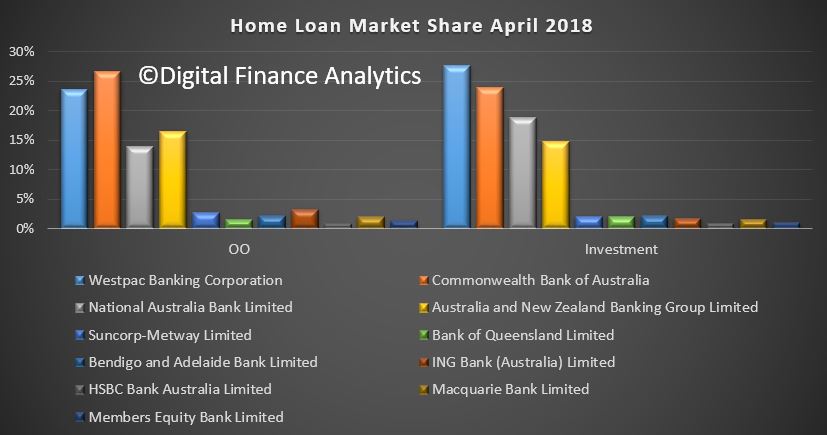
Turning to the individual market shares, at the aggregate level there was little change, other than Westpac’s share of investor loans grew to 27.6%, up from 26.1% in January 2016

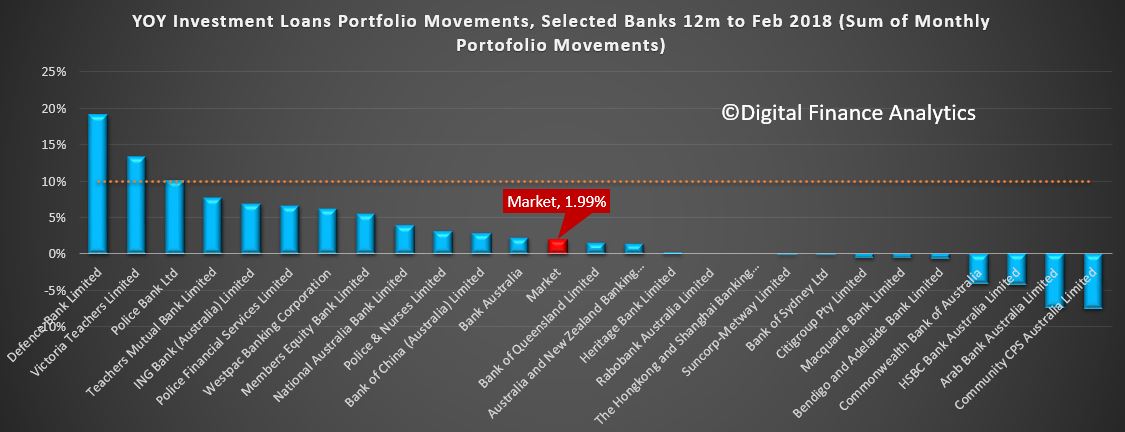
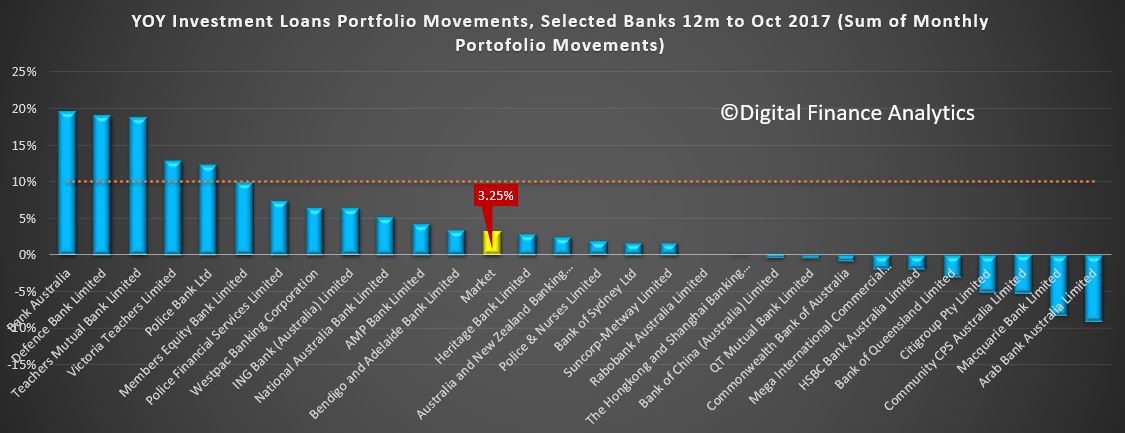
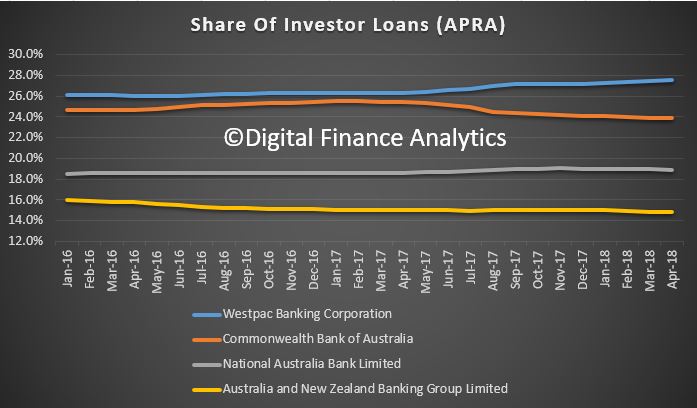
Here is the trends from the big four. Westpac has continued to increase share of investor loans. CBA has fallen away the most significantly.

There has been almost no shift in owner occupied loan shares.

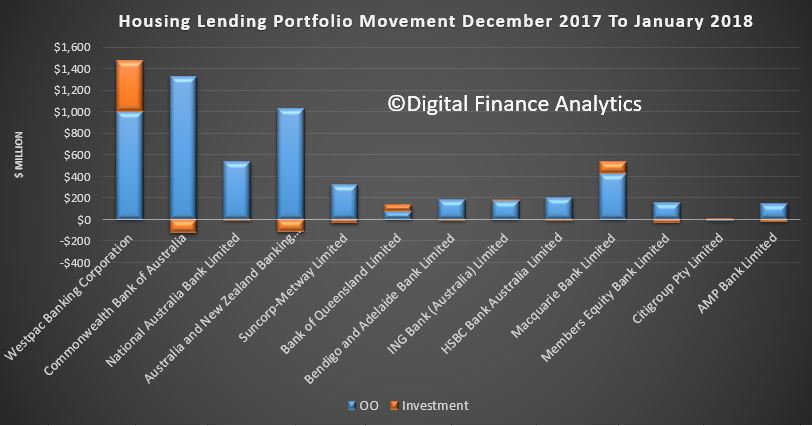
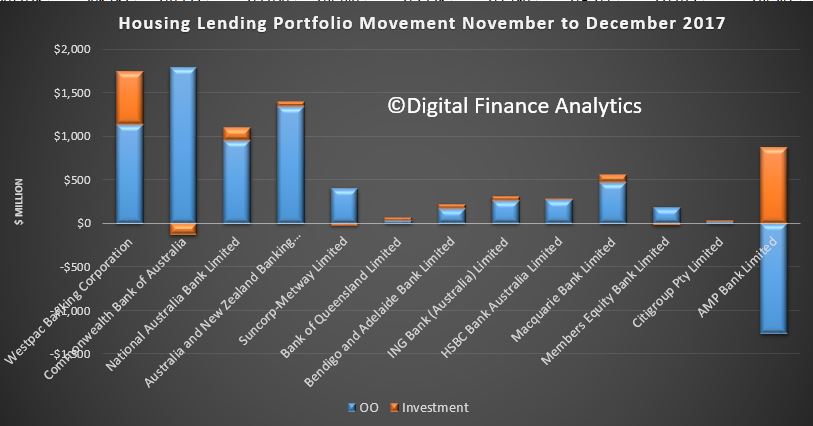
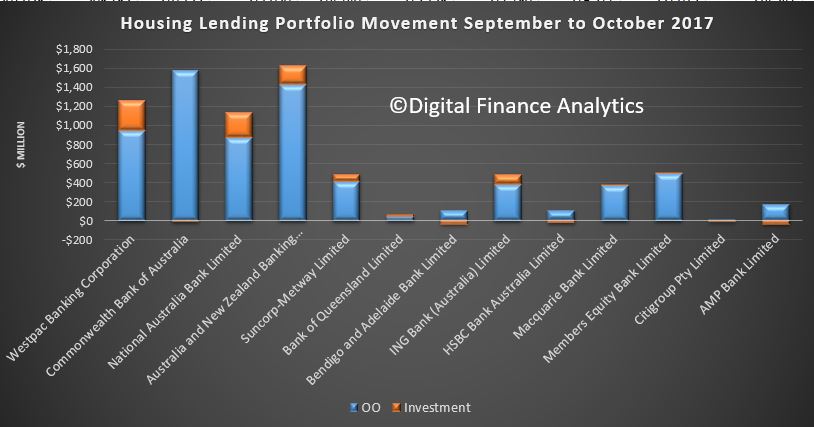
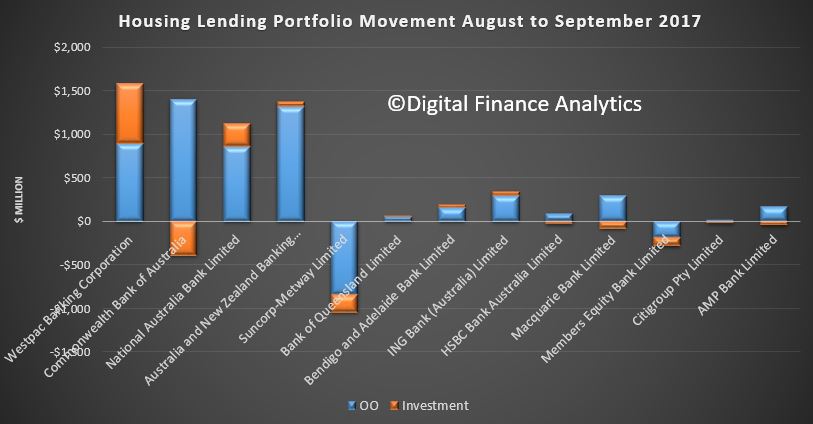
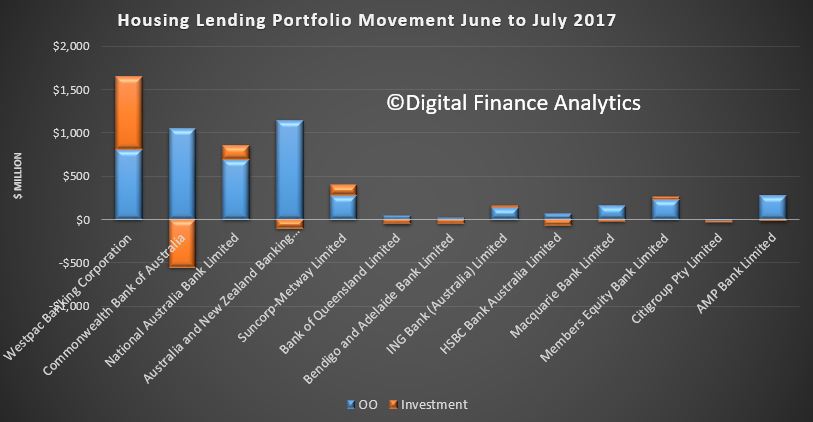
The monthly changes in value tell the story, with Westpac and Macquarie growing the value of their portfolios, across both owner occupied and investment lending. We see falls in net investor lending elsewhere.

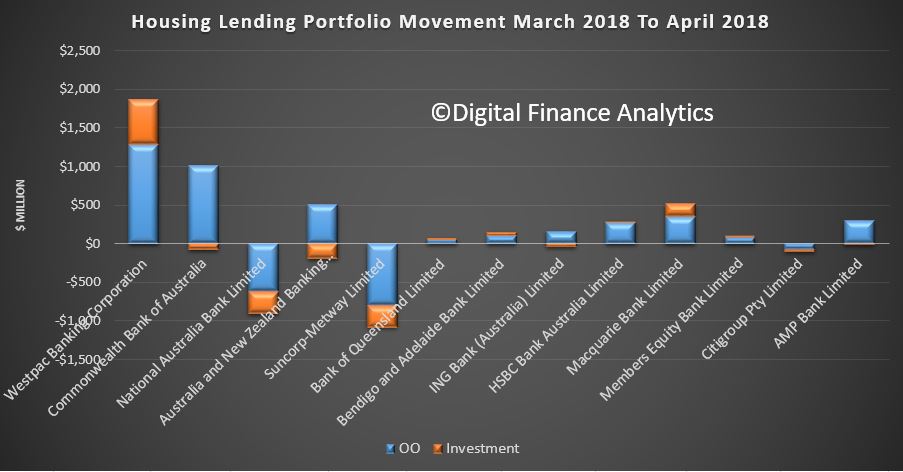
We conclude that Westpac executed a different strategy in terms of mortgage origination compared with its competitors. They may be offering selective discounts to attract particular types of business, or they may have different lending standards, or both.

It is quite possible we will see other lenders trying to compete relative to Westpac in the investment loan domain ahead, as lending growth is needed to sustain profitability.  But demand is also falling, so we expect lending momentum to continue to weaken, with the consequential impact on home prices and bank profitability.  We are entering credit crunch territory!


ADI Lending February 2018 Continues To Rise

APRA has released their monthly banking statistics for February (last working day of the month!).

Total mortgage loans on book grew by 0.5%, or if annualised at a rate of 5.7% (still way above inflation and wages growth, so overall household debt is still growing!), to $1.61 trillion. Momentum is drifting up. Within that owner occupied loans rose 0.65% to $1.06 trillion and investment loans rose 0.13% to $553 billion.

The share of investment loans now comprises 34.3% of all loans on book, so the drift down continues as investors flee the market, whilst owner occupied buyers are stronger, but leading to a small net rise. This is not sustainable.  The regulators are still keen to see growing consumer debt to support economic growth, never mind the long term consequences.

Here is the monthly tracker, which shows the small rise.

The portfolio movements of the individual banks highlights Westpac’s strong growth in investment loans, compared with the other three majors. Macquarrie is also growing investment loans.

The overall market shares have hardly changed with CBA the largest owner occupied lender and Westpac the largest investment loan lender. We found out quite recently they have around 50% of their investment loans in the interest only category.

The portfolio growth of investment lending is mostly well below the 10% APRA speed limit, which of course, based on their recent statements, is in any case now being superseded by serviceability metrics.

We will look at the RBA data which is also out today, to see movements at a market level, and specifically the trends in the non-bank sector, which we expect to be stronger.

Mortgage Lending Sags In January

The latest APRA Monthly Banking Statistics to January 2018 tells an interesting tale. Total loans from ADI’s rose by $6.1 billion in the month, up 0.4%.  Within that loans for owner occupation rose 0.57%, up $5.96 billion to $1.05 trillion, while loans for investment purposes rose 0.04% or $210 million. 34.4% of loans in the portfolio are for investment purposes. So the rotation away from investment loans continues, and overall lending momentum is slowing a little  (but still represents an annual growth rate of nearly 5%, still well above inflation or income at 1.9%!)

Our trend tracker shows the movements quite well. (August 2017 contained a large adjustment.

Looking at the lender portfolio, we see some significant divergence in strategy.  Westpac is still driving investment loans the hardest, while CBA and ANZ portfolios have falling in total value, with lower new acquisitions and switching. Bank of Queensland and Macquarie are also lifting investment lending.

The market shares are not moving that much overall, with CBA still the largest OO lender, and Westpac the largest Investor lender.

Looking at investor portfolio movements for the past year, again significant variations with some smaller players still above the 10% speed limit, but the majors all well below (and some in negative territory).

We will report on the RBA data later on, which gives us an overall market view.

Home Lending Accelerates In December

The latest data from APRA, the monthly banking stats for ADI’s shows a growth in total home loan balances to $1.6 trillion, up 0.5%. Within that, lending for owner occupation rose 0.59% from last month to $1.047 trillion while investment loans rose 0.32% to $553 billion. 34.56% of the portfolio are for investment purposes.

The monthly ADI trends show this clearly (the blip in August was CBA adjustments). Growth accelerated across all loans, and within each type.

The portfolio movements within institutions show that Westpac is taking the lions share of investment loans (we suggest this involves significant refinancing of existing loans), CBA investment balances fell, while most other players were chasing owner occupied loans. Note the AMP Bank, which looks like a reclassification exercise.

Overall market shares remain stable, with CBA holding the largest share of owner occupied loans and Westpac leading on investment loans.

The 10% speed limit for investment loans is less interesting, given the 12 month average grow of 2.4%, but most of the majors are well below the 10%. Westpac is the major growing its investment book fastest, while CBA is in reverse. Clearly different strategies are in play.

Standing back, the momentum in lending is surprisingly strong, and reinforces the need to continue to tighten lending standards. This does not gel with recent home price falls, so something is going to give. Either we will see home prices start to lift, or mortgage momentum will sag. Either way, we are clearly in uncertain territory. Given the CoreLogic mortgage leading indicator stats were down, we suspect lending momentum will slide, following lower home prices. We publish our Household Finance Confidence Index shortly where we get an updated read on household intentions.

The RBA data comes out shortly, and we will see what adjustments they report, and momentum in the non-bank sector.

More Evidence of Slowing Mortgage Lending

The APRA ADI data for November 2017 was released today.  As normal we focus in on the mortgage datasets. Overall momentum in mortgage lending is slowing, with investment loans leading the way down.

Total Owner Occupied Balances are $1.041 trillion, up 0.56% in the month (so still well above income growth), while Investment Loans reach $551 billion, up 0.1%. So overall portfolio growth is now at 0.4%, and continues to slow (the dip in the chart below in August was an CBA one-off adjustment).  Total lending is $1.59 Trillion, another record.

Investment lending fell as a proportion of all loans to 36.6% (still too high, considering the Bank of England worries at 16% of loans for investment purposes!)

The portfolio movements of major lenders shows significant variation, with ANZ growing share the most, whilst CBA shrunk their portfolio a little.  Westpac and NAB grew their investment loans more than the others.

On a 12 month rolling basis, the market growth for investor loans was 2.8%, with a wide spread of banks across the field. Some small players remain above the 10% APRA speed limit.  This reflects a trend away from the majors.

Finally, here is the portfolio view, with CBA leading the OO portfolio, and WBC the INV portfolio.

We will look at the RBA data next.

Mortgage Lending Still On The Up

The latest banking statistics from APRA, to end October 2017 shows that banks continue to lend strongly to households. The overall value of their portfolios grew 0.5% in the month to $1.57 trillion, up $7.3 billion.

Owner occupied loans grew 0.6% to $1.03 trillion, up $6.4 billion and investment loans rose 0.15% of $816 million. The proportion of investment loans continues to drift lower, but is still at 34.8% of all lending (too high!!).

Looking at the monthly movement trends in more detail, we see the “dent” in the trends a couple of months back thanks to CBA’s reclassification of loans from their portfolio. Ignoring that blip, the current policy settings are still too generous. Household debt will continue to rise, despite low wage growth and the prospect of higher interest rates. Risks in the system are still rising.

Looking at the individual lenders, the portfolio movements are small, but Westpac has extended its lead over CBA on investor loans. There is clearly a difference in strategy here between the two.

That is even more obvious where we see the monthly portfolio movements by lender.  CBA reduced their investment portfolio this month, whilst Westpac grew theirs.

Finally, here is the investment portfolio growth by lenders, using the sum of the monthly movements. Market growth is sitting at around 3%. Some smaller lenders are well above the speed limit.

The RBA data out now will give us the read on market growth, and the amount of reclassification in play.

ADI’s Still Doubling Down On Mortgages

The APRA ADI data released today to September 2017 shows that owner occupied loan portfolio grew 0.48% to $1.03 trillion, after last months fall thanks to the CBA loan re classifications. Investment lending grew just a little to $550 billion, and comprise 34.8% of all loans. Overall the loan books grew by 0.3% in the month.

This confirms our view that last months results were more to do with CBA’s changing their loan classification, rather than macroprudential biting.  The relative mix of investment loans did fall a little, so you could argue the tightening of interest only loans did help.

Overall market shares were pretty static with CBA still the largest owner occupied loan lender and Westpac the largest investment property lender.

The 12 month loan growth for investor loans is well below the 10% speed limit imposed by APRA, and all the majors are below the threshold.

We see some significant variations in portfolio flows, with CBA, Suncorp, Macquarie and Members Equity bank all reducing their investment loan balances, either from reclassification or refinanced away. The majors focussed on owner occupied lending – which explains all the attractor rates for new business. Westpac continues to drive investor loans hard.

Comparing the RBA and APRA figures, it does appear the non-banks are lifting their share of business, as the banks are forced to lift their lending standards. But they are still fighting hard to gain market share, which is not surprising seeing it is the only game in town!


Bank Mortgage Lending Falls

The latest data from APRA, the monthly banking stats to August 2017 shows the first overall fall in the value of mortgage loans held by the banks, for some time, so the macroprudential intervention can be said to be working – finally – perhaps! Or it could be more about the continued loan reclassification?

Overall the value of mortgage portfolio fell 0.11% to $1.57 trillion. Within that owner occupied lending rose 0.1% to $1.02 trillion while investment lending fell 0.54% to $550 billion. As a result, the proportion of loans for investment purposes fell to 34.93%.

This explains all the discounts and special offers we have been tracking in the past few weeks, as banks become more desperate to grow their books in a falling market.

Here are the monthly growth trends.

Portfolio movements across the banks were quite marked. There may be further switches, but we wont know until the RBA data comes out, and then only at an aggregate level. We suspect CBA did some switching…

The loan shares still show Westpac the largest lender on investor mortgages and CBA leading the pack on owner occupied loans.

All the majors are below the 10% investor loan speed limit.

So the question will be, have the non-bank sector picked up the slack? In fact the RBA says $1.7 billion of loans were switched in the month. This probably explains only some of the net fall.


Is The Mortgage Tide Receding?

APRA has released their monthly banking stats to July 2017. We see a significant slowing in the momentum of mortgage lending.  This data relates to the banks only. Their mortgage portfolio grew by 0.4% in the month to $1.58 trillion, the slowest rate for several month. This, on an annualised basis would still be twice the rate of inflation. Investment loans now comprise 35.08% of the portfolio, down a little, but still a significant market segment.

Owner occupied loans grew 0.5% to $1.02 trillion while investment loans grew just 0.085% to $552.7 billion. This is the slowest growth in investment loans for several years. So the brakes are being applied in response to the regulators.

Looking at the individual lenders, the portfolio movements are striking. CBA has dialed back investor loans, along with ANZ, while Westpac and NAB grew their portfolios. Westpac clearly is still writing significant business, but they expect to be within the interest only limit to meet the regulatory guidance.

The overall market shares have only slightly changed, with CBA the largest OO lender, and WBC the largest investor lender.

Looking at the 12m rolling growth, the market is now at around 4%, and all the majors are well below the 10% speed limit. Some smaller players are still speeding!

We will see what the RBA credit aggregates tell us about adjustment between owner occupied and investor lending, as well as non-bank participation. But it does look like the mortgage tide is going out. This could have a profound impact on the housing market.  It also shows how long it takes to turn a slow lumbering system around.


Home Lending Powers On (If You Believe The Figures)

The latest credit aggregates from the RBA to June 2017 shows continued home lending growth, up 0.5% in the month, or 6.6% annually. Business lending rose 0.9%, or 4.4% annually, and personal credit fell 0.1% or down 4.4% over the past year. However, they changed the seasonally adjusted assumptions, so it is hard to read the true picture, especially when we still have significant reclassification going on.  In original terms housing loans grew to $1.69 trillion, another record.

Investor home lending grew 0.5% or $3.13 billion, but this was adjusted down in the seasonal adjusted series to 0.2% or $1.13 billion. Owner occupied lending rose 0.9% or $9.83 billion in original terms, or 0.7% or $7.34 billion in adjusted terms. Business lending rose 1.2% of $11 billion in original terms or 0.9% of $7.61 billion in original terms. The chart below compares the relative movements.

The RBA says:

Historical levels and growth rates for the financial aggregates have been revised owing to the resubmission of data by some financial intermediaries, the re-estimation of seasonal factors and the incorporation of securitisation data.

… so here is another source of discontinuity in the numbers presented! The movements between original and seasonal adjusted series are significant larger now, and this is a concern. We think the RBA should justify its change of method. Once again, evidence of rubbery numbers!

The annualised growth rates highlight that investor lending is still strong relative to owner occupied loans, business lending recovered whilst personal finance continued its decline.

The more volatile monthly series show investor loans a little lower, while owner occupied loans rise further, and there is a large inflection in business lending.

We need to note that now $55 billion of loans have been reclassified between owner occupied and lending over the past year – with $1.3 billion switched in June. This is a worrying continued trend and raises more questions about the quality of the data presented by the RBA.

Following the introduction of an interest rate differential between housing loans to investors and owner-occupiers in mid-2015, a number of borrowers have changed the purpose of their existing loan; the net value of switching of loan purpose from investor to owner-occupier is estimated to have been $55 billion over the period of July 2015 to June 2017, of which $1.3 billion occurred in June 2017. These changes are reflected in the level of owner-occupier and investor credit outstanding. However, growth rates for these series have been adjusted to remove the effect of loan purpose changes.

Finally they tell us:

All growth rates for the financial aggregates are seasonally adjusted, and adjusted for the effects of breaks in the series as recorded in the notes to the tables listed below. Data for the levels of financial aggregates are not adjusted for series breaks. The RBA credit aggregates measure credit provided by financial institutions operating domestically. They do not capture cross-border or non-intermediated lending.

So, given the noise in the data, it is possible to argue that either home lending is slowing, or it is not – all very convenient. The APRA data we discussed earlier is clearly showing momentum. Growth is still too strong.

It also makes it hard to read the true non-bank growth rates, but we think they are increasing their relative share as some banks dial back their new business.  Taking the non seasonally adjusted data from both APRA and RBA we think the non-bank sector has grown by about $5 billion in the past year to $115 billion. APRA will need to have a look at this, under their new additional responsibility, as we suspect some of the more risky lending is migrating to this less well regulated sector of the market.