ANZ Confirms Loan Reclassification

In a media release (via ASX), ANZ confirmed that they had reclassified data it provides to the regulators. It follows a review of data collection to align more closely management reporting and regulatory reporting.

This review included a reclassification of loan purposes across “owner occupied” and “investment housing”. ANZ says these changes do not impact ANZ’s investor lending growth targets. Their investment loan book was $83.5bn at 30 June 2015.

They say that the changes do not impact ANZ’s overall lending and deposit balances, risk weighted assets, regulatory capital or prior financial reporting disclosures and have no impact on customer facilities. We think this is because there are no differences in the current risk weightings between investment and owner occupied loans.

We identified the change in the APRA monthly banking statistics on Friday.


APRA MBS Says Investment Loans Higher – But Beware!

The APRA monthly banking statistics for the ADI’s to June 2015 were released today.  Home investment lending does not show signs of cooling, so this explains the recent more overt pressure being applied by the regulators. We will look at home lending first. The banks grew their lending book by 1.33% in the month to 1.37 trillion. Remember this is the stock of loans. RBA reported total loans were $1,481 bn, the difference being the non-banks.

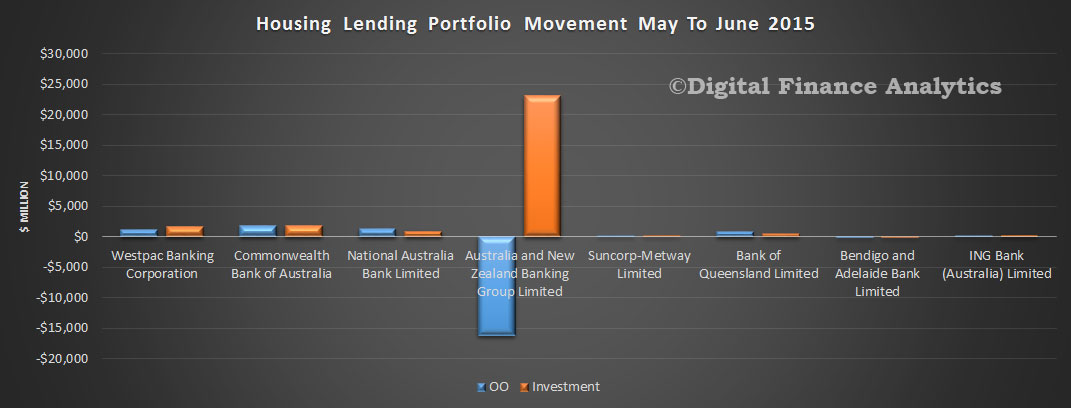
Within that, owner occupied loans were down 1.24% and investment loans were up 5.99%.  Investment loans were worth $507 bn. But this is due to a massive adjustment in the data relating to ANZ. Between May and June, the APRA ANZ data shows their owner occupied loans dropped by $16.2 bn and their investment book grew by $23 bn. We think this helps to explains ANZ’s announcement earlier. Clearly some loans have been reclassified between May and June, so this distorts the overall market picture. APRA’s report on revisions does not really help us. That said, here is the detailed analysis.

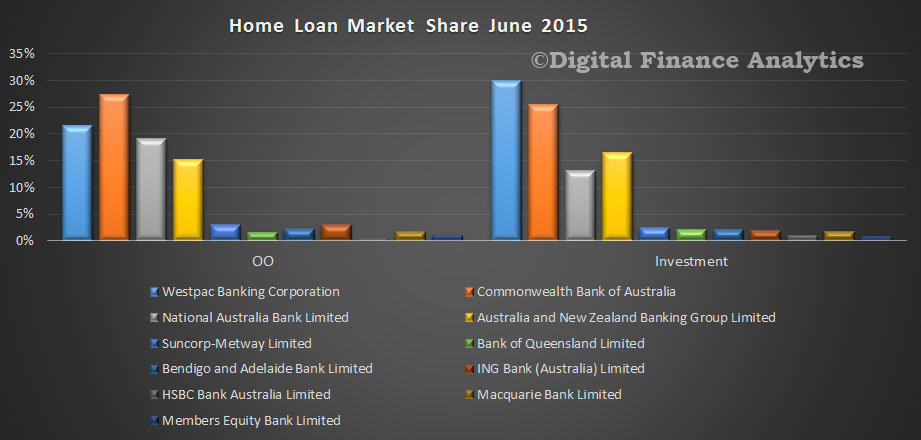
CBA has the largest share of owner occupied loans, with 27.36% of the market. Westpac has 30% of all investment property lending. ANZ had 15.12% of owner occupied loans, and 16.46% of investment loans (under the revised data in June).

APRA-MBS-June2015-HomeLoanShareThe portfolio movements May to June show the ANZ swing, and not much else!

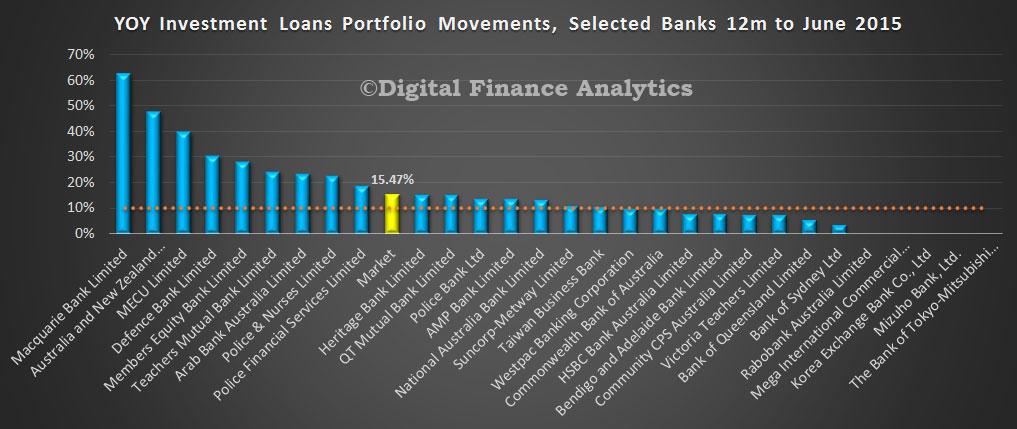
APRA-MBS-June2015-MonMovementThe APRA speed bump of 10% is well and truly exceeded this month because of the swing in ANZ. The market grew at an annualised rate of over 15% and many large and small players are well above the threshold – ANZ was at 47% – but this is because of the adjustment. The true growth rate is lower. But, no visible impact of the APRA guidelines so far.

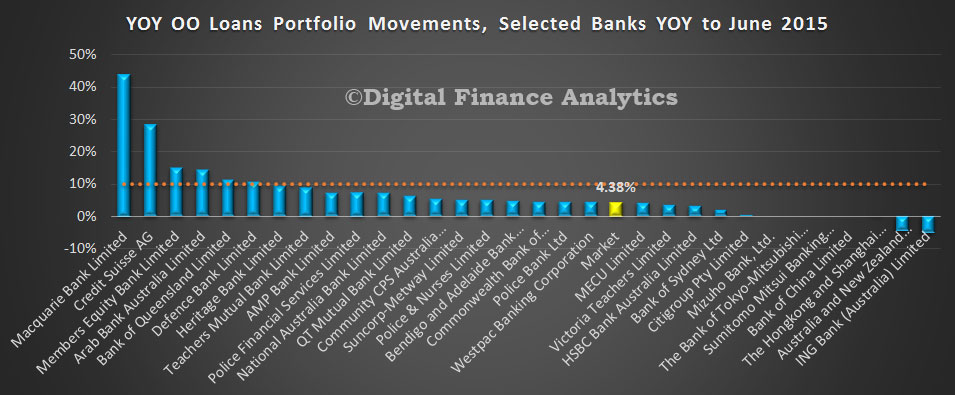
APRA-MBS-June2015-INVGrowthFor comparison purposes, here is the data for owner occupied loans – and though no formal speed limit is in place, we have shown the 10% benchmark. The market grew at 4.3% in the past 12 months. The true rate is higher.

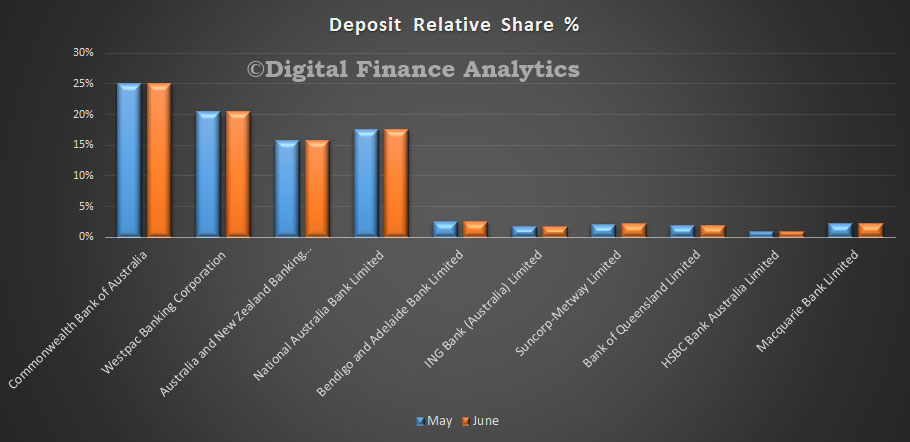
APRA-MBS-June2015-OOGrowthTurning to deposits, little change in the month, total deposits were down just a tad to $1.83 trillion. Little movement in relative shares.

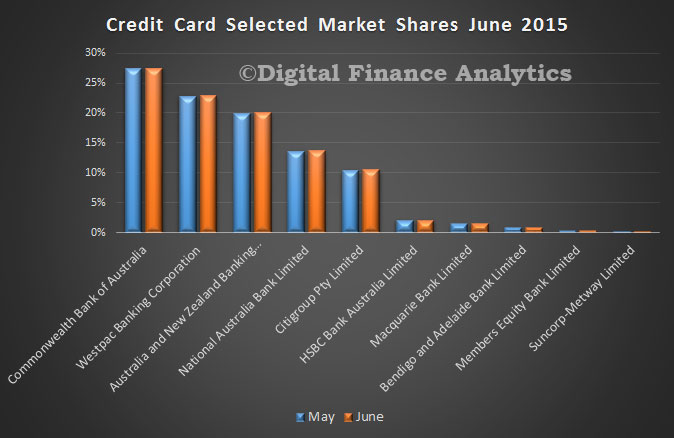
APRA-MBS-June2015-DepositShareOn the credit card portfolios, there was a rise of 0.4% in balances outstanding, to $41.5 bn. No significant change in the relative share.

APRA-MBS-June2015-CardsShare

Lending Finance For May – Investment Property Lending Still Hot

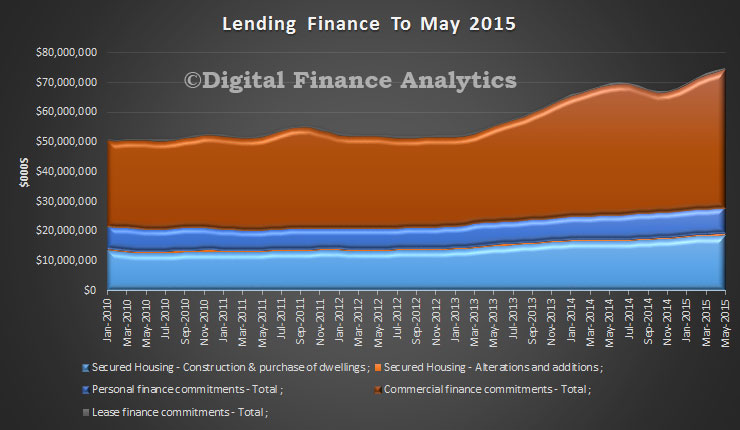
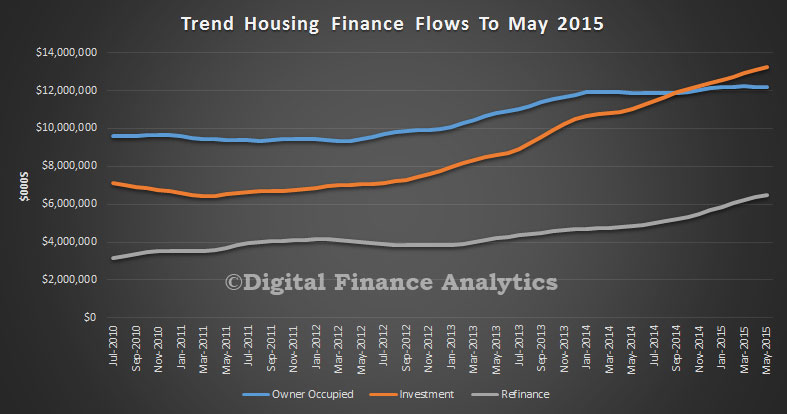
The ABS released their overall lending data for May 2015. It shows the same old story. Significant growth in investment lending, especially driven by NSW. The total value of owner occupied housing commitments excluding alterations and additions rose 0.4% in trend terms. Investment lending was 1.0% up in the month, and refinance up 1.6%. The trend series for the value of total personal finance commitments rose 0.8%. Fixed lending commitments rose 1.7%, while revolving credit commitments fell 0.3%. The trend series for the value of total commercial finance commitments rose 1.5%. Fixed lending commitments rose 1.9% and revolving credit commitments rose 0.3%. The trend series for the value of total lease finance commitments rose 1.1% in May 2015 and the seasonally adjusted series rose 0.7%, after a fall of 1.5% in April 2015.

Lending-Aggregates-May-2015The housing data shows that investment lending is still hot. Refinancing is also on the up.

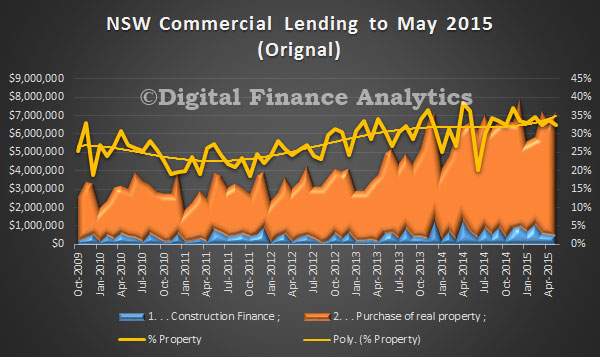
Trend-Lending-Flows-May-2015The state data shows that NSW investment lending set a new record on both volume and value.

Lending-NSW-May-2015

Property Investors Undeterred

The latest data from the ABS covering housing finance to May 2015, shows that in trend terms (our preferred measure) lending for investment purposes rose by more than 1%, whilst owner occupied loans rose 0.4%. However, this is misleading, because the growth in owner occupied loans is all about refinancing of existing loans which was up by 1.6%, indicating that many are seeking to switch to lower rate deals which are still on offer. Exclude this element, and owner occupied lending actually fell slightly. Total lending overall was $31 billion in the month, a 0.7% rise, whilst in seasonally adjusted terms, the total value of dwelling finance commitments excluding alterations and additions fell 4.4%. Momentum is mainly in existing property rather than new construction.

Looking across the data, we start with the full set, which shows that 52% of all lending was for investment purposes – another record. The total value of lending to owner occupiers and investors for the new home construction eased back by 3.2%, though this is still some 11.5% higher than a year earlier. The decline is attributable to a 5.4% fall in the value of lending among owner occupiers, while lending to investors constructing new dwellings increased by 1.6%.

All-Resi-Lending-May-2015Refinancing of existing loans amounted to more than 20% of all loans written in the month, reaching a similar proportion to late 2011. We expect refinancing transactions to continue to bloom as investors come off the boil.

Resi-Refi-May-2015First time buyers are still active, in original terms the ABS data showed a rise in owner occupied first time buyer investors. The number of first home buyer commitments as a percentage of total owner occupied housing finance commitments rose to 15.9% in May 2015 from 15.8% in April 2015. However, we also continue to see a rise in investor first time buyers, as they continue to use the “back door” property entry method. Refer to our earlier analysis.

FTB-Tracker-May-2015Looking at the state data, we see increases in the ACT and NT, whilst relative changes in the larger states were smaller. WA and TAS are falling a little.

OO-Percentage-By-States-May-2015There are nearly as many commitments in VIC than in NSW in the month, whilst WA registered a small relative fall. The number of dwelling construction loans to owner occupiers (in original terms) in May 2015 compared with a year previously was lower in each of the six states: down by 5.9 per cent in New South Wales, down 5.4 per cent in Victoria, down 9.4 per cent in Queensland, down 11.8 per cent in South Australia, down 27.3 per cent in Western Australia and 3.0 per cent lower in Tasmania over the past year.

OO-Committments-By-State-May-2015Finally, of owner occupied loans, refinancing accounted for more than 35%. This is a recent record.

OO-Lending-May-2015

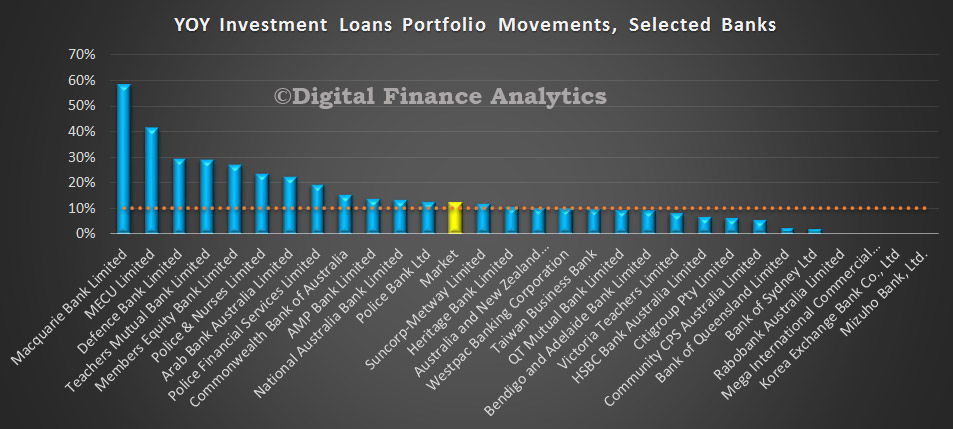
ADI’s Still Growing Investment Loans Above 10%

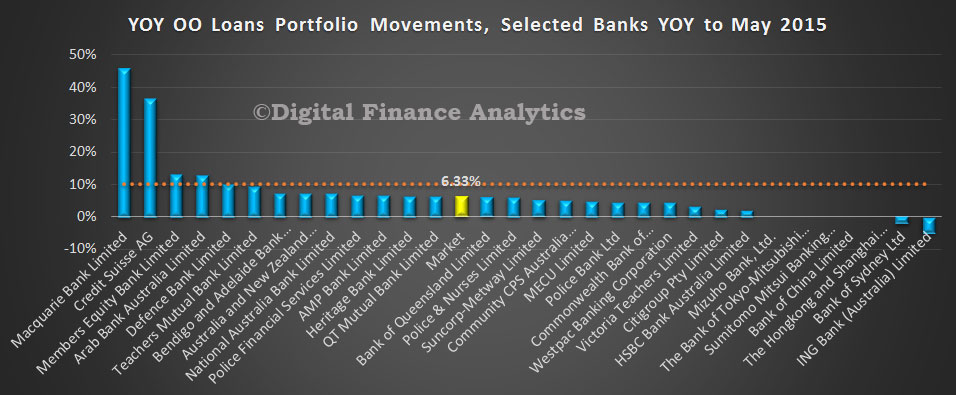
The latest APRA data on ADI’s banking statistics showed us a few interesting angles. Looking at housing first, total lending for residential property rose to $1.36 trillion, with owner occupied loans rising 0.57% in May, and investment loans rising 0.99%. These translate into year on year growth rates of 6.33% for owner occupied loans and 10.65% for investment loans, which is above the APRA “watch” rate of 10%. Housing lending for investors is still going gangbusters, as our earlier analysis from the RBA confirmed. The difference between the $1.36 trillion and the $1.47 trillion is the non bank sector.

Looking in more detail at the individual lenders, CBA still leads the majors in the owner occupied loan stakes, and Westpac is ahead on investment mortgages, by a distance.
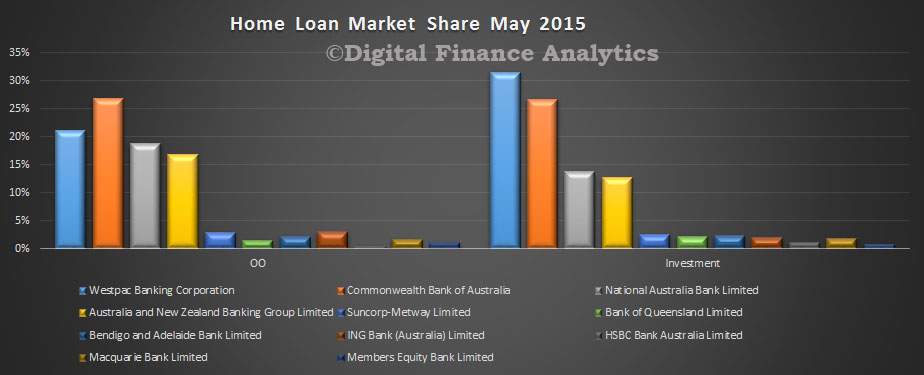
MBS-May-2015--Loans-SharesMore detailed portfolio analysis shows that ANZ and NAB have been more aggressive on owner occupied loan growth than the other majors, but some of the smaller players are still making hay; Macquarie and Members Equity in particular.
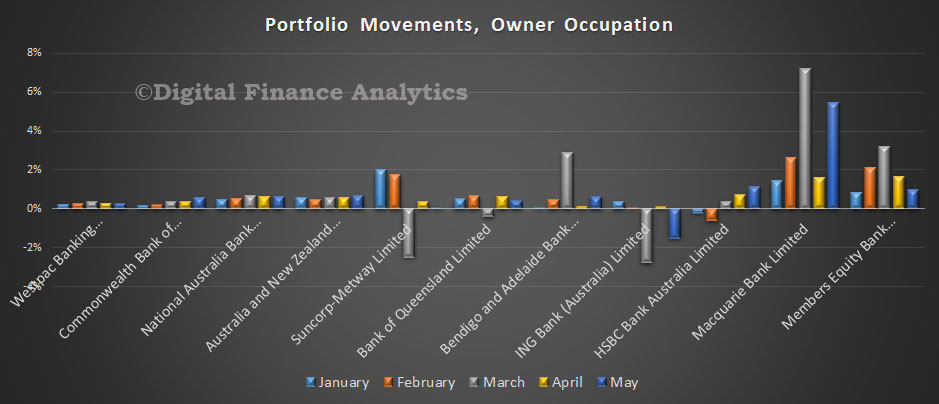
MBS-May-2015--Loans-Movement-OOThe average growth rate over the last 12 months was 6.33%, and we see many players below this, and ING’s portfolio share falling.
MBS-May-2015--Loans-YOY-OO Turning to portfolio movements on investment loans, Westpac has slowed their growth relative to the other majors, and Macquarie is still lending hard.
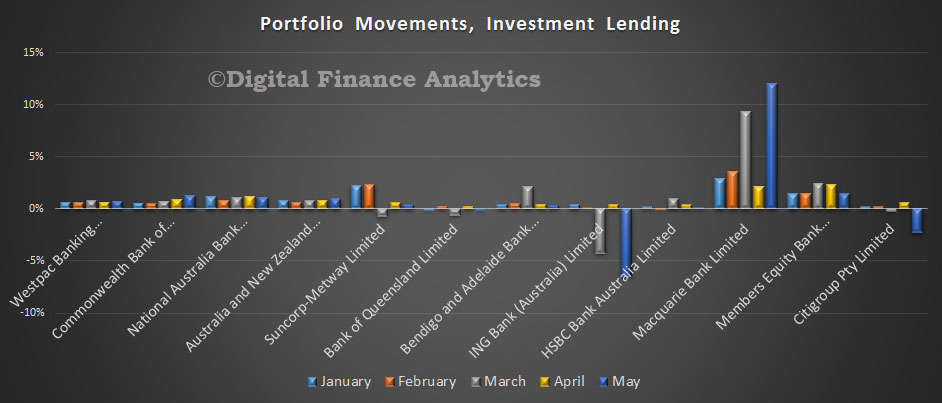
MBS-May-2015--Loans-Movement-InvThe market average growth over the past year was 10.65%, above the 10% APRA “alert” level. Some of the smaller players are well above (and we think APRA was concerned about some of these players and their rapid growth). We also see several of the majors above the threshold and they might expect to receive a “please explain” letter from the regulator. That said, no-one is clear on when the 10% hurdle should be measured from, so they might have until December to get into line. If they do, they would be required to slow their growth in coming months. There are some signs of discounts falling and LVR thresholds lowering. The regulatory noose may be tightening, but so far to little effect.
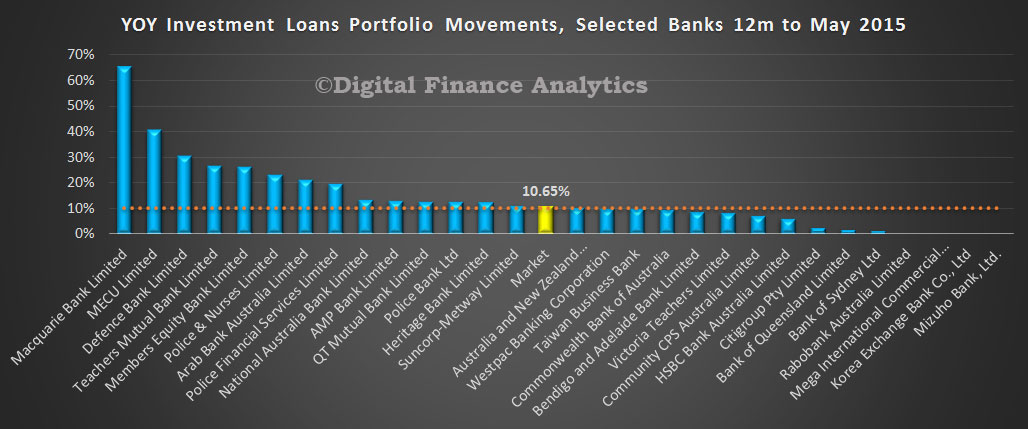
MBS-May-2015--Loans-YOY-InvTurning to deposits, we saw growth of 0.04% to $1,83 trillion.
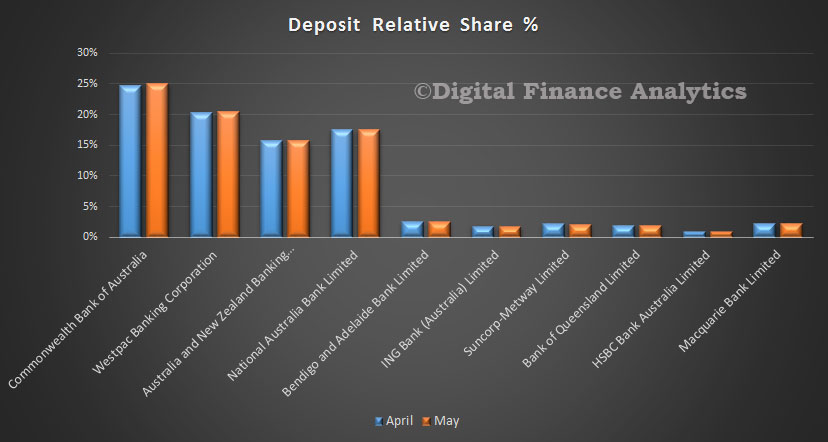
MBS-May-2015---Deposits-ShareCBA picked up share a little at the expense of some of the smaller lenders, including ING, Bendigo, Suncorp, Bank of Queensland and Rabobank. Many of the smaller players have cut their deposit rates harder to “manage” profitability (i.e. squeeze savers).
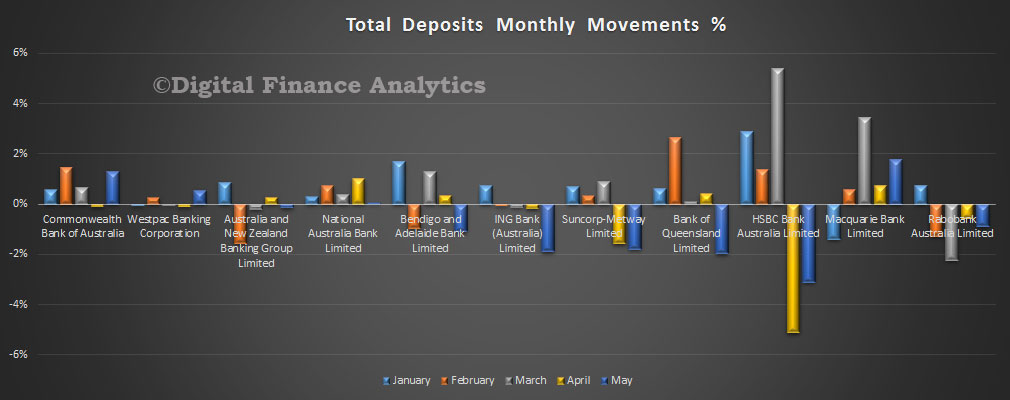
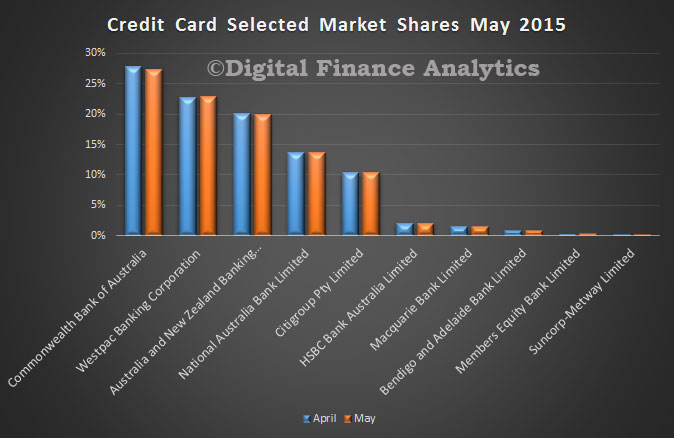
MBS-May-2015--Despoits-MovementFinally, credit cards, total borrowing fell 0.38% in the month, to $41.2 billion. Little overall change in position, though we note CBA lost a little share, whilst Westpac gained slightly. The current focus on card interest rates may have an impact in coming months, but little impact so far.
MBS-May-2015---Cards

Latest Lending Aggregates All About Property

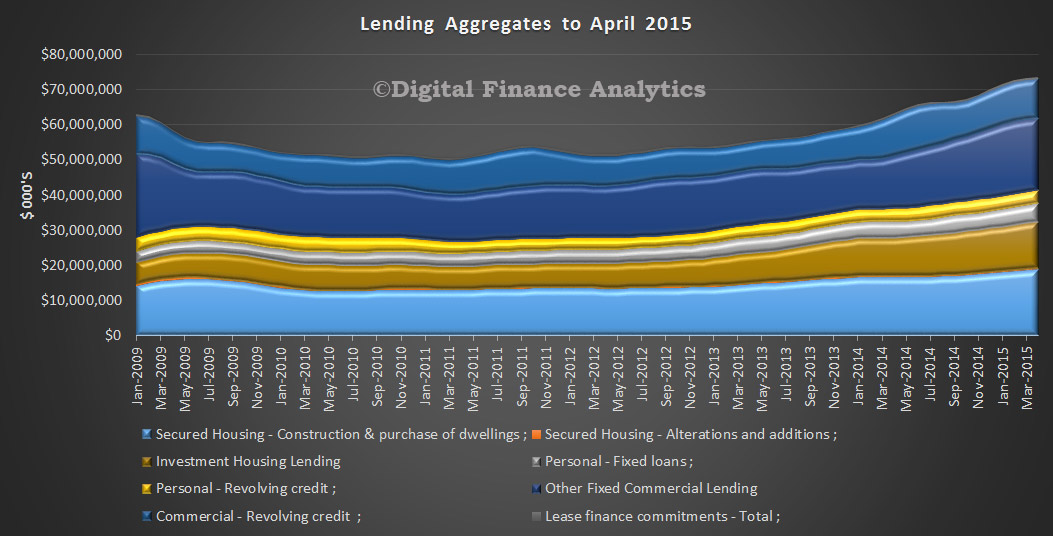
The ABS released their data for April. The total value of owner occupied housing commitments excluding alterations and additions rose 1.3% in trend terms  whilst the value of total personal finance commitments rose 0.5%.

Total commercial finance commitments rose 2.4%. Fixed lending commitments rose 3.4%, while revolving credit commitments fell 0.4%. The trend series for the value of total lease finance commitments rose 1.6% in April 2015.

Lending-Aggregates-April-2015We continue to see strong investment lending with more than half of residential loans in April going to investors.

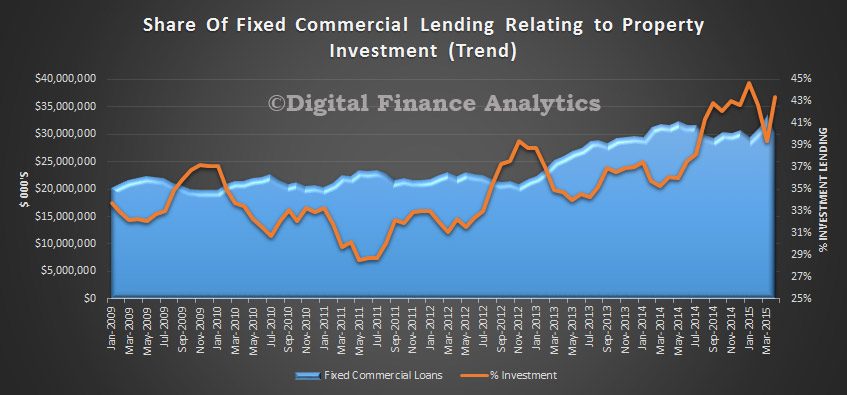
Property-Lending-Aggrates-April-2015The proportion of commercial lending aligned to investment property rose and this explains much of the rise in commercial lending overall. Investment property lending is relatively unproductive, and makes little contribution to economic growth.

Commercial-Lending-Aggregates-April-2015

Banks Grew Home Loans Again In April to $1.35 Trillion

APRA released their Monthly Banking Statistics for April 2015 today. The total home loans outstanding on the bank’s books reached $1.346 trillion, up from $1.336 trillion last month. Overall growth in the portfolio was 0.74%, with owner occupied loans sitting at 0.6% up, and investment loans 1% higher. This is before the regulatory taps were turned.

We will this month concentrate on the home loan portfolio, because it is of the most significance just now.  First, lets look at the APRA “hurdle” of 10% market growth. Now there are a number of different ways to calculate this important number. Some have chosen other methods which understate the true picture in our view. We have chosen to calculate the sum of the monthly moving averages, and the results are displayed below. A number of players are well over the 10% line, and might expect a “please explain” from the regulator. Officially, they have a little time to get into line by the way. Some players of course are subject to non-organic growth, and this will distort some of the figures.

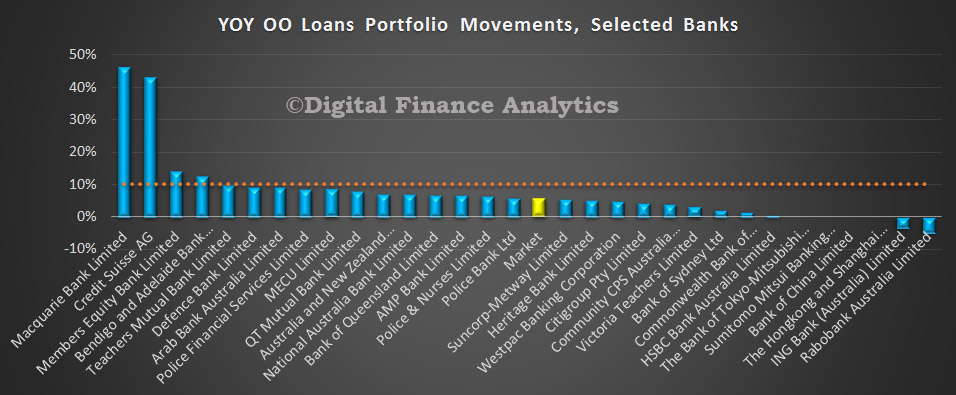
YOYINVMovementsAPRAApril2015In contrast, the OO portfolio (not subject to the 10% rule) also makes quite interesting reading. In both cases some of the smaller organisations are making hay and expanding quite fast. We hope they have their underwriting and approval processes set right!

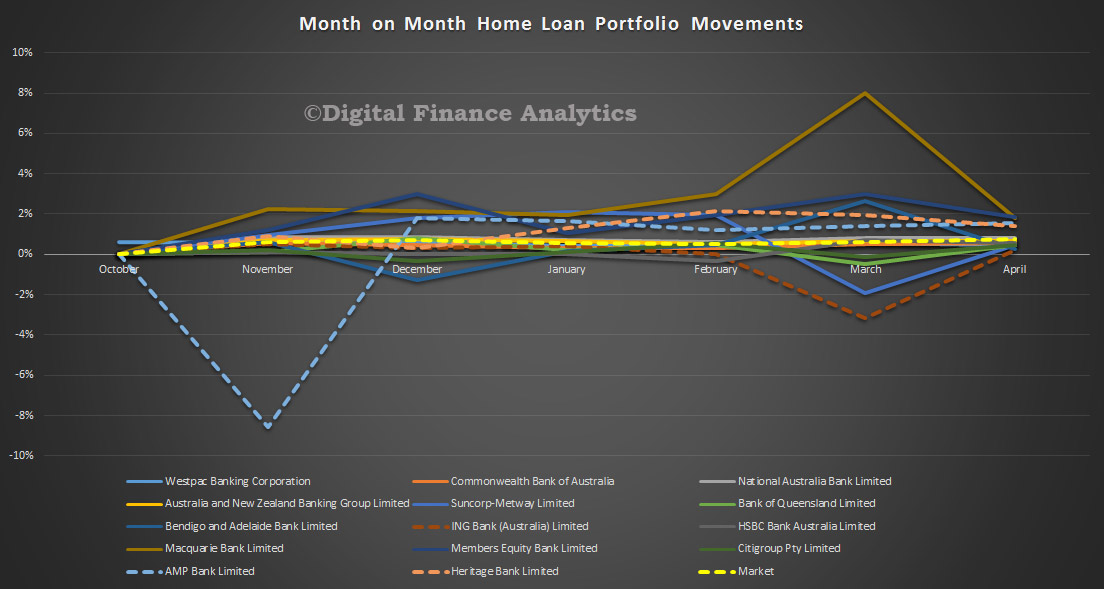
YOYOOMovementsAPRAApril2015Next, a view of the monthly portfolio movements for both OO and INV loans.

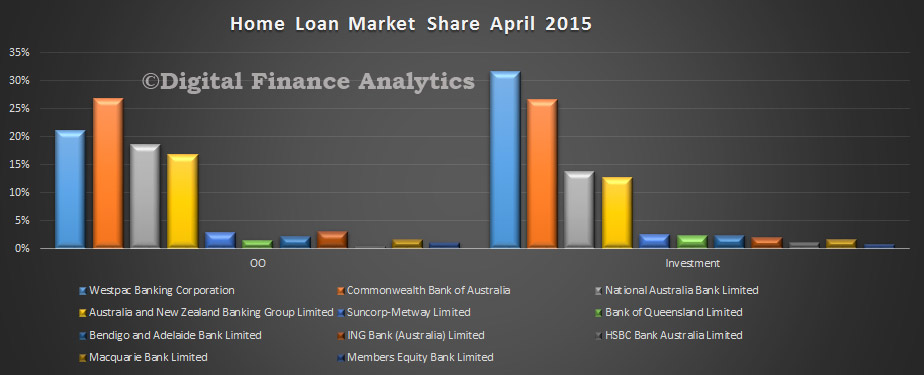
HomeLoansMovementApril2015Finally, a picture of the relative shares of home loans, both investment and owner occupied loans, by some the the main players (in volume terms).

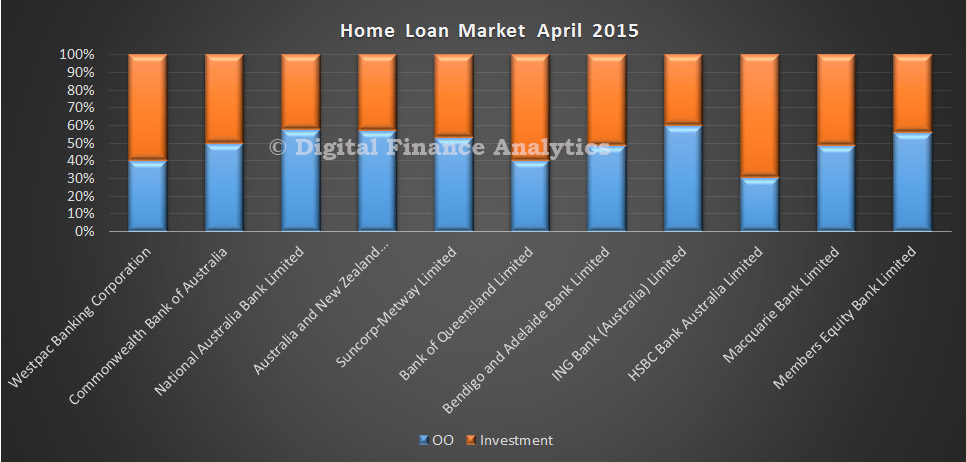
HomeLoanSharesAPRAApril2015If you look at the relative distribution of OO and INV loans, you can see which players may have more to worry about is the regulatory tightening on investment lending gets more intense. Recent events from New Zealand are insightful here, with the proposal to lift capital requirements on investment loans. We covered this in an earlier post.

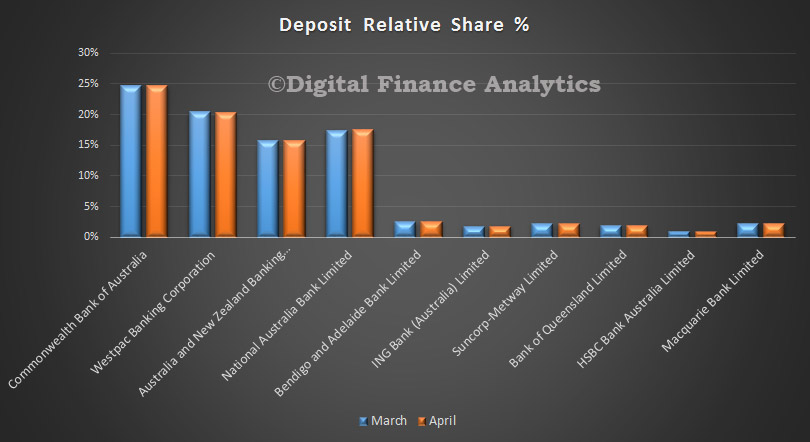
HomeLoansPCSplitsAPRAApril2015Turning to Deposits, balances rose by $7 billion, to $1.8 trillion, an uplift of 0.38% from last month. Little change in the mix between major players. CBA maintains its pole position, although NAB grew its portfolio the fastest.

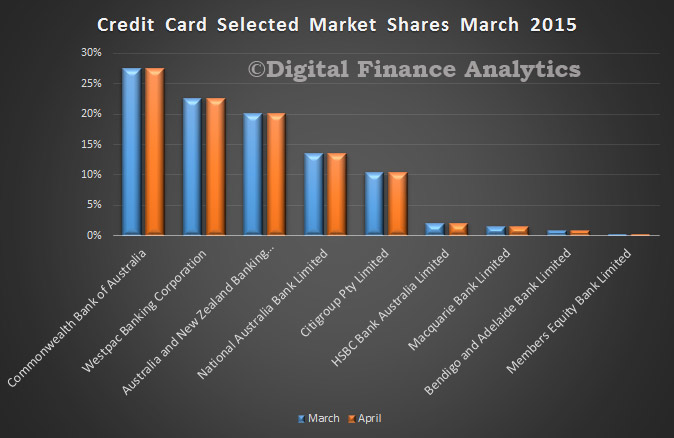
DepositSharedAPRAApril2015In the cards portfolio, total balances fell slightly from $41.6 billion to $41.3 billion. Again little change in the mix between players, although CBA lost more than half of the value drop from its portfolio from March to April.

CardsShareAPRAApril2015

Lending Up Thanks To Housing and Commercial, In March – ABS

The ABS released the Lending Finance data for March 2015 today. Comparing March with February, Housing for owner occupation excluding alterations and additions rose 0.8% in trend terms, and the seasonally adjusted series rose 1.6%. The trend series for the value of total personal finance commitments rose 0.3% although the seasonally adjusted series fell 0.9%. The trend series for the value of total commercial finance commitments rose 2.0% whilst the seasonally adjusted series rose 0.4%. The trend series for the value of total lease finance commitments rose 1.4% in March 2015 and the seasonally adjusted series rose 3.0%, following a rise of 3.6% in February 2015.

Looking at all lending, 43% was for residential property – including investment property loans, and we see a slight downward drift, as lending for other business purposed improved a little.

LendingFlowsByTypeMarch2105Looking at all commercial lending (fixed and revolving), we see that 28.8% was for residential investment property purchases, down from a high of 29.9% at the end of last year. This again shows that non-residential property lending to business lifted a little, and could suggest investment lending growth may be slowing a tad. However, investment lending remains at unprecedented levels.

InvestmentLendingAsShareofCommercialMarch2015To reinforce this view, we can compare the proportion of all commercial fixed term loans to those relating to housing investment.

InvestmentLendingAsShareofAllFixedCommercialLoansMarch2015The point we make again is that lending for investment property, whilst inflating house prices and bank balance sheets is unproductive. We need more lending to productive businesses to sustain growth, but the banks are finding it easier and more profitable to extend credit to investors, thanks to lower loss experience and capital benefits. This continues to be a significant structural problem, which needs to be addressed.


Investor Loans Still Hot – ABS

The ABS released their housing finance data to March 2015. Pretty common story, with the trend estimate for the total value of dwelling finance commitments excluding alterations and additions rising 0.8%. Owner occupied housing commitments rose 0.8% and investment housing commitments rose 0.8%.  In trend terms, the number of commitments for owner occupied housing finance rose 0.4% in March 2015.

In trend terms, the number of commitments for the purchase of established dwellings rose 0.7%, while the number of commitments for the construction of dwellings fell 1.4% and the number of commitments for the purchase of new dwellings fell 0.1%. The growth in investor property loans continued, with more than half in March (excluding refinance). Refinancing also grew in value and in percentage terms, from 18% of all loans a year ago, to over 20%, stimulated by ultra low rates.

Housing-FinanceMarch2015Looking at the First Time Buyer data, in original terms, WA had the highest share of FTB, and NSW the lowest.

FTBCountByStateMarch2015The percentage of FTB compared with all dwellings is relatively static.

FTBMarch2015However, if we overlay the DFA survey data on first time buyers who are going straight to investment property, this continues to rise, and pushes the true number of FTB higher. We continue to see a rotation away from owner occupation to investor first time buyers.

All-FTBMarch2015


Housing Lending Now Up $1.45 Trillion – RBA

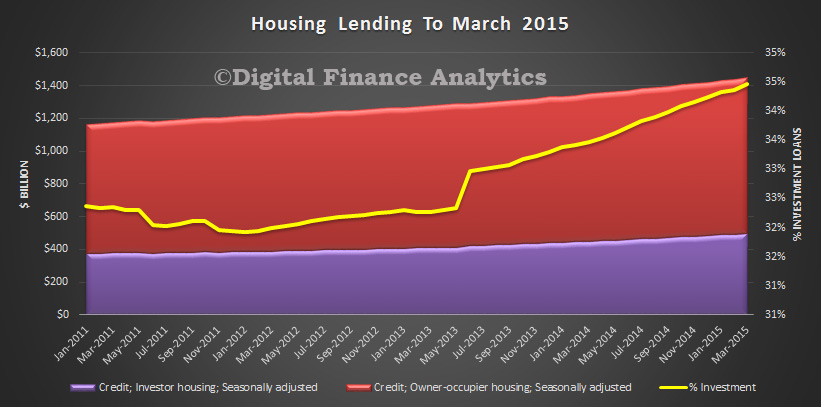
The latest credit aggregates continues to show the same trends, with housing up again overall by 0.66%, but with investment lending still running at 0.9%, whilst owner occupied lending was 0.51% higher in the month.  As a result, the share of investment loans rose again, to 34.46%, from 34.37% last month. So the housing investment skew continues. More food for thought against further interest rate cuts. Total housing lending is running at an annual growth rate of 7.3%, up from 5.9% this time last year.

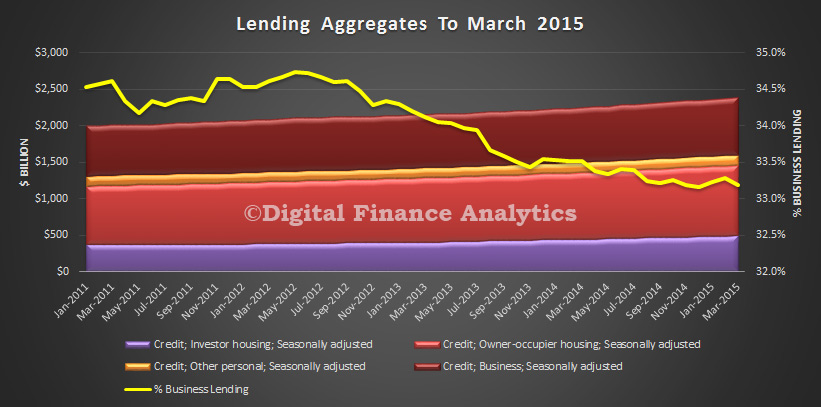
HousingAggregatesMarch2015Overall lending was 0.48% higher, with business lending growing just 0.19%, and personal credit 0.24%. Worryingly again we see a fall in the ratio of business lending to total credit, so once again, the banks are much happier meeting demand for house loans than helping business to borrow for productive purposes. We are not sure lower interest rates would stir business into action in the current environment, and with current lending policy and capital ratios in play. We think rates will stay on hold.

Lendiing-Aggregates-March-2015