Because price deflation is anathema to both profit margins and credit quality, a low enough rate of price inflation will adversely affect both equity prices and systemic financial liquidity. If US core consumer price inflation (which excludes volatile food and energy prices) now eases amid a relatively low and declining unemployment rate, what might become of core consumer prices once unemployment inevitably rises? Today’s already sluggish rate of core consumer price growth increases the risk of outright price deflation if sales volumes endure a recessionary contraction.
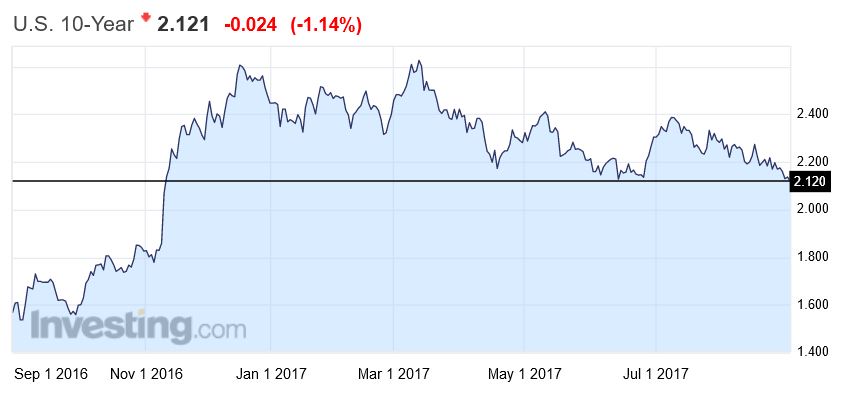
US consumer price inflation lacks both the speed and breadth necessary for a lasting stay by a 10-year Treasury yield of at least 2.5%. Because the Fed’s preferred inflation measure — the PCE price index — can be temporarily buffeted about by wide swings in food and energy prices, our focus is on the core PCE price index, which best captures consumer price inflation’s underlying pace.
Pockets of price deflation warn against aggressive tightening
The annual rate of core PCE price index inflation was merely 1.4% in July. The accompanying -2.0% annual rate of consumer durables price deflation underscores the considerable risk of pushing too hard on the monetary brakes. Both persistent consumer durables price deflation and August 2017’s -0.9% annual rate of core consumer goods price deflation (as measured by the CPI) warn that too rapid a rise by interest rates risks even lower prices among businesses already burdened by a loss of pricing power. Prolonged core consumer goods price deflation might yet thin profit margins by enough to necessitate layoffs.
The CPI tells roughly the same story as the PCE price index, where inflation gives way to deflation outside of consumer services. By far the fastest price growth has been posted by consumer services, whose pricing benefits from the category’s relative immunity from global competition. For example, August 2017’s 1.7% annual rate of core CPI inflation consisted of a 2.5% annual rate of consumer service price inflation that differed considerably from the aforementioned -0.9% annual rate of core consumer goods price deflation. Core consumer goods price deflation has held in each month since March 2013 and it posted its worst reading since August 2004’s -1.2% in August 2017.
Moreover, consumer service price inflation has been skewed higher by the relatively rapid growth of shelter costs. After excluding August 2017’s 3.3% yearly increase by the CPI’s shelter cost component, the 1.7% annual rate of core CPI inflation drops to 0.5%, which was the slowest such rate since the 0.5% of January 2004.
Expectations of a 2% to 3% Return from Bonds May Become the Norm
Investment professionals now include expectations of a prolonged containment of price inflation in their long-term outlook for prospective returns. For example, a member of Vanguard Group’s global investment-strategy team reiterated Vanguard’s expectation of expected returns for the next decade of 5% to 8% for equities and 2% to 3% for bonds, according to Bloomberg News.
The expected 2% to 3% return from bonds during the next 10 years is at odds with both the FOMC’s median projection of a 2.75% federal funds rate over the long-term and consensus forecasts of a 3% to 3.5% average for the 10-year Treasury yield during the next 10 years.
The cited Vanguard investment manager claimed that bond yields will be reined in by low price inflation stemming from demographic change, globalization, and technological progress. Aging populations will weigh on household expenditures. An aging population implies less in the way of household formation that otherwise accelerates spending vis-a-vis income and, by doing so, imparts a powerful multiplier effect.
Furthermore, the US workforce now ages in tandem with the overall population. According to the Labor Department’s household survey of employment, the employment of Americans aged at least 55 years surged by a cumulative 31.2% since June 2009’s end to the Great Recession through August 2017. Because the latter was so much faster than the accompanying 9.6% increase by total household-survey employment, the number of employees aged at least 55 years rose to a record 23.2% of household survey employment in August. The unprecedented aging of both the US workforce and population will limit the upsides for household expenditures, core consumer price inflation, benchmark interest rates, corporate earnings growth, and corporate debt growth.
Globalization has weakened the tendency of a tighter US labor market to quicken wage growth and, thereby, stoke consumer price inflation. Globalization exposes US workers to the often cheaper and increasingly skilled workforces of dynamic emerging market countries. Heightened labor-market competition implies that employee compensation will be more closely aligned with a worker’s individual performance. Attractive across-the-board wage hikes are a thing of the past.
Meanwhile, technological progress will facilitate the production of higher quality products at lower costs. Thanks to technology, cost-push deflation may push aside cost-push inflation.
Faster price growth requires the sustenance of faster income growth
A recurring annual rate of consumer price inflation of at least 2% requires that consumers be able to afford such a steady and broadly distributed climb by prices. The atypically slow 2.6% annual rise by wage and salary income of the 12-months-ended July 2017 questions consumer spending’s ability to sustain consumer price inflation at 2% or higher. An improving trend has yet to materialize according to July’s merely 2.5% yearly increase by wages and salaries.
Never before has wage and salary income grown so slowly over a yearlong span more than three years into a business cycle upturn. Yes, it may be true that 2017’s deceleration by wages and salaries reflects an attempt to delay receiving employment income until after possible income tax cuts take effect, but most workers are incapable of timing the receipt of income. Thus, to the extent any slowing of 2017’s wage and salary income reflects a tax-driven postponement of such income, attention is brought to a distribution of income that may be increasingly skewed toward higher income individuals. If true, then any percent increase by wage and salary income will supply less of a boost to household expenditures
and business pricing power compared to the past.
Today’s dearth of personal savings and weakened financial state of America’s lower- and middle-income classes subtract from business pricing power. Less personal savings leaves consumers with less of a buffer with which to absorb widespread price hikes. When savings are low or practically nonexistent, affected consumers may react to broadly distributed price hikes by cutting back on real consumer spending, which, in turn, leads to an accumulation of unwanted inventories and remedial price discounting.
When the core PCE price index averaged a rapid annual advance of 6.6% during 1971-1981, the US personal savings rate averaged 11.6% of disposable personal income. By contrast, since the end of 1995, the 1.7% average annual rate of core PCE price index inflation has been joined by a much lower average personal savings rate of 5.0%, where the personal savings rate was an even skimpier 3.9% during the 12-months-ended July 2017. Moreover, to the degree the distribution of income has become increasingly skewed toward the top, the personal savings rate of middle- to lower-income consumers may now be noticeably lower.
The FOMC now believes that the annual rate of core PCE price index inflation will remain under 2%, but only through 2018. However, core PCE price index inflation is likely to average something less than 2% annually through 2027, especially if employee compensation cannot sustain a pace faster than 4% annually.

