He makes the point that non-banks are picking up the investor slack, as reflected in the composition of the collateral underpinning RMBS. The high volume of RMBS issuance by non-banks is consistent with a sizeable increase in their mortgage lending.
More evidence that this sector of the market needs tighter controls?
Today I’ll provide an update on developments in the markets for housing and housing credit. These markets are closely related and both are of considerable interest to those that issue and those that invest in Australian residential mortgage-backed securities (RMBS).
Along the way, I’ll make use of data on residential mortgages from RMBS that are eligible for repurchase operations with the Reserve Bank.[1] Among other things, these data are a useful source of timely information on interest rates actually paid, loan by loan. As I’ll demonstrate, this allows us to infer something about shifts in the supply of, and demand for, housing credit, thereby shedding some light on the different forces driving these markets.
With this background in mind, I’ll also review some recent developments in the RMBS market. And I’ll finish by taking the opportunity to emphasise that RMBS issuers and investors should be prepared for any future changes in the use and availability of benchmark interest rates.
Interactions between the housing market and the market for housing credit
As highlighted recently in a speech by the Deputy Governor, the markets for housing and housing credit are going through a period of significant adjustment.[2] After years of strong growth, housing prices have been declining nationally, driven by falls in Melbourne and Sydney over the past year. Also, there has been a noticeable decline in investor credit growth and an easing in owner-occupier credit growth. The cycles in the growth of overall housing prices and investor credit have moved together quite closely over the past few years (Graph 1).
Graph 1
Underpinning these changes, there have been shifts in the demand for, and supply of housing, as well as in the demand for, and supply of, housing credit.
Credit supply affecting housing demand
The links between these two markets run in both directions, from housing credit to the housing market, and from the housing market to housing credit. Of late, the story more commonly told, though, is that a tightening in the supply of credit over recent years has impinged on the demand for housing.
This story is certainly the more apparent one in terms of its causes and effects. In particular, the measures implemented by regulators over recent years to address the risks associated with some forms of housing lending have worked to mitigate those risks and they have also led to a noticeable slowing of investor credit. This, in turn, has contributed to a decline in the demand for housing.
Again, these links have been discussed by Guy Debelle and are well-documented in the Bank’s latest Financial Stability Review (FSR).[3] In late 2014, the Australian Prudential Regulation Authority (APRA) set a benchmark for investor lending growth at each bank of no more than 10 per cent per annum (Graph 2).[4] Then in March 2017, APRA announced it would require interest-only loans – which are disproportionately used by investors – to be less than 30 per cent of each bank’s new lending. Over the same period, several other measures were implemented, including to tighten up the ways in which banks assessed the ability of borrowers to service their loans, and to limit the share of loans that constituted a large portion of the value of the property being purchased.
Graph 2
Banks responded to these requirements in two key ways. First, for some years now they have been tightening lending standards, thereby reducing the availability of credit to higher-risk borrowers. Second, banks raised interest rates for new and existing borrowers, first on investor loans from 2015, and then on interest-only loans in 2017 (Graph 3). In other words, the banks tightened the supply of credit, most notably for investors.
Graph 3
The FSR presents estimates of the effect of APRA’s first round of regulatory changes from late 2014. The key conclusions of that analysis are that, with the introduction of the 10 per cent investor credit growth benchmark:
the composition of new lending shifted away from investors and towards owner-occupiers, with little change in overall housing loan growth;
and housing prices have grown more slowly in regions with higher shares of investor-owned properties.
So, that’s the story that emphasises the effect of prudential measures on the supply of credit. And, in turn, the effect of tighter credit supply on the demand for housing.
I now want to draw your attention to the story less often told about the important causal link going in the other direction. In particular, the correction in the housing market over the past year or so appears to have been impinging on the demand for credit.
There are a number of reasons for the ongoing adjustment in housing prices:
the aforementioned reduction in the supply of credit;
the large increase in the supply of new housing associated with the high levels of housing construction in Brisbane, Melbourne and Sydney;
weaker demand from foreign buyers due to stricter enforcement of Chinese capital controls and various policy measures in Australia (many of which were implemented by various state governments) that have made it more costly for foreign residents to purchase and hold housing;
and last, but by no means least, the very substantial growth in housing prices over a long period, which had pushed housing prices to record levels as a share of household incomes and raised the prospects for a correction.
In support of this last point, I note that housing prices in Melbourne and Sydney (which had increased by 55 and 75 per cent respectively since 2012) are currently experiencing larger declines than in Brisbane (where housing prices had risen 20 per cent from 2012 to the recent peak; Graph 4).[5] It is also worth noting that housing prices are currently rising in Adelaide and Hobart. In addition, in Melbourne and Sydney house prices had run up further than apartment prices, and it is now house prices that have declined the most.[6]
Graph 4
While there may have been numerous causal factors, after a period of slowing housing price growth, more recently it is clear that housing prices are in decline in a number of major markets. This dynamic would have weighed heavily on the minds of buyers; particularly investors whose only motivation for buying is the return on the asset. An expectation of even a modest capital loss provides a strong incentive for them to delay buying a property, particularly in an environment of relatively low rental yields.
But how can we assess the role of factors affecting credit supply versus those affecting credit demand? Changes in the price of credit – that is, interest rates – can help. Other things equal, a fall in the supply of credit relative to demand can be expected to be associated with higher interest rates on housing loans. In contrast, a fall in the demand for credit (relative to supply) should be associated with a decline in interest rates. Just to be clear, I’m talking about the credit supply and demand curves shifting inwards. The former, by itself, reduces quantities while prices rise as the equilibrium shifts up along the demand curve. The latter, by itself, reduces quantities but decreases prices as the equilibrium shifts down along the supply curve.
So what’s happened to the interest rates borrowers are actually paying? The Securitisation Dataset provides estimates for both owner-occupiers and investors.
There has been a modest broad-based decline in outstanding mortgage rates in the Securitisation Dataset over the year to August (Graph 5). This suggests that banks were responding to weakness in credit demand by competing more vigorously to provide loans to high-quality borrowers. Indeed, looking just at new loans there is some evidence that average variable interest rates declined by more for investors than owner-occupiers, which is consistent with a noticeable decline in the demand for investor credit.
Graph 5
However, compositional changes might also explain why there was a slight decline in interest rates over this period. In particular, the tightening in lending standards has helped to shift the profile of loans away from higher-risk borrowers. This shift would have contributed to the decline in average interest rates paid as better quality borrowers tend to get loans at lower rates. However, it turns out that rates have declined over this period even within the set of low-risk borrowers – for example, those with low loan-to-valuation ratios (LVRs) (Graph 6). So the decline in average rates paid has been driven by factors other than just compositional changes.[7]
Graph 6
While banks began the process of tightening lending standards from around 2015, over the past year or so they have extended these efforts by applying greater rigour to their assessments of the ability of prospective borrowers to service loans. For example, banks have been assessing borrowers’ expenditures more thoroughly, which is likely to have contributed to reductions in the maximum loan sizes offered to borrowers.[8] Notwithstanding these changes, there are two other pieces of evidence that suggest that factors other than just a tightening in constraints on the supply-side have been affecting housing credit and housing market developments over the past year or so:
First, the majority of borrowers had earlier chosen to borrow much less than the maximum amounts offered by lenders. Hence, reductions in the sizes of maximum loans on offer over the past year does not imply one-for-one reduction in credit actually extended.[9]
Second, given that owner-occupiers have lower incomes on average than investors, they are likely to have faced noticeable reductions in maximum loan sizes as a result of the recent tightening in serviceability practices. However, owner-occupier credit growth has remained notably higher than investor credit growth.
In summary, weakness in credit demand – stemming from the dynamics in the housing market – has been a significant development over the past year or so. This is not to say that ongoing weakness of credit supply has not also been at work since then, but that credit supply is not the only part of the story.
Broader developments in the securitisation market
So far I have focused on the prudentially regulated banks. While the non-banks still only account for a modest share of outstanding mortgages, the sector has experienced very strong growth over recent years and is an important source of competition for the banks.
The RMBS market is a major source of funding for the non-bank providers of residential mortgages, and so RMBS issuance provides an indication of the recent growth in this sector. Last year, RMBS issuance was at its highest level since the global financial crisis. Non-banks’ issuance was in line with the high levels issued by this sector in the mid-2000s (Graph 7). In 2018, RMBS issuance in aggregate has been lower, but this has been largely been driven by decreased issuance by banks. Non-banks, by contrast, are continuing to issue close to $4 billion of RMBS per quarter.
Graph 7
This high volume of RMBS issuance by non-banks is consistent with a sizeable increase in their mortgage lending. This is an unsurprising consequence of the tighter supervision and regulation of mortgage lending by banks. This is not to say that non-banks are unregulated. They operate under a licensing regime managed by the Australian Securities and Investments Commission. And, as my colleague Michele Bullock mentioned recently, the members of the Council of Financial Regulators (which includes the Reserve Bank, APRA and ASIC) are monitoring the growth of the non-bank lenders for possible emerging financial stability risks.[10]
The Reserve Bank’s liaison indicates that non-banks have been lending to some borrowers who may otherwise have obtained credit from banks in the absence of the regulatory measures. Consistent with this, the Securitisation Dataset shows that a rising share of non-bank lending has been to investors. Indeed, there has been at least a five-percentage-point increase in the share of investor loans across all outstanding non-bank deals in the Securitisation Dataset over the past two-and-a-half years (Graph 8).[11] This is in contrast to the share of total bank loans to investors, which has been declining over that period.
Similarly, the share of non-bank loans that are on an interest-only basis has been stable over the past couple of years, whereas the share of bank loans that are interest-only has declined significantly over the same period.
Graph 8
The increase in the share of investor housing in deals issued by non-banks is one of the few noticeable changes in the composition of the collateral underpinning RMBS in the past couple of years. Indeed, for deals by non-banks the share of loans with riskier characteristics such as high LVRs or self-employed borrowers has been little changed.
One of the other changes to loan pools in new deals is a fall in seasoning (i.e. the age of loans when the deal is launched). This has been most pronounced for non-banks (Graph 9). It is consistent with non-banks writing a lot more loans. Hence, warehouses of their loans are reaching desired issuance sizes more quickly.
Graph 9
Despite the pull-back in RMBS issuance by the major banks over recent years, the broader stock of asset-backed securities (ABS) on issue increased by around $20 billion over the past 18 months, after remaining broadly stable for the previous 5 years (Graph 10; in addition to RMBS, ABS cover other assets such as car loans and credit card receivables). Demand for these additional asset-backed securities has been driven by non-residents.
Graph 10
As well as a shift in the composition of investors in ABS, we have observed some changes in deal structures over recent years. Of particular note, the average number of tranches per deal has increased from around four to eight (Graph 11). The increase has been broad-based across different types of issuers. This general trend covers deals with a greater number of tranches with differing levels of subordination, as well as deals where the top tranche is split into a number of individual tranches with different characteristics but equal subordination.
Graph 11
We have also seen what might be termed greater ‘specialisation’ of individual tranches. For instance, in recent years the use of one or more tranches with less common features – such as foreign currency, short term or green features – has increased.[12] This increased specialisation is consistent with issuers addressing the needs of different types of investors.
All of these developments point to the evolution of the Australian securitisation market over the past few years, with non-bank issuers playing an increasingly important role and non-resident investors taking an increasing share of issuance.
Benchmark interest rates, RMBS pricing and funding costs
The increase in bank bill swap (BBSW) rates in early 2018 has led to a modest rise in the funding costs of both banks and non-banks.[13] However, the increase in overall funding costs has been a bit greater for non-bank issuers than for banks. This is because banks have a sizeable proportion of their liabilities – such as retail deposits – that do not reprice in line with BBSW rates. Also, the bulk of non-banks’ loans are funded via RMBS issuance, and the cost of issuance has risen by a bit more than BBSW rates (Graph 12). The premium over the BBSW benchmark rate has risen to the level of two years ago. At the margin, these changes mean that non-bank issuers are not able to compete as aggressively on price for new borrowers as banks than was the case a year ago.
Graph 12
Most lenders have passed through modest increases in their funding costs to borrowers over the past few months. Despite these increases, competition for new loans remains strong, and interest rates for new loans are still well below outstanding rates. So credit supply is available to good quality borrowers on good terms and there is a strong financial incentive to shop around.
Interest Rate Benchmarks for the Securitisation Market
One final point I’d like to make on pricing, is that RMBS issuers and investors should be considering the implications of developments in interest rate benchmarks. In light of the issues around benchmarks such as LIBOR (the London Inter-Bank Offered Rate), substantial efforts have been made to reform these benchmarks to support the smooth functioning of the financial system.
BBSW rates are important Australian dollar interest rate benchmarks, and the 1-month BBSW rate is frequently used in the securitisation market. We have worked closely with the ASX and market participants to ensure that BBSW rates are anchored as much as possible to transactions in the underlying bank bill market. However, the most robust tenors are 6-month and 3-month BBSW, which are the points at which banks frequently issue bills to investors. In contrast, the liquidity of the 1-month BBSW market is lower than it once was. This is mainly due to the introduction of liquidity standards that reduced the incentive for banks to issue very short-term paper.
Given this, RMBS issuers should consider using alternative benchmarks.[14] One option would be to reference 3- or 6-month BBSW rates for new RMBS issues. Another option is the cash rate, which is the (near) risk-free benchmark published by the Reserve Bank.[15] Given the underlying exposure in RMBS is to mortgages rather than banks, it could make more sense to price these securities at a spread to the cash rate rather than to BBSW rates, which incorporate bank credit risk.
Issuers and investors globally, including in Australia, should also be prepared for a scenario where a benchmark they are using ceases to be published. In such an event, users would have to rely on the fall-back provisions in their contracts. However, for many products – including RMBS – the existing fall-back provisions would be cumbersome to apply and could generate significant market disruption. This is most urgent for market participants using LIBOR, since the regulators are only supporting LIBOR until the end of 2021. While we expect that BBSW will remain a robust benchmark, it is prudent for users of BBSW to also have robust fall-backs in place. The International Swaps and Derivatives Association (ISDA) recently conducted a consultation on how to make contracts more robust. We would expect Australian market participants to adopt more robust fall-backs in their contracts following this process.
Conclusion
As the housing market undergoes a period of adjustment, it is useful to have an understanding of some of the drivers at play. Much attention has been given to the effect of prudential measures in dampening the supply of credit and how this has affected the housing market. However, it is also important to acknowledge causation going in the other direction, whereby the softer housing market has led to weakness in credit demand. My assessment is that the slowing in housing credit growth over the past year or so is due to both a tightening in the supply of credit and weaker demand for credit. Within that environment, lenders are competing vigorously for high-quality borrowers.
Developments in the RMBS market are consistent with non-bank lenders providing an extra source of supply. While non-banks remain small as a share of total housing lending, developments over the past couple of years show that the sector continues to evolve. The recent increase in issuance spreads may provide some slight headwinds for the sector; however, spreads remain below their levels in early 2016.
Finally, I would urge both issuers and investors to be responsive to the forces affecting benchmarks used to price RBMS and to focus on preparing for the use of alternative benchmarks.
Australian fintech Tic:Toc – the world’s only fully digital home loan platform – has announced Bendigo Bank will use Tic:Toc’s proprietary technology to power its own instant home loan, Bendigo Bank Express.
The white label partnership will allow Bendigo Bank to be the first Australian lender offering a digital home loan application and assessment process under its own brand, accelerated with Tic:Toc technology.
Tic:Toc launched the World’s first instant home loan™ in July 2017, and is now collaborating with financial institutions to offer their platform as a service; helping bring traditional home loan processes up to speed.
Tic:Toc’s technology offers customers a streamlined digital fulfilment process, while lenders benefit from significant efficiencies in the way they can originate home loan customers. The automated assessment strips cost from the process and delivers higher responsible lending standards via inbuilt reg-tech and digital validation of income and expenses.
Announcing the agreement, Tic:Toc founder and CEO, Anthony Baum, said most importantly, the customer will be the ultimate beneficiary of the collaboration between financial institutions and fintechs.
“Tic:Toc is changing the customer experience when it comes to home loans. It’s no longer necessary to wait weeks for home loan approval, when it can be done digitally and conveniently.
“There’s actually not much difference between home loan options. But there can be a big difference in how that home loan is delivered, and the experience for the customer.
“Our automated assessment and approval technology also creates dramatic cost efficiencies for lenders.
“You only need to look to the United States to see how a digital home loan can change a market: Quicken Loans is now America’s largest home loan lender after launching their online product, Rocket Mortgage.
“Our partner, Bendigo and Adelaide Bank, shares our passion for great customer outcomes, so we’re delighted the Bank has chosen Tic:Toc to offer its customers a truly digital experience, if they want it.”
Bendigo and Adelaide Bank Managing Director, Marnie Baker said, “Our partnership with Tic:Toc is another example of Bendigo and Adelaide Bank investing in innovative technologies to offer Australian consumers more choice, and ultimately, better digital experiences.
“Our strategy means we can provide the best solution to customers by selecting the right partner to offer the right services to meet our customers’ needs and make it easier for them to do business with us. Fintech disruption, combined with banking innovation, is helping us drive better outcomes and we consider relationships with fintechs, such as Tic:Toc, as a mutually beneficial strategy.
“We believe we can grow our business through our vision of being Australia’s bank of choice and we will do this by providing new and existing customers with valued and relevant products and services, all while investing in new capability and innovation,” she said.
Bendigo Bank Express will be available to customers in early 2019.
Since its launch, Tic:Toc has received more than $1.6 billion in value of submitted home loan applications. While the white label product will be available directly from Bendigo Bank, the multi award-winning home loans originated by Tic:Toc are already available throughout Australia at tictochomeloans.com.
Finance Brokers Association of Australia (FBAA) has lodged its response to the royal commission’s interim report, arguing that brokers should not be “forced into even more documentary disclosure” regarding commissions and reiterating its support of the current remuneration structure, via The Adviser.
The interim report from the Royal Commission into Misconduct in the Banking, Superannuation and Financial Services Industry was released at the end of September, raising a swathe of questions regarding the mortgage broking industry.
In the report, the commission questioned some aspects of broker remuneration (including the perceived conflicts of upfront and trail commissions based on loan value and the now largely defunct volume-based commissions), outlined that there was “no simple legal answer” for explaining whom an intermediary (such as a broker) acts for, and questioned the need for a new duty on brokers.
“[I]t will be important to consider whether value and volume-based remuneration of intermediaries should be forbidden,” the commissioner wrote in his report, outlining findings from ASIC’s remuneration review that found that broker loans are marginally larger and have slightly higher loan-to-value ratios (LVRs).
While the full responses to the financial services royal commission have not yet been officially released, the Finance Brokers Association of Australia (FBAA) has revealed that it has tabled a “substantive submission” focusing on disclosure obligations, remuneration structures, compliance with existing laws, and the commission’s call for greater regulation.
Speaking of the association’s submission, FBAA managing director Peter White warned of any wholesale changes to the current broker remuneration model, arguing that major change may be detrimental to the industry.
“We are concerned that a change to the existing structure without fully understanding the impact of any proposed model may simply disrupt a stable and important profession with no corresponding improvement,” Mr White said.
“The majority of misconduct has been due to market participants failing to follow existing laws. This shows that further reforms should not be contemplated until there is compliance with current laws.”
The FBAA also said that its submission disputes claims that lenders paying value-based upfront and trail commissions could be a possible breach of the National Consumer Credit Protection Act (NCCP).
“The relevant section does not prohibit conflicts of interest, only those causing disadvantage, yet the term disadvantage is imperfect and can’t be relied on. It’s our submission that the laws already in place strike an appropriate balance,” Mr White said.
Touching on remuneration disclosure to brokers, the FBAA emphasised that brokers already provide “lengthy disclosure documents”, while the NCCP Act ensures that clients are well informed about the costs and commissions.
“We don’t want brokers to be forced into even more documentary disclosure and that view accords with ASIC’s findings that consumers can disengage because of information overload,” Mr White said.
The managing director of the FBAA concluded that that while the association agrees with the commission’s interim report that improvements could be made, he “agreed” that new laws or regulations are not necessarily the answer.
“Some of the responses to the royal commission have verged on emotional or value proposition statements, and while most have merit, we have deliberately taken a strong legal approach to our language to ensure our messages are clearly understood by the commissioner, a High Court Judge,” Mr White said.
The seventh round of hearings for the final round of the financial services royal commission will be held at the Lionel Bowen Building in Sydney from 19 to 23 November and at the Commonwealth Law Courts Building in Melbourne from 26 to 30 November.
The hearings will focus on “causes of misconduct and conduct falling below community standards and expectations by financial services entities (including culture, governance, remuneration and risk management practices), and on possible responses, including regulatory reform”.
It is expected that the seventh round will be the final round of the financial services royal commission, unless Commissioner Hayne requests, and is granted, an extension.
Commissioner Kenneth Hayne is expected to release his final report, which will include the topics of the fifth, sixth and seventh rounds of hearings (focusing on superannuation, insurance and “policy questions arising from the first six rounds”, respectively) by 1 February 2019.
Lenders Mortgage Insurer Genworth reported their 3Q18 earnings today with a statutory net profit after tax (NPAT) of $19.6 million and underlying NPAT of $20.4 million for the third quarter ended 30 September 2018 (3Q18). It is an important bellwether for the mortgage industry, and confirms recent softening. Whilst they have a strong capital position, their net investment returns were also down a little.
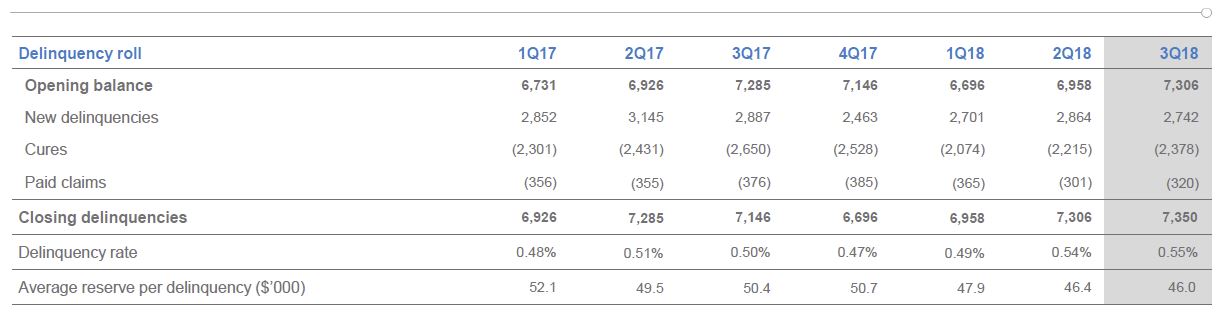
The Delinquency Rate (number of delinquencies divided by policies in force but excluding excess of loss insurance) increased from 0.50% in 3Q17 to 0.55% in 3Q18 (1H18: 0.54%). They called out “the continued trends of softening cure rates from a moderating housing market, tightening credit standards and increases in mortgage interest rates. This has resulted in a more subdued seasonal uplift than has historically been experienced by our business”. As a result, loss ratio guidance was revised higher to 50-55% from 40-50% guidance range previously.
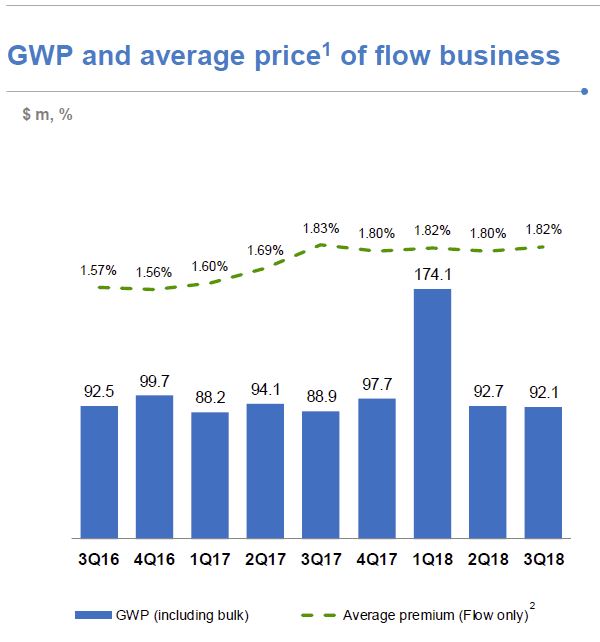
Gross Written Premium increased in 3Q18 reflecting growth in their traditional Lenders Mortgage Insurance (LMI) flow business.
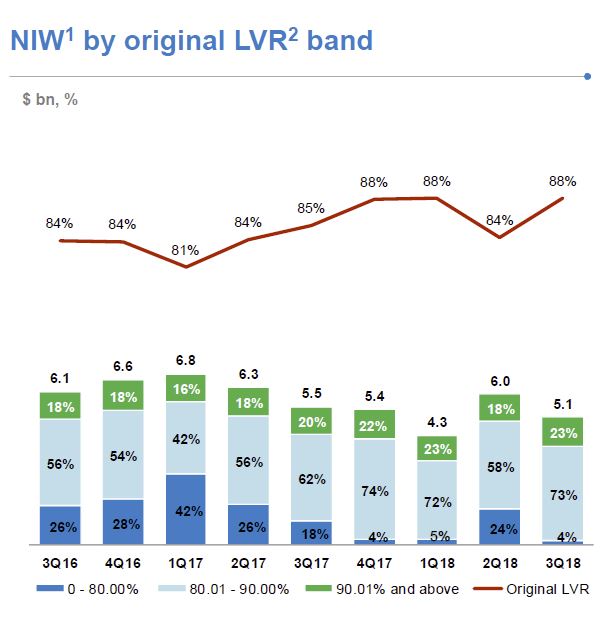
New business volume (excluding excess of loss insurance), as measured by New Insurance Written (NIW), decreased 7.3% to $5.1 billion in 3Q18 compared with $5.5 billion in 3Q17. NIW in 3Q17 included $0.8 billion of
bulk portfolio business versus no bulk portfolio business in 3Q18. Excluding the bulk portfolio business written in 3Q17, flow business NIW increased 8.5% in 3Q18.
Gross Written Premium (GWP) increased 3.6% to $92.1 million in 3Q18 (3Q17: $88.9 million). This does not include any excess of loss business written by Genworth’s Bermudan entity and reflects the greater proportion of traditional LMI flow business written by Genworth lender-customers.
Net Earned Premium (NEP) decreased 32.0% from $100.1 million in 3Q17 to $68.1 million in 3Q18. This includes the adverse $24.8 million impact of the 2017 Earnings Curve Review, and lower earned premium from current and
prior book years. Excluding the 2017 Earnings Curve Review impact, NEP would have declined 7.2% in 3Q18.
The adverse impact on NEP of the 2017 Earnings Curve Review has been reducing quarter on quarter since it took effect on 1 October 2017. Whilst the 2017 Earnings Curve Review has the effect of lengthening the time-period over which premium is earned, it does not affect the quantum of revenue that will be earned.
Genworth’s Unearned Premium Reserve as at 30 September 2018 was $1.2 billion.
The Delinquency Rate (number of delinquencies divided by policies in force but excluding excess of loss insurance) increased from 0.50% in 3Q17 to 0.55% in 3Q18 (1H18: 0.54%). This was driven by two factors. Firstly, there was a decrease in policies in force following completion of the lapsed policy initiative undertaken by the Company in 2Q18. The second factor was the increase in delinquency rates year-on-year across all States (in particular Western Australia, New South Wales and to a lesser extent South Australia). In terms of number of delinquencies, Western Australia and New South Wales experienced the largest increase with Queensland and Victoria experiencing a decrease in number of delinquencies.
New delinquencies were down in the quarter (3Q18: 2,742 versus 3Q17: 2,887) with mining regions showing signs of improvement. In non-mining regions, the softening in cure rates experienced in 1Q18 and 2Q18 continued in 3Q18 with the traditional seasonal uplift in the third quarter being more subdued than prior years.
Net Claims Incurred for the quarter were down 3.2% (3Q18: $35.8 million versus 3Q17: $37.0 million). The Loss Ratio in 3Q18 was 52.6% up from 37.0% in 3Q17, reflecting the impact of lower NEP due to the 2017 Earnings Curve Review. Excluding the impact of the 2017 Earnings Curve Review the loss ratio would have been 38.6%.
The Expense Ratio in 3Q18 was 32.5% compared with 29.7% in 3Q17, reflecting the lower NEP.
Investment Income of $21.5 million in 3Q18 was up 38% on the prior corresponding period (3Q17: $15.6 million). The 3Q18 Investment Income included a pre-tax mark-to-market unrealised loss of $1.2 million ($0.8 million after-tax) versus a pre-tax mark-to-market unrealised loss of $12.0 million ($8.4 million after-tax) in 3Q17.
As at 30 September 2018 the value of Genworth’s investment portfolio was $3.2 billion, more than 90% of which is held in cash and highly rated fixed interest securities and $169 million of which is invested in Australian equities in line with the Company’s low volatility strategy. After adjusting for mark-to-market movements the 3Q18 investment return was 2.80% p.a. marginally down from 2.88% in 3Q17.
Mortgage delinquencies have remained broadly stable over the year, but are expected to increase moderately as a result of the property market slowdown, according to Moody’s Investors Service, via MPA.
While the agency said it expected only a slight uptick in arrears over the coming year, it projected that NSW and Victoria would be the most affected, largely because of high household leverage in these states and the impact of interest-only loans switching to P&I repayments.
Keeping arrears contained, however, is completely reliant on solid macroeconomic conditions. If there is strong job growth and stable employment, borrowers will be more able to make their repayments.
It found that the proportion of residential mortgages that were more than 30 days in arrears was 1.58% in May 2018, compared to 1.62% in May 2017. As expected, delinquency rates were lower in capital cities. The most affected regions were Western Australia and Queensland, where borrowers have suffered from a lack of mining and resource-related jobs and drought.
However, another ratings agency, S&P, struck a more cautionary tone in its latest arrears report. It found that “there has been an ongoing increase in home loans that are more than 90 days in arrears”, which it defines as advanced.
“Loans more than 90 days past due reached 0.74% in August, making up around 54% of total arrears. This is up from 42% five years ago.”
The regional bank mortgage originators reported the highest percentage of loans in arrears in August, at 1.33%, followed by the major banks, at 0.99%. This heightened pressure regionally echoes Moody’s findings.
To re-cap, the number of loans in the “advanced stages of arrears” has to do with geographic pressures, repayment shock from the IO loan transition, general mortgage stress, and out-of-cycle rate rises, S&P said.
Likewise, the agency said it expected falling house prices to put further pressure on mortgage arrears in coming months, especially among borrowers with higher loan-to-value rations who haven’t had time to build up equity or accumulate mortgage buffers.
“This could tip some borrowers into a negative equity position, which would significantly impede their refinancing prospects in the current lending environment. Across all RMBS loan portfolios we expect borrowers with LTV ratios of 80% and higher to be most at risk. These loans account for around 13% of RMBS loan portfolios,” S&P said
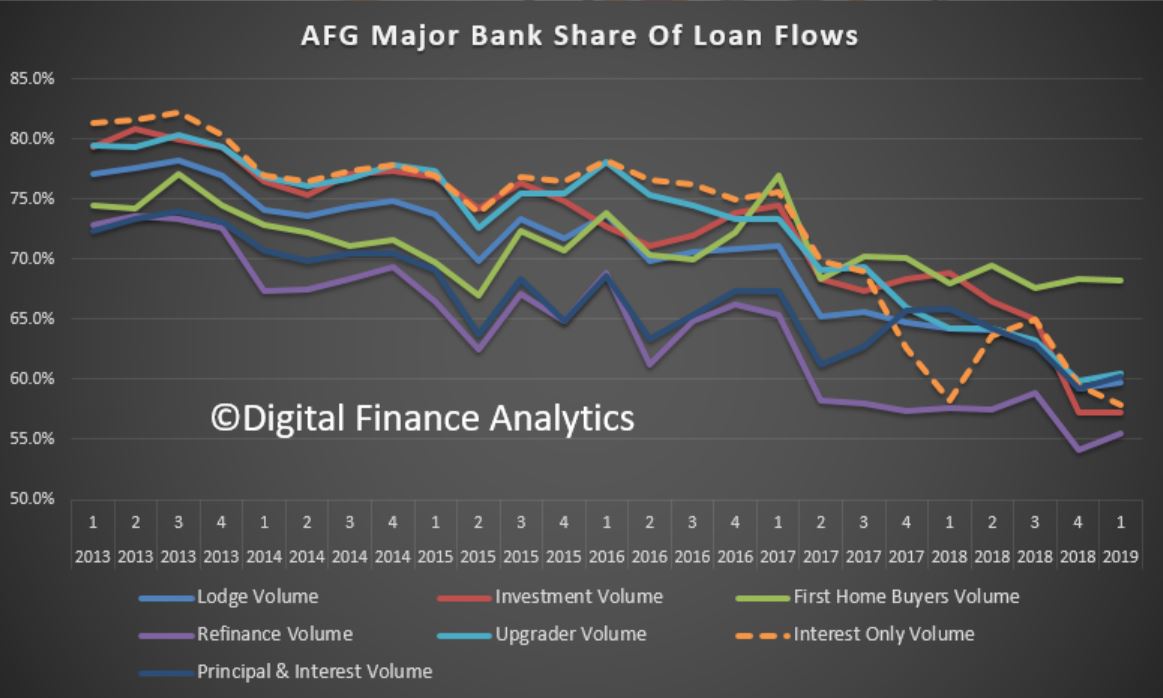
AFG Mortgage Index figures released today show the country’s lending in a holding pattern with first home buyers the only category of buyer to record an increase for the first quarter of the 2019 financial year. Of course the AFG data only shows their own channels, but its a good indicator nevertheless.
The volume of mortgages processed by AFG declined 2% on the prior quarter. AFG brokers lodged 27,900 mortgages during Q1 19, totalling $14.2 billion, compared with 28,883 mortgages and $14.5 billion in the final quarter of the 2018 financial year.
AFG CEO David Bailey explained the results: “As the Financial Services Royal Commission continues to rattle the market Australian homebuyers are feeling the pinch as lenders tighten their borrowing criteria. Compared to the same quarter last year, lending volumes are down by just under 5% – a sure sign of a tightening market. The availability of credit has impacted investors most of all, with that category dropping by 1% to 27% of loans processed.
Refinancers were steady at 23% and Upgraders were also static at 43%.
New South Wales and Victoria are both down on the prior quarter, 2.5% and 6% respectively. Queensland also recorded a drop across the quarter, down 2%. Gains were recorded in SA – 2% up on last quarter, NT – up 22% and WA with an increase of 6% for the quarter.
Loan to Value Ratios (LVR) have increased in SA, NSW and WA.
The national average loan size has increased to a record $509,736, led by increases in average loan sizes in NSW, SA and Victoria.
“NSW has recorded an increase in average loan size of 3%, which we suspect is the result of a drop in apartment sales and lenders tightening criteria to investors – which are usually a lower average loan size. Both factors are driving up the average overall loan size in that state.
During the quarter many lenders moved to increase interest rates independent of the RBA, causing many borrowers to rethink their arrangements. “With the recent round of rate rises flowing through, many consumers have been speaking with their brokers to discuss the value of fixing all or part of their loans,” he said.
“Fixed rates have risen to 18.9% of loans by product category, whilst standard variable loans dropped to 64.3%. Basic variable products are also back in favour, increasing to 11.2% of all loans.
The major lenders clawed back some market share during the first quarter of the new financial year to now be sitting at 59.8%. This figure is still well below the high 70’s they had back in 2013, and much lower than they record outside of the third-party channel.
“The major lenders took some share from the non-majors after treading cautiously for the prior two quarters. The non-majors are still sitting at near historical highs with 40.2% market share after peaking at 40.8% last quarter.
“This is further evidence of the value brokers deliver to competition in the Australian lending market. Refinancers (55.5%) and Upgraders (60.5%) are favouring the competitive offers available from the non-major lenders.
According to Moody’s, on 11 October, the Federal Home Loan Mortgage Corp. reported that US 30-year fixed-rate mortgage rates reached their highest level since April 2011.
The average rate was 4.90% for the week that ended 11 October, compared with 3.91% a year earlier. For US banks, higher mortgage rates will constrain mortgage origination volume, keeping their once-sizable mortgage banking revenue at depressed levels, a credit negative. Higher interest rates will also heighten the potential that some customers will have trouble servicing their existing debt and could translate into weaker credit quality, a further negative for US banks.
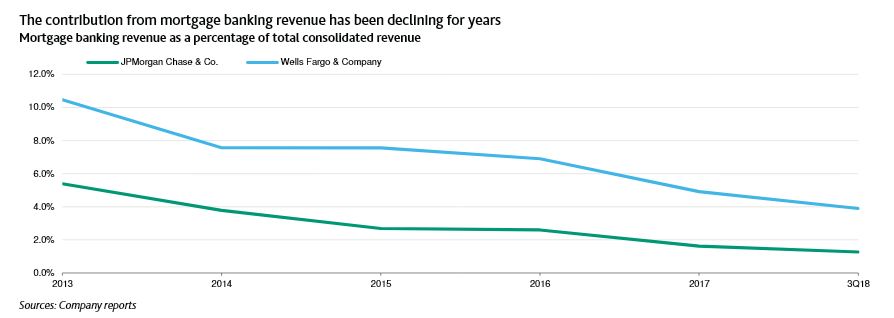
Mortgage banking revenue at US banks has been on a downward trajectory for some time. This reflects both a drop in origination volume and lower gain-on-sale margins. The volume decline has followed a multi-year period during which consumers took advantage of rising home values and historically low interest rates to refinance their mortgages. Now that refinancing volume is at a lower level, home purchases are the source of most current originations.
Reduced gain-on-sale margins reflect heightened pricing competition that resulted from excess industry capacity. Going forward, although volume may not increase because of the climb in interest rates, gain-on-sale margins could rise as industry capacity contracts.
The 12 October third-quarter 2018 earnings reports from some of the country’s largest banks illustrate these trends. As shown in the exhibit below, both Wells Fargo & Company and JPMorgan Chase & Co., the country’s two largest mortgage originators, released results that showed mortgage banking revenue remains at or near multi-year lows. Specifically, at Wells Fargo, although mortgage banking revenue climbed in the quarter, for the nine months that ended 30 September 2018, mortgage banking revenue accounted for 3.9% of total firm-wide revenue, down from 10.5% as recently as 2013. At JPMorgan Chase, mortgage banking revenue declined in the third quarter and, on a year-to-date basis, it accounted for just 1.3% of total firm-wide revenue, down from 5.4% in 2013.
The recent rise in mortgage interest rates makes it unlikely that US banks’ mortgage banking volume and revenue can rebound materially in the next few quarters. However, given that mortgage banking has long been a cyclical business, the banks can improve their profitability by reducing capacity, as they have done in prior periods of lower volumes. Indeed, both Wells Fargo and JPMorgan Chase were reported to have reduced hundreds of positions within their respective mortgage banking units in the past few months. We believe both firms’ recent performance and response are representative of the wider industry trend More broadly, the recent rise in interest rates heightens the potential that some borrowers will have trouble servicing their existing debt, raising the potential of higher loan delinquencies. However, the US economy remains robust and the banks’ latest earnings reports show continued strong credit quality, an indication that higher rates have not yet undermined existing loan performance.
I have to say I am getting a little tired of all the various industry bodies coming out and trying to defend their corner – Mortgage Brokers of course came in for some severe criticism in the Royal Commission, especially about conflicted advice in the context of commissions. Remember the bigger the loan they write, the more they get paid!
The industry association has responded to a suggestion made by Commissioner Hayne that the payment of value-based commissions to brokers “might” be breaching NCCP obligations.
Executive director of the Finance Brokers Association of Australia (FBAA) Peter White has rejected claims made by Commissioner Kenneth Hayne in the interim report of the Royal Commission into Misconduct in the Banking, Superannuation and Financial Services Industry.
Commissioner Hayne alleged that lenders paying value-based upfront and trail commissions could be in breach of section 47(1)(b) of the National Consumer Credit Protection Act (NCCP).
Section 47(1)(b) states that licensees must “have in place adequate arrangements to ensure that clients are not disadvantaged by any conflict of interest that may arise wholly or partly in relation to credit activities engaged in by the licensee or its representatives”.
However, Mr White said that the interim report did not find any systemic evidence to suggest that conflict of interest in the payment of commissions to brokers directly disadvantages clients.
The FBAA director added that he believes licensees already have “adequate arrangements” in place to prevent conflicts of interest.
Mr White added: “The commissioner pointed out that a breach of the NCCP is not an offence or open to civil penalty.
“I would argue that the cancellation or suspension of a broker’s licence by ASIC is a substantial penalty in itself.”
Mr White also sought to dismiss concerns raised by the commissioner over the number of loans submitted via the broker channel with higher loan-to-value ratios (LVRs).
“It’s the broker’s duty to put the client’s interest first and to meet, if not exceed, their expectations,” the FBAA executive director said.
“In meeting client needs, brokers are often asked to source higher leverage loans to appropriately support their needs, taking into account a client’s debt levels and loan-to-valuation ratios.
“It’s a broker’s ability to source a specific loan product to suit their client’s specific needs that gives us a market advantage.”
Mr White concluded by stating that brokers were at the forefront of efforts to improve service delivery and remuneration structures.
The FBAA echoed comments made by the Mortgage & Finance Association of Australia (MFAA), which told its members: “The self-regulatory approach the industry is taking through the [Combined Industry Forum] remains the best way to improve customer outcomes, standards of conduct and culture, while preserving and promoting a vibrant and competitive mortgage broking industry that encourages consumer choice.”
Submissions in response to the commission’s interim report can be made on the royal commission website and must be received no later than 5pm on 26 October 2018.
The commission will release a final report, which will include the topics of the fifth, sixth and seventh rounds of hearings (focusing on superannuation, insurance and “policy questions arising from the first six rounds”, respectively) by 1 February 2019.
The use of the Household Expenditure Measure as a benchmark for borrowers’ living expenses has been called into question by the royal commission, which has suggested that more verification needs to be undertaken, via The Adviser.
The interim report from the Royal Commission into Misconduct in the Banking, Superannuation and Financial Services Industry, which totals more than 1,000 pages over three volumes, has raised a number of “policy-related issues” arising from the first four rounds of public hearings, which covered consumer lending, financial advice, SME loans and the experiences of regional and remote communities with financial services entities.
As well as scrutinising broker commissions and banker incentives, Commissioner Kenneth Hayne looked at how lenders and brokers utilise the Household Expenditure Measure (HEM) when fulfilling their responsible lending obligations — an issue that arose during the first round of hearings and has recently been a source of debate in the broking industry.
In the interim report, Commissioner Hayne noted that the National Consumer Credit Protection Act 2009 (NCCP Act) requires credit licensees to assess whether the credit contract would be “unsuitable” for the consumer if the loan contract is made or (in the case of a credit limit increase) the limit is increased.
He highlighted that steps to ascertain whether the loan is unsuitable include “making reasonable inquiries” about the consumer’s requirements and objectives in relation to the credit contract, knowing the consumer’s financial situation and taking “reasonable steps” to verify the consumer’s financial situation.
However, Commissioner Hayne argued that the case studies from the first round of hearings suggested that “credit licensees too often have focused, and too often continue to focus, only on ‘serviceability’ rather than making the inquiries and verification required by law”.
He wrote in the interim report: “More particularly, identifying that the consumer’s income is larger than a general statistical benchmark for expenditures by consumers whose domestic circumstances are generally similar to those of the person seeking the loan does not reveal the particular consumer’s financial situation.
“All it does is convey information to the credit licensee that it may judge sufficient for it to decide that the risk of the consumer failing to service the loan is acceptable.
“Verification calls for more than taking the consumer at his or her word.”
Commissioner Hayne asked in the interim report: “If the consumer claims to have regular income, what step has the credit licensee taken to verify the claim?”
Lenders “more often than not” failed to verify outgoings
Noting that “verification is often not difficult” and can been made via bank statements, Commissioner Hayne added that although “the evidence showed that, more often than not, each of ANZ, CBA, NAB and Westpac took some steps to verify the income of an applicant for a home loan”, it also showed that “much more often than not, none of them took any step to verify the applicant’s outgoings”.
His interim report was critical of the industry’s reliance on HEM, with the report outlining: “The general tenor of the evidence was that a lender satisfied responsible lending obligations to verify a borrower’s financial position if the lender assessed the suitability of the loan by reference to the higher of a borrower’s declared household expenses and the Household Expenditure Measure (HEM) published by The Melbourne Institute (or some equivalent measure) and that verifying outgoings was ‘too hard’.
“But what was meant by verifying outgoings being ‘too hard’ was that the benefit to the bank of doing this work was not worth the bank’s cost of doing it.”
Commissioner Hayne highlighted the ANZ case study in which a borrower supplied ANZ a copy of his bank statement (from another lender) as verification of his income, but that the “outgoings recorded in that statement were obviously inconsistent with what the borrower recorded as his outgoings”.
He said: “ANZ’s procedures did not require consideration of, and in fact the relevant bank employees did not look at, the bank statement for any purpose other than verifying income.”
The commissioner noted that ANZ did not think that there was a “material uplift” in reviewing customer bank statements for general account conduct to identify whether there were “any obvious inconsistencies between a customer’s stated expenses and transaction history, or any general indicators of financial stress”.
He pointedly remarked that the bank “did not make reference to whether or not the responsible lending requirements suggested or required otherwise”.
Further, the interim report outlined that although Westpac (which recently paid a $35 million penalty for failing to verify expenses) has expanded its expenses categories this year, “in most cases, Westpac does not require customers to provide regular transaction statements for non-Westpac accounts, and the ‘verification’, as distinct from the ‘inquiry’, of the customer’s expenses remains largely with the customer”.
As well as the lack of income verification being undertaken, the interim report suggested that relying on the HEM benchmark was not always appropriate as it was only a “modest expenditure” calculation and “takes no account of whether a particular borrower has unusual household expenditures, as may well be the case, for example, if a member of the household has special needs or an aged parent lives with, or is otherwise cared for, by the family”.
Commissioner Hayne’s report concluded: “It follows that using HEM as the default measure of household expenditure does not constitute any verification of a borrower’s expenditure. On the contrary, much more often than not, it will mask the fact that no sufficient inquiry has been made about the borrower’s financial position. And that will be the case much more often than not because three out of four households spend more on discretionary basics than is allowed in HEM and there will be some households that spend some amounts on ‘non-basics’.”
He added: “Using HEM as the default measure of household expenditure assumes, often wrongly, that the household does not spend more on discretionary basics than allowed in HEM and does not spend anything on ‘non-basics’.”
As such, Commissioner Hayne asked: “Should the HEM continue to be used as a benchmark for borrowers’ living expenses?”
He also questioned whether the “processes used by lenders, at the time of the hearings, to verify borrowers’ expenses meet the requirements of the NCCP Act”.
The interim report has also asked members of the public to outline what steps, consistent with responsible lending obligations, a lender should take to verify a borrower’s expenses.
Submissions in response to the interim report can be made on the royal commission website and must be received no later than 5pm on 26 October 2018.
The commission will release a final report, which will include the topics of the fifth, sixth and seventh rounds of hearings (focusing on superannuation, insurance and “policy questions arising from the first six rounds”, respectively) by 1 February 2019.
According to UBS’ Australian Banking Sector Update on 19 September, which involved an anonymous survey of 1,008 consumers who took out a mortgage in the last 12 months, 18 per cent stated that they “don’t know” when their interest-only (IO) loan expires, while 8 per cent believed their IO term is 15 years, which doesn’t exist in the Australian market, via InvestorDaily.
The research found that less than half of respondents, or 48 per cent, believed their IO term expires within five years.
The investment bank said that it found this “concerning” and was worried about a lack of understanding regarding the increase in repayments when the IO period expires.
The Reserve Bank of Australia (RBA) earlier this year revealed that borrowers of IO home loans could be required to pay an extra 30 per cent to 40 per cent in annual mortgage repayments (or an additional “non-trivial” sum of $7,000 a year) upon contract expiry. The central bank noted that the increase would make up 7 per cent, or $120 billion, of the total housing credit outstanding.
According to the RBA, 2020 is the year that most of the 200,000 at-risk IO loans will reset.
UBS’ research, which was conducted between July and August this year, revealed that more than a third of respondents, or 34 per cent, “don’t know” how much their mortgage repayments will rise by when they switch to principal and interest (P&I) contracts.
More than half, or 53 per cent, estimated that their repayments will increase by 30 per cent once their IO term ends, while 13 per cent expected their repayments to rise by more than 30 per cent, which is the base case for most IO borrowers.
“This indicates that the majority of IO borrowers remain underprepared for the step-up in repayments they will face,” UBS stated in its banking sector update report.
Further, nearly one in five respondents to the UBS survey, or 18 per cent, said that they took out an IO loan because they can’t afford to pay P&I.
“With a lack of refinancing options available and the banks reluctant to roll interest-only loans, these mortgagors will have to significantly pull back on their spending, sell their property, or [they] could potentially end up falling into arrears,” the investment bank stated in its report.
UBS also found it concerning that 11 per cent of respondents said they expected house prices to rise and planned to sell the property before the IO period expires.
“This is a risky strategy given how much the Sydney and Melbourne property markets have risen, and have now begun to cool,” the investment bank said.
Overall, the top two motivations for taking out an IO loan, according to UBS survey participants, were “lower monthly repayments gives more flexibility on my finances” (44 per cent) and “to maximise negative gearing” (43 per cent).
The second motivation was selected by 32 per cent of owner-occupier borrowers who cannot benefit from negative gearing as the tax incentive applies to investors, 53 per cent of which cited this benefit.
Most banks yet to implement tighter expense checks
The investment bank reiterated in its banking sector update that it expects mortgage underwriting standards to tighten further in the next 12 months. It claimed that, contrary to comments by regulators that “heavy lifting on lending standards is largely done”, most banks are yet to fully verify a customer’s living expenses and a large number of customers are still not submitting payslips and tax returns.
“As a result, we believe there is likely to be much work required for the banks to comply with the royal commission’s likely more rigorous interpretation of responsible lending and improve mortgage underwriting standards. We expect this is likely to play out over the next 12 months,” UBS stated in its update report.
UBS went on to maintain its belief that Australia is at risk of experiencing a “credit crunch” in the next couple of years, but it is waiting on a number of “signposts” to make a more calculated judgement. These include the Hayne royal commission’s interim and final report, major bank policies around living expenses, details from the Australian Prudential Regulation Authority on debt-to-income caps, the federal election, changes in property prices, and sentiments from the RBA.
“We remain very cautious on the Australian banks,” the investment bank concluded in its update report.
“After a prolonged 26 years of economic growth, many excesses have developed in the Australian economy, in particular the Sydney and Melbourne housing market.
“We believe the royal commission creates an inflection point and credit conditions are tightening materially. Whether Australia can orchestrate an orderly housing slowdown remains to be seen, and we think the risks of a credit crunch are rising given the significant leverage in the Australian household sector.”