Mortgage brokers don’t always obtain better priced loans for clients than the banks and they don’t always offer a diverse range of loan options, according to a joint submission from four consumer groups to Treasury.
While the submission, written by CHOICE, Consumer Action, Financial Counselling Australia and Financial Rights Legal Centre, released on Tuesday (29 August), centred on the Australian Securities & Investments Commission’s (ASIC) Review of Mortgage Broker Remuneration, it also made a number of suggestions outside of the six proposals initially presented by ASIC.
One key call to action involved increasing standards in the industry, with consumer groups saying that some clients fail to receive the service they expect when visiting a broker.
“Advertisements for brokers claim that they will find customers the right loan, provide tailored advice or get a great loan for the client. However, their actual obligation to clients is quite low – brokers are only required to provide credit assistance that is ‘not unsuitable’ for the consumer.”
The groups called on standards to be lifted, pointing to findings in the original ASIC report which showed that:
The difference in interest rates between proprietary and third party channels is small with the direct channel being cheaper in some cases
Individual broker businesses send 80% of their loans to four ‘preferred’ lenders with these lenders being different across brokerages
“Given the trust consumers place in brokers, they should all be held to a higher standard than arranging a ‘not unsuitable’ loan for their customers. They should be required to act in the best interests of their customers,” the groups wrote.
The National Consumer Credit Protection (NCCP) Act should more clearly define what a mortgage broker is and detail any new obligations that a broker should meet, they added.
Scrapping commissions
The groups also called for both upfront and trail commissions to be removed to “best serve consumer interests”. The current remuneration structure creates two types of conflicts, they said, with brokers possibly either recommending loans too large for a consumer or recommending one loan over another due to its higher commission.
“Based on cases that financial counsellors and community legal centres see, it appears that some mortgage brokers are so motivated by commissions that they put customers at significant risk and take extreme steps, including likely document fraud and breaches of the responsible lending obligations under the [NCCP Act],” they said.
The groups recommended that upfront commissions be replaced with a fixed fee for advice model (either through a lump sum or hourly rates) while trail be scrapped entirely.
“For consumers, there is some implication that trail accounts for service delivered by the broker over the life of a loan. It is incredibly unclear what service is being delivered,” they said.
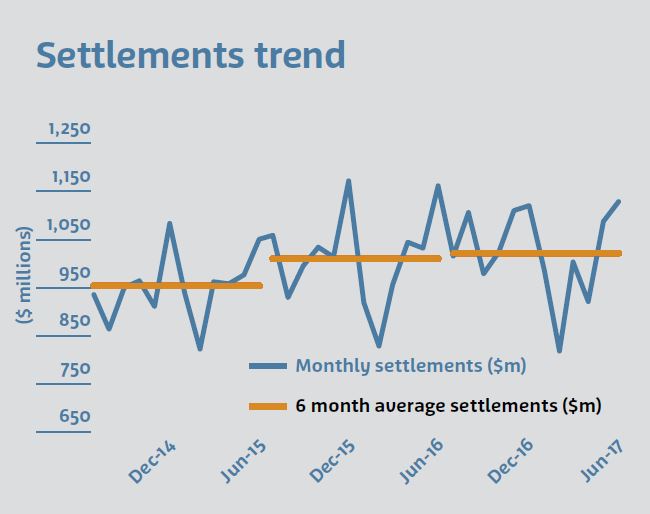
Mortgage Choice Limited announced its annual results for the financial year ended 30 June 2017. NPAT on a cash basis was $22.6 million – up 10.2% on FY16, although revenue was up 1.1% to $199 million. They have 654 credit representatives in Australia and 486 franchises. 88.5% or gross revenue came from Mortgage Choice Broking. Settlements rose 1.2% to $12.3 billion and the loan book grew to $53.4 billion.
NPAT on a statutory basis was $22.2 million – up 13.5% on FY16.
Mortgage Choice’s core broking business recorded its best ever settlement result, with settlements totalling $12.3 billion.
Mortgage Choice’s loan book reached a record $53.4 billion – up 3.2% on FY16.
Financial Planning gross revenue surpassed $10 million in FY17 while Gross Profit grew 26% from FY16.
Funds Under Advice and Premiums In Force both rose significantly, up 60.3% and 26.0% respectively to $532.4 million and $24.2 million.
A fully franked final dividend of 9 cents per share was declared by the Board. Total dividend for the year was 17.5 cents per share – an increase of 1 cent on FY16.
46 new Greenfield Franchises added to the network, the highest number recruited in one year.
11.5% of total cash gross revenue derived through diversified services.
“Throughout FY17, the Group performed very well, with settlements volumes, total loan book and financial planning revenue all growing to record levels,” Mortgage Choice chief executive officer John Flavell said.
“Cash Net Profit After Tax grew by more than 10% for the second consecutive year, highlighting the ongoing strength of the business.
“FY17 was a year that saw increased complexity across all areas of retail financial services. The volume and velocity of policy and pricing changes for lending products, as well as wealth and insurance solutions, was unprecedented. This complexity drove more consumers to Mortgage Choice than ever before.
“Mortgage Choice delivered increased value to our customers by addressing more of their financial needs and creating simplicity in a complex environment.
“Our core broking business performed very well, with home loan settlements reaching $12.3 billion for the first time and our loan book grew 3.2%, reaching a new high of $53.4 billion at 30 June 2017.”
Mr Flavell said it wasn’t just the core broking business that performed well throughout FY17, with the Company’s diversified services also delivering impressive results.
“Throughout FY17, the gross revenue generated from our diversified services continued to grow,” he said.
“For the year, 11.5% of the Company’s cash gross revenue came from our diversified offering – up from 10.5% in FY16.
“Our Financial Planning division delivered its first full year profit, with Funds Under Advice and Premiums In Force rising 60.3% and 26.0% respectively to $532.4 million and $24.2 million.
“As this business matures and our advisers spend more time building relationships with our network of mortgage brokers, referrals naturally grow. Throughout FY17, the number of referrals from the core broking business increased by 13%.
“At Mortgage Choice, we want to be Australia’s leading provider of financial choices and advice, delivering exceptional customer value. To achieve this, we understand that we have to be able to cater to our customers’ growing financial needs and deliver expert advice across a full suite of services.
“To this end, at the beginning of FY17, the Company launched a new branded asset finance offering. The new service offering was embraced by the network, with more than 1,600 vehicle, plant and equipment loans financed in the first year alone.
“As we move into FY18, our asset finance offering will continue to gather momentum and deliver growth for the Company.
“Beyond the strong financial performance, FY17 was also a record year for network growth. 46 new Greenfield Franchises were recruited over the year and the number of Credit Representatives across the country increased to 654, well up from FY16.
“As these new recruits become more skilled and increase their productivity over the coming months and years, we will see continued growth in the business.”
“In addition, our shareholders will be very pleased with the dividend result. The ongoing strength of the Mortgage Choice business means we have been able to deliver a fully franked dividend of 17.5 cents per share for the year, a 1 cent increase on FY16,” he said.
Future growth
Heading into FY18, Mr Flavell said he is confident the business can continue to deliver exceptional results in an increasingly complicated market.
“Mortgage Choice’s continual investment in the business will help us to drive solid results today, tomorrow and over the longer term,” he said.
“We will focus on increasing efficiency for the current network, the continued growth of our network via targeted recruitment and a commitment to assisting new recruits run successful, profitable businesses.
“In addition, we will continue to accelerate our local area marketing activities to deepen the relationships we have with our customers. Throughout FY17, we implemented a series of grass-roots brand awareness initiatives that proved to be very successful. You may well have noticed a new Mortgage Choice retail store in your local area, seen more Mortgage Choice branded cars on the road, or heard more Mortgage Choice advertising on the radio. Heading into FY18, the momentum created will be carried forward.”
Mr Flavell said the Company had identified its four key business priorities for the year ahead. These priorities include:
• Increase and diversify franchisee revenue and asset growth;
• Distribution growth;
• Deeper customer relationships; and
• NPAT growth.
“I am confident the business can deliver to all of the aforementioned priorities whilst maintaining our focus on our 2020 vision,” he said.
“We are in a very exciting stage of the business. We are successfully transitioning Mortgage Choice into a diversified financial services company, which is providing additional value to our customers, franchisees, and our shareholders,” he said.
“Throughout FY17, we achieved a lot as a business. These achievements were realised against a backdrop of increasing complexity and various market challenges. Whilst we are expecting the market to remain complex, we are well positioned to provide expert advice to more customers for all of their financial services needs.”
Australian Finance Group (AFG) reported a net profit after tax (NPAT) of $30.2 million for the 2017 financial year (FY2017). This excludes the impact of the recognition of AFG Home Loans (AFGHL) white label settlements relating to prior years (normalised NPAT). This is slightly ahead of the result forecast and an increase of 33% on FY2016.
They now have around 2,900 mortgage brokers, and process on average around 10,000s loan each month with 45 lenders on their panel.
AFG Chief Executive Officer David Bailey said the strong result has been driven by AFG’s core business of residential mortgages, commercial lending, and the continued strong growth in the own-branded AFGHL business.
“Today’s results are a testament to AFG’s strategy of continuing to focus on our core business and growth through earnings diversification. We are very pleased with our progression down this path.”
These results have been achieved in an environment of flat credit growth and significant regulatory changes impacting foreign investment and credit appetites of Australia’s lenders.”
Highlights include:
Reported NPAT of $39.1 million, normalised NPAT of $30.2 million
White label AFG Home Loans settlements of $2.7 billion
Combined residential and commercial loan book of $133 billion, growth of 11% over FY2016
Residential settlements of $34.3 billion
Commercial settlements of $2.8 billion
Final dividend 5.5 cents per share
Earnings Per Share (EPS) for FY2017 is 14 cents per share based on normalised NPAT
ROE of 31%
Company Outlook
The AFGHL business finished the full year 2017 with settlements of $2.7 billion. This result represents a 38% increase on FY2016 and evidences the success of our ongoing strategy to deliver competitive choice to Australian borrowers. The AFGHL loan book is now $5.5 billion, an increase of 44% from $3.8 billion in FY2016.
Overall, the company has a residential loan book of $126 billion that will generate ongoing trail commission. The AFG Home Loans securitised book has seen a 10% increase in settlements for FY2017 to finish the financial year at $1.15 billion, whilst maintaining a strong net interest margin.
Mr Bailey noted the company has achieved another strong year in the recruitment of brokers. From 2,650 active brokers in FY2016, numbers have increased by 8.5% to 2,875.
“In a clear sign of the health of the commercial lending market AFG Commercial asset financing settlements rose 20% to finish the year at $445 million,” he said.
“AFG Commercial mortgage settlements for the year were $2.84 billion, which represents just 0.7% of the overall $410 billion commercial lending market in Australia. The potential for growth is tangible.”
The small to medium enterprise (SME) segment of the market in particular is also one where AFG is optimistic. AFG is poised to harness this growth with the impending rollout of an Australian-first SME lending platform. The new platform, AFG Business, will enable our network of brokers to provide small business borrowers access to a broad range of options and deliver faster access to capital.”
Market conditions
The complexity of the Australian lending market has increased significantly in the past 12 months. “AFG began its listed life with around 1,450 products on its lending platform,” explained Mr Bailey. “That number has now increased to more than 3,400 at FY2107.
“The growth is a reflection of multiple changes by lenders to their Australian product suites. The introduction of new products, changes to LVR bands, numerous product splits with differing rates, repayment options according to loan type, and significant changes to investor and owner occupier pricing have been rolled out across our platform in the past 12 months. These ongoing changes have been delivered at an unprecedented pace and reaffirms the importance to a consumer of having an informed broker.
With more than 10,000 customers seeking the assistance of an AFG broker every month, the value consumers place on the mortgage broking channel continues to be clear. “The mortgage broking channel accounts for 53% of the Australian lending market and more than 20% of those mortgage brokers work with AFG,” said Mr Bailey.
2017 has also been marked by significant regulatory scrutiny of the Australian lending market. “AFG has been at the forefront of consultation with industry, government and regulators. The message we have had for all stakeholders has been clear – AFG has 45 lenders on its panel with more than 35% of borrowings going to lenders other than the four major banks, and we remain committed to ensuring choice and competition remains for Australian consumers.
“This competitive tension ensures consumers continue to have choice and most importantly benefit in terms of home loan price and service because of what brokers deliver on a daily basis across the Australian lending market,” he concluded.
Four leading non-bank lenders have criticised the extensive nature of powers proposed to the Australian Prudential Regulatory Authority (APRA) to be implemented over the non-ADI lending sector.
In a joint submission to the Treasury, Pepper Group, Liberty Financial, Firstmac and RESIMAC addressed these potential new APRA powers.
While the lenders appreciated the need for financial stability and sound lending practices, they pointed out that non-ADI lenders and ADIs are significantly different.
“While non-ADI lenders provide a range of essential functions and products to all Australians, they do not provide as broad a range of products, nor do they accept deposits, nor are they responsible for key pieces of banking infrastructure. Non-ADI lenders promote healthy competition within the finance sector, and service areas and customers that ADIs lenders cannot or are unable to service.”
The regulation of non-banks should thus be limited to “exceptional circumstances” if activity from a non-ADI lender is deemed to threaten the stability of the financial system.
The Treasury’s recent exposure draft on these proposed powers creates “unnecessary regulatory intervention” and “regulatory uncertainty” within the sector, they said.
“It casts an extremely wide net, both in terms of the proposed entities to be regulated and the level of regulatory oversight. We recommend that the legislation be modified to facilitate a more targeted regulatory approach to avoid causing unintended instability in the capital markets, the non-ADI lending sector and the Australian economy more generally.”
The submission, which was prepared by legal firm King & Wood Mallesons, proposes a number of specifics with regards to any future regulatory powers granted to APRA:
The definition of non-ADI lenders should be restricted only to those engaging in lending finance or in activities which directly result in the origination of loans
When assessing the impact of non-ADI lending practices on financial stability, the activities of non-ADI lenders related to ADIs should be excluded
Specific details of when APRA can create a ‘rule’ to further regulate a non-ADI lender should be contained either within the legislation or the guidance notes accompanying that rule
APRA will assess competitive issues within the relevant markets prior to exercising its rule-making power
This rule-making power will be limited to target macro-prudential concerns rather than regulating overall business aspects of the non-bank lender
APRA must consult with any affected non-ADI lender prior to creating a rule relating to that firm
A transitional period will be held before a rule comes into effect to ensure that the lender can meet its commitments to borrowers prior to any restrictions
Proposed rules that apply to the non-ADI lending sector will be no worse than any specific rule applying to the ADI sector
Directions to refrain from lending activities should only be made in the event of repeated and severe non-compliance by the lender
“Given the nature of a non-ADI lender and its industry, the rule making and enforcement power needs to be more specific, and different from the prudential standard and oversight approach taken with ADIs,” the joint submission said.
The statement continued, saying that vague regulation would negatively affect the confidence of the investors funding non-bank lenders, reducing the sustainability of the lender’s business model and thus restricting competition.
“In the absence of certainty as to when, how and why APRA may regulate, investors may question the non-ADI business model which may reduce the availability of capital markets funding and increase funding costs and limit the availability of warehouse funding, which in turn may have the unintended adverse effect on the level of loans and pricing in the retail lending market.”
RBA Assistant Governor (Financial Markets) Christopher Kent discussed data from their securitised mortgage data pool. Currently, the dataset covers about 280 ‘pools’ of securitised assets and has information on 1.6 million individual mortgages with a total value of around $400 billion. Currently, this accounts for about one-quarter of the total value of home loans outstanding in Australia.
It is worth noting that securitised loans may not accurately represent the entire market, as loan pools are selected carefully when they are rolled into a securitised structure – “the choice of assets in the collateral pool may be influenced by the way that credit ratings agencies assign ratings and by investor preferences”. That said, there is interesting data contained in the speech, below. Note the focus on household debt. But no data on loan to income (again!)
The Reserve Bank has always emphasised the value of using a wide range of data to better understand economic developments. One relatively new source of data for us is what we refer to as the Securitisation Dataset. Today, I’ll briefly describe this dataset and then I want to tell you a few of the interesting things we are learning from it.[1]
The Bank collects data on asset-backed securities. Currently, the dataset covers about 280 ‘pools’ of securitised assets. We require these data to ensure that the securities are of sufficient quality to be eligible as collateral in our domestic market operations. The vast bulk of the assets underlying these securities are residential mortgages (other assets, such as commercial property mortgages and car loans, constitute only about 2 per cent of the pools). Some of these are ‘marketed securities’ that have been sold to external investors. There are also securities that banks have ‘self-securitised’.[2]
Self-securitisations are primarily used by participating banks for the Committed Liquidity Facility (CLF) in order to meet their regulatory requirements.[3] The size of the CLF across the banking system is currently $217 billion. Self-securitisations are also used to cover payment settlements that occur outside business hours via ‘open repo’ transactions with the RBA.
The Bank has required the securitisation data to be made available to permitted data users (such as those who intend to use the data for investment, professional or academic research). This has helped to enhance the transparency of the market. Much of that has been achieved by requiring data that is comparable across different pools of securities.
Another benefit of the Securitisation Dataset is that it provides a useful source of information to help us better understand developments in the market for housing loans. The dataset covers information on 1.6 million individual mortgages with a total value of around $400 billion. Currently, this accounts for about one-quarter of the total value of home loans outstanding in Australia.
Nature of the data
Let me make a few brief remarks about the nature of the data.
For each housing loan, we collect (de-identified) data on around 100 fields including:
loan characteristics, such as balances, interest rates, loan type (e.g. principal-and-interest (P&I), interest-only), loan purpose (e.g. owner-occupier, investor) and arrears status;
borrower characteristics, such as income and the type of employment (e.g. pay as you go (PAYG), self-employed);
details on the collateral underpinning the mortgage, such as the type of property (e.g. house or apartment), its location (postcode) and its valuation.[4]
The dataset is updated each month with a lag of just one month. The frequency and timeliness of the data allow us to observe changes in interest rates, progress on repayments (i.e. the current loan balance) and the extent of any redraw or offset balances (just to name a few) without much delay.
I should note that, while the dataset covers a significant share of the market for housing loans, it may not be entirely representative across all its dimensions. In particular, the choice of assets in the collateral pool may be influenced by the way that credit ratings agencies assign ratings and by investor preferences. Also, in practice it may take quite a while until new loans enter a securitised pool. I’ll mention one important example of this later.
Now let’s look at some interesting things we have learnt from this dataset.
1. Interest Rates
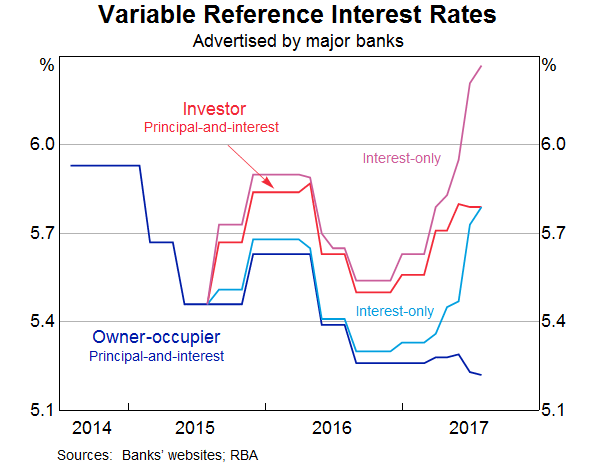
In the years prior to 2015, banks would generally advertise only one standard variable reference rate for housing loans.[5] There was no distinction, at least in advertised rates, between investors and owner-occupiers, or between principal-and-interest and interest-only loans. That changed when the banks responded to requirements by the Australian Prudential Regulation Authority (APRA) to tighten lending standards, with a particular focus on investor loans. Then, earlier this year, APRA and the Australian Securities and Investments Commission (ASIC) further tightened lending standards: this time the focus was on interest-only lending. A key concern has been that interest-only loans are potentially more risky than principal-and-interest loans. This is because with a principal-and-interest loan the borrower is required to regularly pay down the loan and build up equity. Also, interest-only borrowers can face a marked step-up in their required repayments once they come off the interest-only period (after the first few years of the loan term).
Among other things, the banks have responded to these regulatory actions by increasing interest rates on investor and interest-only loans. There are now four different advertised reference rates, one for each of the key types of loans (Graph 1). While the data in Graph 1 provide a useful guide to interest rate developments, they only cover advertised or reference rates for variable loans applicable to the major banks. Actual rates paid on outstanding loans differ from these for a few reasons. Borrowers are typically offered discounts on reference rates, which can vary according to the characteristics of the borrower and the loan. Discounts offered may vary across institutions, reflecting factors such as funding costs and market segmentation. (For example, non-bank lenders typically compete for different borrowers than the major banks.) The level of the discounts has also varied over time. Furthermore, there are fixed-rate loans, for which rates depend on the vintage of the loan.
Graph 1
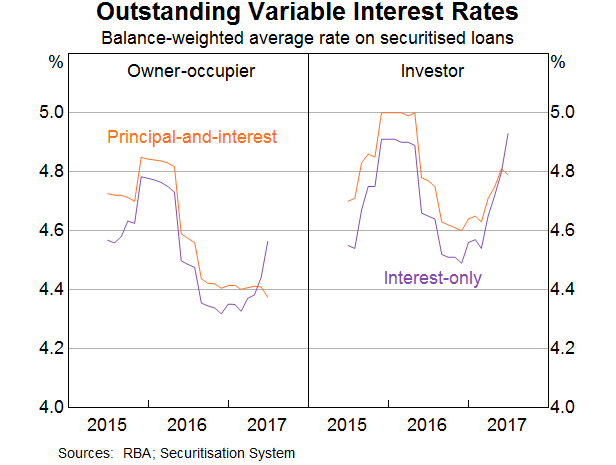
The Securitisation Dataset provides us with a timely and detailed source of information on the actual interest rates paid by households on their outstanding loans. Graph 2 shows rates paid on specific types of loans and by different types of borrowers.[6]
Graph 2
The first thing to note is that rates on owner-occupier loans and investor loans used to be similar, but investor loans became relatively more expensive from the latter part of 2015. Again, this followed regulatory measures to impose a ‘benchmark’ on the pace of growth of investor credit, which had picked up noticeably.
The second development I’d draw your attention to is the variation in housing loan interest rates over time. There were declines in 2016 following the reduction in the cash rate when the Reserve Bank eased monetary policy in May and then August. More recently, rates have increased for investor loans and interest-only loans, with a premium built into the latter as lenders have responded to the tightening in prudential guidance earlier this year. As part of that guidance, lenders will be required to limit the share of new mortgages that are interest-only to 30 per cent. Meanwhile, interest rates on principal-and-interest loans to owner-occupiers are little changed and remain at very low levels. Pulling this all together, the average interest rate paid on all outstanding loans has increased since late last year, but only by about 10 basis points.
A third and subtle point relates to the differences in the level of interest rates actually paid on different loan products (Graph 2) when compared with reference rates (Graph 1). The reference rates suggest that any given borrower would expect to pay a higher rate on an interest-only loan than on a principal-and-interest loan. That makes sense for two reasons. First, because the principal is paid down in the case of principal-and-interest loans, those loans are likely to be less risky for the banks; other things equal, you would expect them to attract a lower interest rate. Second, the banks have added a premium to interest-only loans of late to encourage customers to take on principal-and-interest loans and constrain the growth of interest-only lending.
But Graph 2 (based on securitised loans) suggests that, up until most recently, actual rates paid on interest-only loans have been lower than those on principal-and-interest loans. This doesn’t necessarily imply a mispricing of risk. Rather, it appears to reflect differences in the nature of loans and borrowers across the two types of loan products. In particular, borrowers with an interest-only loan tend to have larger loan balances (of around $85 000–100 000) and higher incomes (of about $30 000–40 000 per annum).[7]
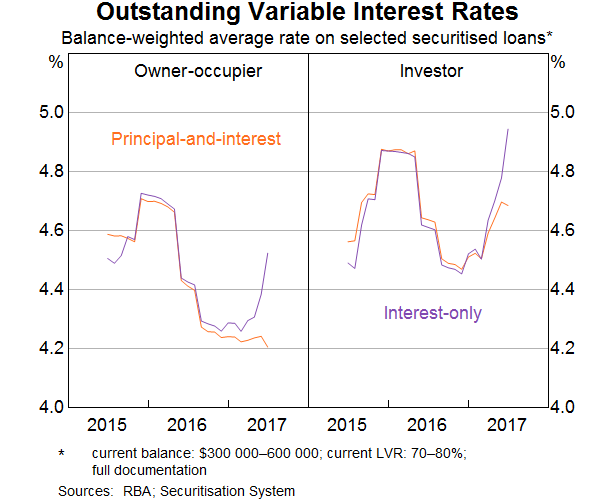
We can control for some of these differences between loan characteristics (such as loan size, loan-to-valuation ratio (LVR) and documentation type). When we do that, we find that rates have been much more similar across the two loan types in the past; although, a wedge has opened up more recently as we’d expect (Graph 3).
Graph 3
This highlights the value of examining loan-level data. We find that interest rates are lower for borrowers that are likely to pose less risk (as indicated, for example, by lower loan-to-value ratios and full documentation). Borrowers with larger loans – who typically have higher income levels – also tend to attract lower interest rates. In relation to loan size, this suggests that borrowers with larger loans may have somewhat greater bargaining power.
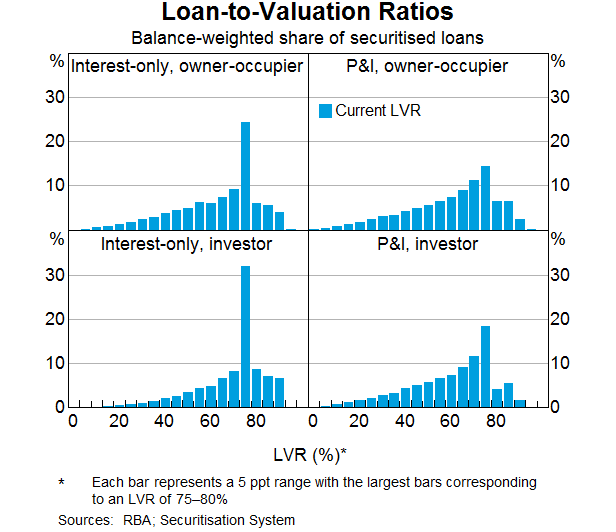
2. Loan-to-Valuation Ratios and Offset Balances
The Securitisation Dataset provides us with a measure of the LVR, based on the current loan balance.[8] We refer to this here as the ‘current LVR’. This is one indicator of the riskiness of a loan. Other things equal, higher LVRs tend to be associated with a greater risk of default (and greater loss for the lender in the case of default).[9]
Graph 4 shows current LVRs for owner-occupiers and investor loans, split into interest-only and principal-and-interest loans. I should emphasise again that the Securitisation Dataset may not be entirely representative of the set of all mortgages, particularly when it comes to LVRs. That is because high LVR loans may be less likely to be added to a pool of securitised assets in order to ensure that the securitisation achieves a sufficiently high credit rating.[10]
With that caveat in mind, we see that there is a large share of both owner-occupier and investor loans with current LVRs between 75 and 80 per cent. That is consistent with banks limiting the share of loans with LVRs (at origination) above 80 per cent. Also, borrowers have an incentive to avoid the cost of mortgage insurance, which is typically required for loans with LVRs (at origination) above 80 per cent.
Graph 4
Comparing investor loans with owner-occupier loans, we can see that investors have a larger share of outstanding loans with current LVRs of 75 per cent or higher.[11] That’s most obvious in the case of interest-only loans, but is also true for principal-and-interest loans. This reflects the investor’s financial incentive to maximise the amount of funds borrowed (without breaching the banks’ threshold above which they require lenders mortgage insurance). That can be more easily achieved with an interest-only loan. And, even in the case of principal-and-interest loans, investors don’t have the same incentives as owner-occupiers to get ahead of their scheduled repayments.
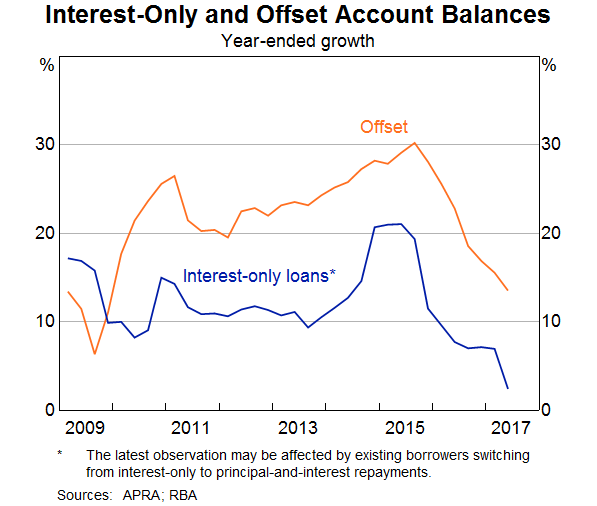
But what I’ve just shown doesn’t account for offset accounts. These have grown rapidly over recent years and are now an important feature of the Australian mortgage market (Graph 5). Funds held in these accounts are ‘offset’ against the loan balance, reducing the interest payable on the loan. In that way they are similar to a principal repayment. But, unlike the scheduled principal repayment, offset (and redraw) balances can be moved in and out freely by the borrower.
Graph 5
Part of the strong growth in offset balances up to 2015 appears to have been related to the rise in the share of interest-only loans, with the two being offered as a package. Interestingly, we saw a significant slowing in growth in offset balances around the same time as growth in interest-only housing loans started to decline.
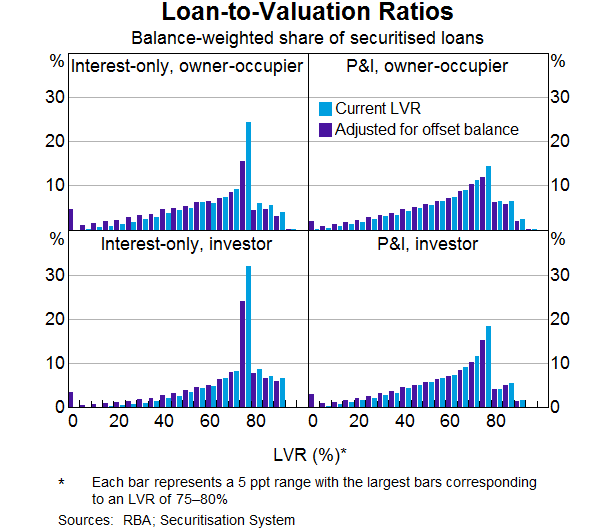
Graph 6 highlights how the distribution of current LVRs is altered if we deduct funds held in offset accounts from the balance owing. This suggests that for owner-occupier loans, interest-only borrowers are behaving somewhat like those with principal-and-interest loans. That is, many of those borrowers have built up significant balances in offset accounts. If needed in times of financial stress – such as a period of unemployment – borrowers could use those balances to service their mortgages.
Graph 6
However, I would caution against any suggestion that this similarity regarding the build-up of financial buffers means that the tightening of lending standards for interest-only loans was not warranted – far from it. What matters when it comes to financial stability is not what the average borrowers are doing, but what the more marginal borrowers are doing. There are two important points to make on this issue.
First, for investor loans, even after accounting for offset balances, there is still a noticeable share of loans with current LVRs of between 75 and 80 per cent. And for both investor and owner-occupier loans, adjusting for offset balances leads to only a small change in the share of loans with current LVRs greater than 80 per cent. This suggests that borrowers with high current LVRs have limited repayment buffers.
The second point is that more marginal borrowers are now more likely to take on a principal-and-interest loan than in the past. One reason is that there is a premium on the interest rates charged on an interest-only loan (for any given borrower, compared with an owner-occupier loan). Another reason is that banks, at APRA’s direction, have also tightened their lending standards for interest-only loans, most notably by reducing the share of new interest-only loans with high LVRs at origination.[12]
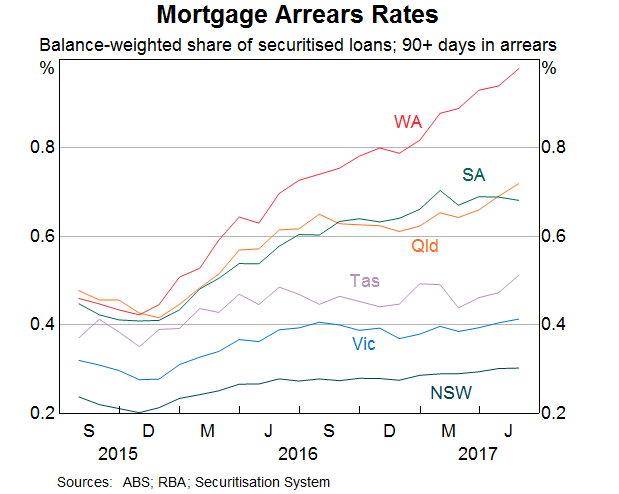
3. Arrears by region
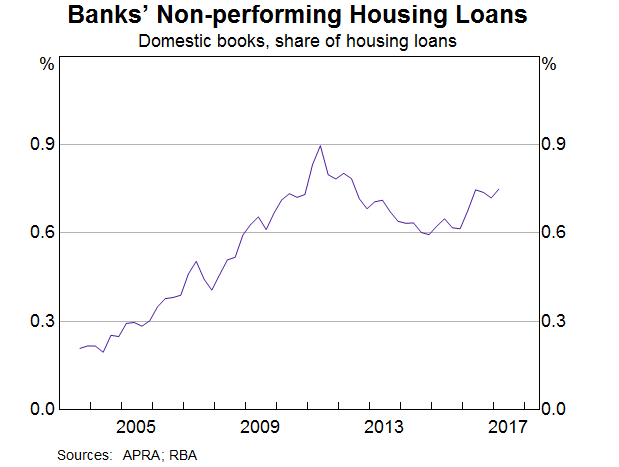
Banks’ non-performing housing loans have increased a little over recent years (Graph 7). However, at around ¾ of one per cent as a share of all housing loans, non-performing loans remain low and below the levels reached following the global financial crisis.
Graph 7
Using the Securitisation Dataset we can assess how loans are performing across different parts of the country by examining arrears rates. Like non-performing loans, the arrears rates have increased a little but remain low.[13] Arrears have risen more in regions experiencing weak economic conditions over recent years. In particular, there has been a more noticeable pick-up in arrears rates in Western Australia, South Australia and Queensland since late 2015 (Graph 8).
Graph 8
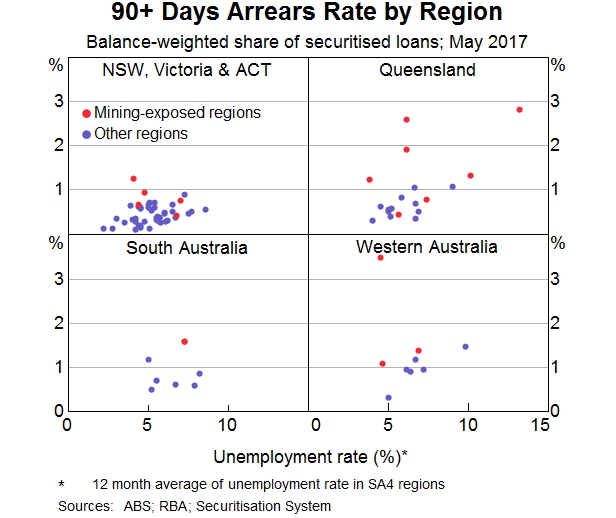
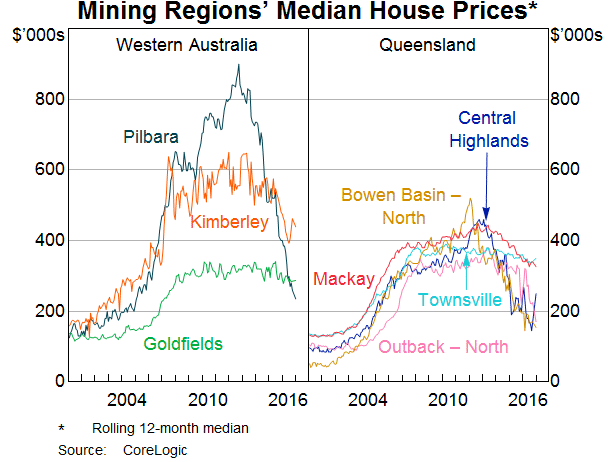
The Securitisation Dataset allows us to drill down even further to examine some relationships between arears and other factors. A key factor contributing to a borrower entering into arrears is a reduction in income, most obviously via a period of unemployment. We find that there is a positive relationship between arrears rates and the unemployment rate across regions (Graph 9).[14] However, the relationship is not especially strong, which suggests that other factors are at play. For example, arrears rates are higher in mining-exposed regions, which have generally experienced a sharp fall in demand following the end of the mining investment boom. One indicator of that has been the pronounced fall in the demand for housing in those parts of the country as indicated by a decline in housing prices (Graph 10).
Graph 9
Graph 10
Conclusion
The Securitisation Dataset plays a crucial role in allowing the Reserve Bank to accept asset-backed securities as collateral in our domestic market operations. The development of this database and its availability to investors has also helped to enhance the transparency of the securitisation market.
A useful additional benefit of this database is that it provides us with a range of timely insights into the market for housing loans. I’ve discussed how things like actual interest rates paid, loan balances and arrears vary over time and across different types of mortgages and borrowers. Although variable interest rates for investor loans and interest-only loans have risen noticeably over recent months, the average interest rate paid on all outstanding loans has increased by only about 10 basis points since late last year. Also, many borrowers on interest-only loans have built up sizeable offset balances. But even after taking those into account, it appears that current loan-to-valuation ratios still tend to be larger than in the case of principal-and-interest loans. Finally, while mortgage arrears rates have increased slightly over recent years, they have increased more noticeably in regions exposed to the downturn in commodity prices and mining investment.
Endnotes
I thank Michael Tran and Michelle Bergmann for invaluable assistance in preparing these remarks. [*]
I use the term banks here to refer to all authorised deposit-taking institutions (ADIs), namely banks, building societies and credit unions. [2]
The RBA provides a Committed Liquidity Facility (CLF) to participating ADIs required by APRA to maintain a liquidity coverage ratio (LCR) at or above 100 per cent. [3]
For more details, see reporting templates on the Securitisations Industry Forum website. The valuation is typically from the time of origination. [4]
An exception was a period during the 1990s, when banks advertised distinct rates for owner-occupier and investor loans. [5]
Modernised reporting forms that are collected by APRA on behalf of the RBA and the Australian Bureau of Statistics will significantly improve the aggregate and institution-level data that are currently collected from ADIs and registered financial corporations (RFCs). While the new data will have less granularity than the Securitisation Dataset, they will have much greater coverage. [6]
The figure for income is the average of all borrowers for each loan. That is, a given loan may be in the name of more than one borrower; on average, there are 1.7 borrowers per loan. [7]
The balance of a loan is reduced via scheduled repayments of the principal and by any repayments ahead of schedule. The latter may be accessible through a redraw facility. [8]
Some analysis we have conducted on the representativeness of the Securitisation Dataset suggests that it has fewer high LVR loans than the broader population of loans. There is also a tendency to include loans in securitisation pools only after they have aged somewhat (i.e. become more ‘seasoned’). [10]
The share of new investor loans with very high LVRs (above 90 per cent) at the time of origination has been declining for a few years and is below that for owner-occupier loans (Reserve Bank of Australia (2017), Financial Stability Review, April). This feature is not apparent in the data I’ve shown here, which is based on the current LVR for the stock of outstanding securitised loans, including those that are well advanced in age. [11]
APRA have instructed lenders to implement stricter underwriting standards for interest-only loans with LVRs greater than 80 per cent (see: <http://www.apra.gov.au/MediaReleases/Pages/17_11.aspx>). [12]
The 90+ days arrears rate refers to the share of loans that have been behind the required payment schedule or missed payments for 90 days or more but not yet foreclosed. [13]
These regions are defined in terms of the ABS’s Statistical Areas Level 4 (SA4s), which are geographic boundaries defined for the Labour Force Survey. The boundaries for most SA4s cover at least 100 000 persons. The Securitisation Dataset identifies loans according to the location of the mortgaged property.
A recent legal case has clarified when banks are liable for mortgage fraud in a decision that may see the victim worse off in certain scenarios.
The decision will also remove liability from the bank in certain fraudulent transactions even if the proper loan processing procedures were not followed.
The case, Spiliotopoulos v National Australia Bank Limited and Ors, saw the borrower allege that the individual who witnessed their signature on the mortgage did not in fact meet them and that their signature was forged, Louise Massey, partner at Dentons, told Australian Broker.
The ruling by the Supreme Court of NSW found an individual’s claim to be a registered proprietor at Land and Property Information (LPI) can be challenged in the event that a bank had knowledge of or participated in the fraud in the first place, Massey explained.
Spiliotopoulos, the borrower, said that the bank had been aware of the alleged fraud; a claim which the court dismissed due to lack of evidence.
“When the bank looked at the mortgage, it seemed to have followed all the proper procedures. There was nothing in the document that would have put the bank on notice. The bank wasn’t a participant in the fraud, so it couldn’t be attributable to the bank in any way,” Massey said.
The decision means that even if a bank did not completely follow proper procedures stated by its internal policies, it still would not be responsible for fraud in this particular type of case as they had no notice of fraud and therefore could not be liable, she added.
“The failure from banks to follow their own policies and procedures might trigger some other legal actions against the bank, but that wasn’t the case here.”
From the lender’s point of view, this was a very good decision as it provided protection against fraud allegations, Massey said.
However if the banks weren’t going to be held liable in these cases, this may mean that fraudsters had more scope to get away with it, she added.
“In a lot of cases like this, the fraudster is liable. The difficulty you have is sometimes fraudsters are people who operate in very sophisticated setups. It’s often very difficult to attempt to actually find them and charge them. Often they go missing in action.”
“When something like this occurs and the bank’s not responsible, who gets caught with the liability? Where does the liability or the loss fall? It doesn’t fall with the bank. If you can’t find and charge the fraudster then the loss is ultimately borne by the innocent party. Sometimes, that’s just the way it plays out.”
Massey also pointed to the move towards digital mortgages as an area to watch.
“The Spiliotopoulos case was before anything was electronic and so the mortgage was all done in hard copy. Now there are a lot of conveyancing transactions which are going ahead online. The electronic landscape might give more scope for fraudulent conduct to actually occur.”
With the 1 August deadline looming for paperless refinancing, one major lender has explained how technology is reshaping the way it delivers home loans.
Mortgage providers from across Australia are in the process of digitising their back-office operations. The migration to e-conveyancing has been a significant event in the evolution of the Australian mortgage market. More than 120 lenders have now signed up to exchange property online through PEXA’s network, where almost $58 billion worth of property has transacted to date.
From 1 August in NSW and Victoria, commercial standalone mortgages will need to be lodged electronically by ADIs, while in NSW and Victoria, refinance transactions will have to be lodged electronically where both mortgagees are ADIs.
According to Marielle Yeoh, PEXA’s chief financial services officer, the best way for brokers to prepare for the change is to ask lenders if the transaction will be settling on PEXA and to share with customers and borrowers that there is now a new way of settling electronically.
NAB is at the forefront of these changes and sees the property industry moving towards 100 per cent digital settlements. The group’s general manager of customer lending operations, Gary Howard, said that digital settlements have a number of benefits for NAB and its customers.
“It gives us greater flexibility to deliver outcomes quickly for our customers,” Mr Howard said. “It also results in less duplication and cost. Leveraging technology will give our people the opportunity to focus on more personalised service, and for our customers it means increased security and real-time access to funds.”
Improving turnaround times and delivering a better customer experience in home lending are key competitive advantages in a market where rate matching is common.
NAB believes that digital allows for a wide range of opportunities. “Certainly, there are a number of layers and legacy systems and processes within the mortgages process, and many of these processes are geared towards paper,” Mr Howard said.
“To digitise the entire mortgage process, end to end, we need to think differently and look for opportunities to innovate . . . and we are,” the chief said. “PEXA is a great example of what is possible and how we can progress towards delivering a better customer experience by going digital.”
Traditionally, some mortgage brokers have considered elements of digital processes a threat. This appears to be changing, with more and more brokers integrating digital solutions into their own businesses to drive efficiencies and improve productivity.
While NAB remains focused on delivering digital solutions in the mortgage space, Mr Howard recognises that not all areas need an electronic touch.
“We’re focused on delivering digital solutions that are driven by customer needs,” he said, “but that doesn’t mean everything is going to be digitised, particularly where relationships and human advice counts.”
NAB recently strengthened its partnership with REA Group by announcing the sale of Choice Home Loans to the ASX-listed real estate listings giant. A fresh line of white-label mortgages has been tipped to hit the market as part of the NAB/REA deal.
But brokers are firmly on the group’s radar. Speaking at NAB’s Knowledge is Everything road show in Sydney back in April, EGM of broker partnerships Anthony Waldron said that he expects broker market share to exceed 70 per cent over the coming years.
Mr Waldron explained how consultation on the ASIC remuneration review, for example, could further boost third-party share by improving trust.
“It’s the opportunity for more people to understand what brokers do; it’s the opportunity to build trust even further in what you do. And if we can do that then we won’t be talking about 53 or 54 per cent of mortgages going through the broker community. We will be talking about more like the numbers in the UK where it is already in the 72 or 73 per cent.”
Nevertheless, big banks acknowledge that the digital age is here, and NAB’s Mr Howard is confident that the property industry is moving towards “100 per cent” digital settlements.
Mr Howard said: “Within a few years, we expect the majority of transactions will be performed electronically.”
Updated 09 August. Note the statement from WA’s Landgate.
Taking into consideration industry feedback, the Registrar of Titles has revised the information published in CIB289.
The Registrar will now require the move to electronic lodgement of land transfer documents via an Electronic Lodgement Network Operator (ELNO) by regulation.
The regulations are expected to be in place during Q4 2017.
From 1 December 2017, all eligible mortgages, discharges of mortgages and refinances must be lodged electronically.
From 1 May 2018 all eligible, stand-alone transfers, caveats and withdrawal of caveats and any lodgement case consisting of eligible discharges, transfers, mortgages, caveats and withdrawal of caveats must be lodged electronically.
The Registrar of Titles and the Minister for Lands are in agreement that this approach is fair and clear, and provides the necessary legal clarity for government and industry.
With current market conditions, and the extra time allowed to prepare for the changes, the Minister and Registrar encourage all settlement agents to inform themselves on e-conveyancing, register and begin transacting electronically as soon as possible.
Landgate has provided considerable information to industry on the nature of the changes, and has sponsored the Australian Institute of Conveyancers, Western Australian branch to provide its electronic conveyancing accreditation program. There has also been a series of roadshows presented by Property Exchange Australia (PEXA) to take interested settlement agents through the electronic lodgement process and answer any questions. Landgate will continue to support industry through this transition.
Leading non-major lender Liberty Financial announced today the acquisition of wholesale aggregator National Mortgage Brokers (nMB) from Aussie Home Loans, effective 2 August 2017.
“We have tremendous admiration for nMB which, under Aussie’s ownership, has grown to a team of over 400 brokers and a loan book of almost $14bn,” James Boyle, chief executive of Liberty, said.
“Liberty has successfully developed a thriving retail distribution channel, Liberty Network Services, over the past five years. The acquisition of nMB expands our distribution capabilities and creates unique growth opportunities for both organisations.
“There is a strong alignment of vision and values, with both nMB and LNS focusing on their distinctive value propositions which share a commitment to providing the highest quality of professional mortgage broker services to consumers,” Boyle said.
According to nMB managing director Gerald Foley, “nMB has constantly evolved since our inception in 2001 and I am excited about the depth of resources that Liberty can bring to our fast growing business. I look forward to continuing my leadership of nMB and I would also like to thank Aussie for its support since it acquired the business in 2012.”
Chief executive officer of Aussie, Mr James Symond, said “nMB is one of Australia’s longest established mortgage aggregators and a genuine leader in the wholesale aggregator market. While nMB has been a very positive contributor to the success of the Aussie Group, the future of Aussie’s long-term strategy is to concentrate solely on our own branded distribution footprint.
“Liberty is a long term partner of both Aussie and nMB and I am confident that it is the right business and leadership team to facilitate nMB’s next phase of growth.
“Aussie will retain its strategic partnership with nMB for many years to come and we wish them well as an important part of the very successful Liberty group,” Symond said.
Further evidence of a shift in mortgage applications from majors to other smaller lenders is provided by the fact that ING Direct has acknowledged lengthier processing times for incoming home loan applications and has promised to work through the issue.
According to Australian Broker, “As has been the case in the past, it is important we are transparent and keep you informed on how we are addressing these challenges,” Mark Woolnough, head of third party distribution & direct mortgages, wrote in a note to brokers on Thursday (13 July).
“We have all available resources working towards getting our turnaround times back to much shorter levels.”
The primary cause for the delays has been elevated application flows, Woolnaugh told Australian Broker.
“A combination of other factors have also exacerbated the extended delays, namely the introduction of requirements regarding Common Reporting Standards and re-work on incomplete applications; in many cases multiple re-works on the same files.
“It is vital that our competitive positioning remain strong; this won’t be compromised by our processing challenges.”
The bank has created separate assessment queues for purchase and refinancing, he said, which would assess purchase applications in a faster manner and address extended queues for refinancing.
Credit assessment staff have also been brought in both over the weekends and on weeknights, while a recruitment effort for additional assessment and processing staff is underway.
At the time the broker note was sent out, ING was assessing purchasing applications received on 6 July and refinance applications received on 23 June.
“We are doing everything we can to get back to acceptable turnaround times. We thank you for your continued support and patience.”
ING was making real progress in solving these issues, Woolnaugh said, with purchase applications now at a four day turnaround time. He promised that this figure will continue to be brought down whilst ING also worked on refinances in parallel.
“We expect to be back within turnaround times of below four days within the next few weeks. We will also do everything we can do ensure we hold and further improve these and avoid any return to the turnaround times we’ve experienced over the past few weeks.”
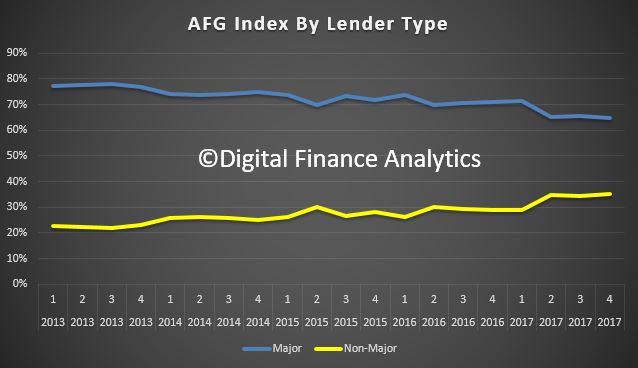
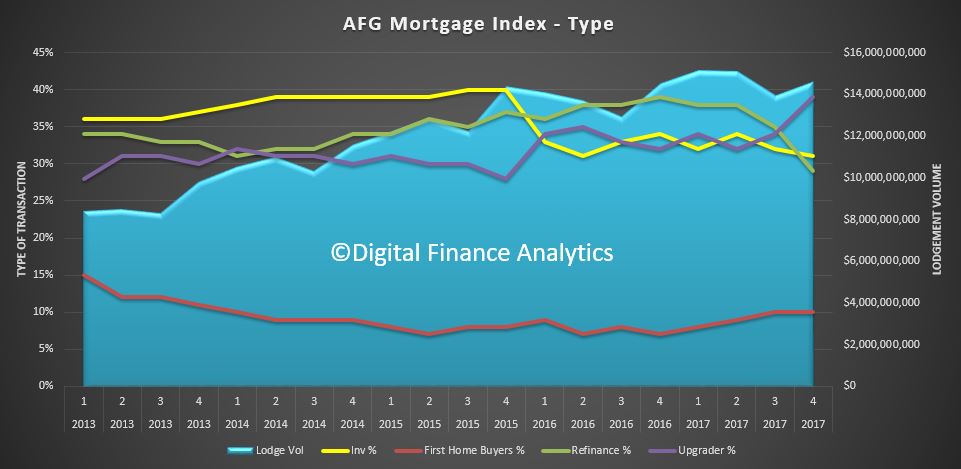
Australian Finance Group (AFG) has today released their Mortgage Index June Quarter 2017. Whilst myopic, as it is based of traffic within their business, it does provide a window on the market, and highlights some of the shifts in play.
AFG CEO David Bailey welcomed the news that the non-major share of the market is now at 35%.
“Significant structural change to the lending market brought about by tighter lending rules has seen increased flows of business to the non-major lenders.”
“As the majors re-price their mortgages and change lending policies to meet regulatory caps, consumers are turning to mortgage brokers to get a full picture of the choices on offer in such a competitive market,” he said.
“The non-major lenders are helping fill the void left by some of the majors and consumers are benefiting from the fact that a mortgage broker can offer products from those lenders without a branch network.”
A series of rate rises and policy changes has also had an impact on the investment market. “In what will no doubt be welcome news for the regulator, investment lending has dropped to 31% of our total lending for the quarter as lenders continue to tighten their criteria,” said Mr Bailey.
Refinancing figures are also down from 35% to 29% as refinance options for borrowers with interest only or higher LVR investment loans decrease and others choose to stay put until the market settles. Lender policy restrictions have also seen the average loan size fall in every state apart from Queensland.
“The part of the market that has been virtually untouched by regulators and lenders is the principle and interest owner category. As a result, those opting to upgrade their homes have increased from 34% to 39% in response to some attractive lending offers,” he concluded.
In a sign that homeowners are picking the bottom of the market for interest rates, the number choosing to fix their rate has jumped significantly to finish the quarter at 23.7%.