Low US Inflation Signals Interest Rates Will Remain Lower For Longer

The latest data from the US which shows low inflation and wage growth has pulled the implied forward interest rates down suggesting the Fed will hold rates lower for longer.  This is reflected in falling yields on the T10.

Nearly half of the “Trump Effect” repricing has been undone.

This is also flowing into lower rates in the international capital markets, which is translating to lower costs of funds for the Australian banks (one reason why Westpac has cut their fixed rates).

As a result, in our default model, we have reduced the likelihood of an interest rate rise for mortgage holders in Australia over the next few months. This will translate to a projected fall in defaults, despite rising mortgage stress. We will publish the August data on Monday.  Households are likely to be able to muddle through and the RBA will hope business investment, which was stronger this time, works through.

Meantime, here is interesting commentary from Moody’s on the US, who highlight that the latest drop by personal savings in the US brings attention to the financial stress now facing many households there.

The recent slowdown by the underlying rate of consumer price inflation significantly lowered the risk of a disruptive climb by interest rates. In response, the VIX index sank from the 16.0 points of August 10, 2017 to a recent 10.7 points, while a composite high-yield bond spread narrowed from August 11’s 410 bp to August 30’s 399 bp.

However, the narrowing by the high-yield bond spread has been limited by a climb by the average high yield EDF (expected default frequency) metric from the July 2017 average of 3.9% to the 4.4% average of the five-days-ended August 30. Moreover, the US high-yield credit rating revisions of the third-quarter todate show downgrades topping upgrades even after excluding rating changes that were not primarily driven by fundamentals.

As recently as early July 2017, the Blue Chip consensus had anticipated a 2.5% average for Q3-2017’s 10-year Treasury yield. Much to the contrary, the 10-year Treasury yield has averaged 2.26% thus far in the third quarter, including a recent 2.13%. Not even a widely anticipated September 2017 start to the Fed’s reduced reinvestment of maturing bonds has been capable of lifting Treasury bond yields demonstrably.

In addition to July’s 1.4% annual rate of core PCE price index inflation, benchmark bond yields have been reined in by the market’s much reduced expectation of another Fed rate hike for 2017. As of mid-day on August 31, the futures market implicitly assigned only a 36.4% likelihood to fed funds’ midpoint finishing 2017 at something greater than its current 1.125% according to the CME Group’s FedWatch tool.

By itself, core PCE price index inflation’s performance of the last 20 years suggests that the FOMC may have considerable difficulty as far as sustaining PCE price index inflation at 2% or higher. For the 20-years-ended June 2017, core PCE price index inflation averaged only 1.7% annually. The annual rate of core PCE price index inflation was at least 2% in only 58, or 24.2%, of the last 240 months (20 years).

For those months showing an annual rate of core PCE price index inflation of at least 2%, the average annual rate of core inflation was only 2.2%, wherein the fastest annual rate of core inflation was the 2.5% of August 2006.

Drop by personal savings curbs core inflation

The slower growth of wage and salary income has helped to contain price inflation. After decelerating from 2014’s 5.6% and 2015’s 5.5% to 2016’s 3.0%, the annual increase of private-sector wages and salaries approximated a still sluggish 3.1% during January-July 2017. In response to the pronounced slowdown by wages and salaries, personal savings have shrunk by -29% annually thus far in 2017 following yearlong 2016’s -18% plunge.

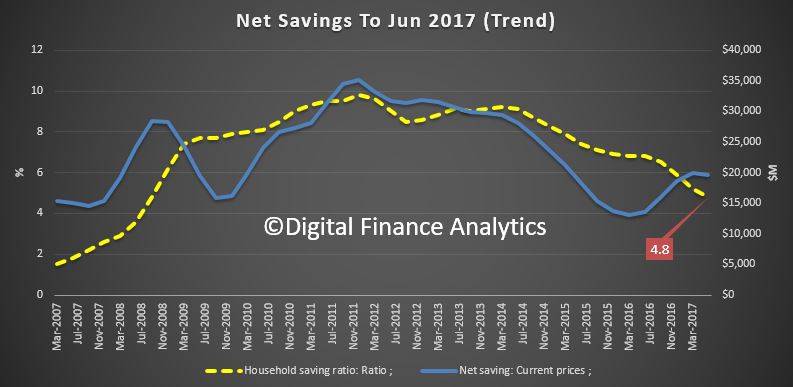
The drop by the ratio of personal savings to disposable personal income from its 6.1% average of the five years ended 2015 to the 3.8% of 2017 to date implies Americans lack the financial wherewithal to either support or absorb significantly higher prices for long.

High rates of personal savings make it easier for consumers to absorb higher prices. When core PCE price index inflation averaged 6.4% during 1970-1981, the personal savings rate averaged 11.7%. By contrast, the averages for January-July 2017 showed a much lower 3.8% personal savings rate and a much slower 1.6% annual rate of core PCE price index inflation.

In addition, the latest drop by personal savings brings attention to the financial stress now facing many US households. Today’s more unequal distribution of income implies that a relatively greater number of today’s households save little, if any, of their after-tax income. When confronted with higher prices, these “paycheck-to-paycheck” consumers will be compelled to eventually curtail real spending at the expense of business pricing power.

ABC Four Corners Does Mortgage Stress

In 2017 ABC Four Corners looked at the Australian housing market, and discussed the pressure on households, even at current low interest rates thanks to rising costs of living, flat wages and the risk of rising mortgage rates.

They used data from Digital Finance Analytics household surveys to create an interactive map looking at mortgage stress across the country.

You can read more about how we calculate stress in our definitive guide, or watch our video discussing the latest analysis.

The underlying mortgage data is available in our core market model.

A quick reminder, the core market model ingests data from our surveys, focus groups and other private data, as well as information from various public sources.

The core model, working off a rolling sample of 52,000 household records enables us to analyse many aspects of the market. We have clients who take a range of outputs from the model.

In this video we walk through some of the key dimensions in the model, including segmentation, mortgage profiles and locations.

Note the data is for demonstration purposes only.


Mortgage Stress Gets Worse in July

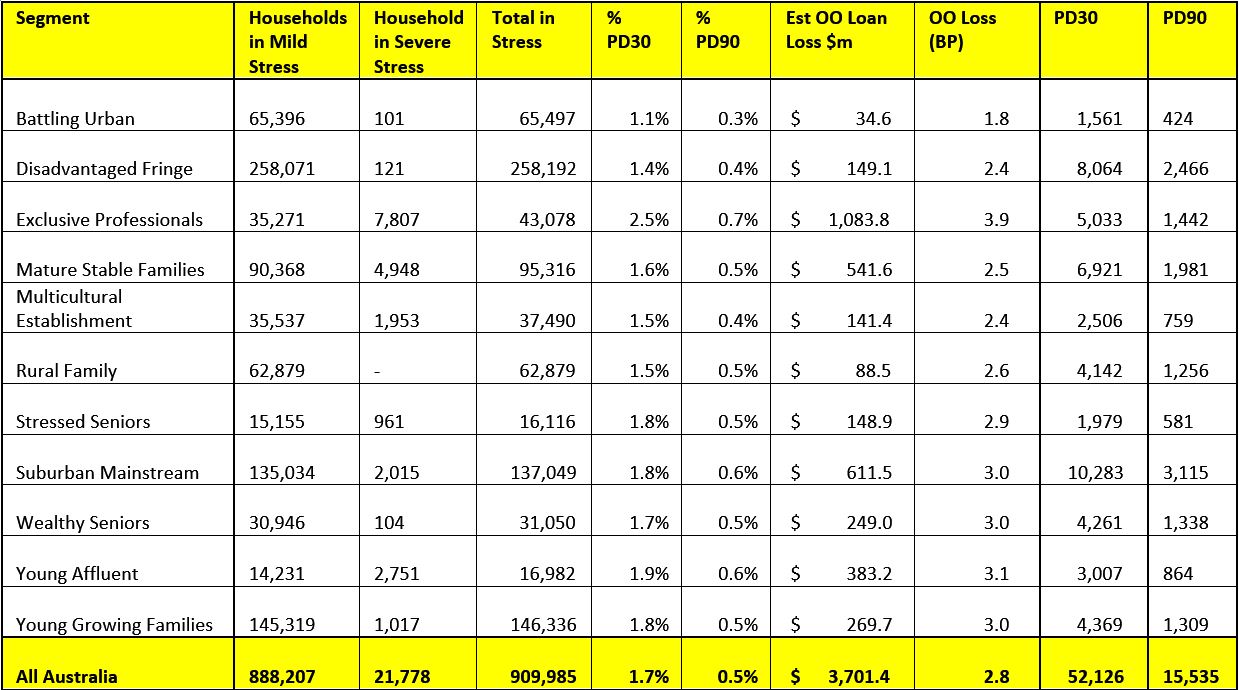
Digital Finance Analytics has released mortgage stress and default modelling for Australian mortgage borrowers, to end July 2017.  Across the nation, more than 820,000 households are estimated to be now in mortgage stress (last month 810,000) with 20,000 of these in severe stress. This equates to 25.8% of households, up from 25.4% last month. We also estimate that nearly 53,000 households risk default in the next 12 months, 2,000 down from last month.

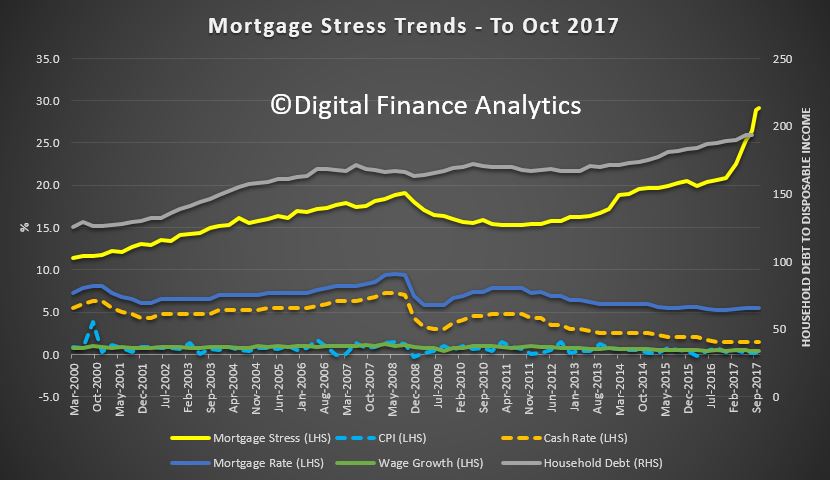
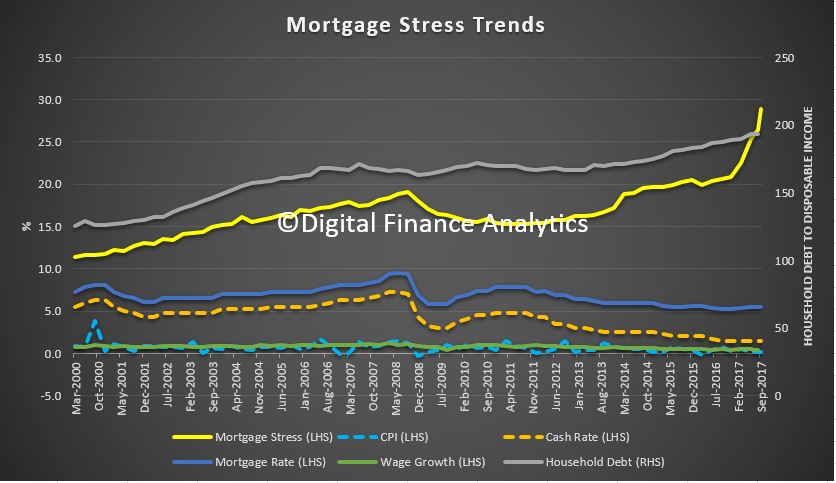
We have been tracking the number of households in stress each month since 2000, and since a small easing in February 2016, the number under pressure have been rising each month.  The RBA cash rate cuts have provided some relief, especially directly after the GFC, but now mortgage rates appear to be more disconnected from the cash rate as banks seek to rebuild their margins.

The main drivers of stress are rising mortgage rates and living costs whilst real incomes continue to fall and underemployment is on the rise.  This is a deadly combination and is touching households across the country, not just in the mortgage belts. On the other hand, employment remains strong in NSW in particular, so income rose a little and small reductions in some owner occupied mortgage rates helped too.

This analysis uses our core market model which combines information from our 52,000 household surveys, public data from the RBA, ABS and APRA; and private data from lenders and aggregators. The data is current to end July 2017.

We analyse household cash flow based on real incomes, outgoings and mortgage repayments. Households are “stressed” when income does not cover ongoing costs, rather than identifying a set proportion of income, (such as 30%) going on the mortgage.

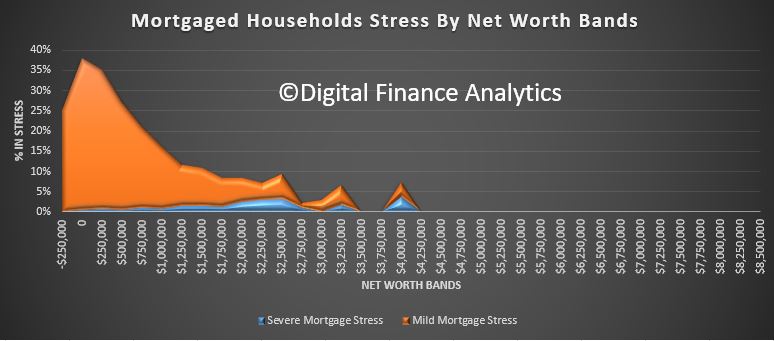
Those households in mild stress have little leeway in their cash flows, whereas those in severe stress are unable to meet repayments from current income. In both cases, households manage this deficit by cutting back on spending, putting more on credit cards and seeking to refinance, restructure or sell their home.  Those in severe stress are more likely to be seeking hardship assistance and are often forced to sell.

Martin North, Principal of Digital Finance Analytics said “flat incomes and underemployment mean rising costs are not being managed by many, and when added to rising mortgage rates, household budgets are really under pressure. Those with larger mortgages are more impacted by rate rises”.

“The latest housing debt to income ratio is at a record 190.4[1] so households will remain under pressure. Stressed households are less likely to spend at the shops, which acts as a drag anchor on future growth. The number of households impacted are economically significant, especially as household debt continues to climb to new record levels.”

“We continue to see the spread of mortgage stress in areas away from the traditional mortgage belts. A rising number of more affluent households are also being impacted.”

Regional analysis shows that NSW has 225,090 households in stress, VIC 229,988 (217,655 last month), QLD 144,825 (141,111 last month) and WA 107,936 (106,984 last month). The probability of default fell a little, with around 10,000 in WA, around 10,000 in QLD, 13,000 in VIC and 14,000 in NSW. There were falls of about 1,000 from last month in NSW and VIC, thanks to improved employment prospects. Probability of default extends our mortgage stress analysis by overlaying economic indicators such as employment, future wage growth and cpi changes.

Here are the top 30 post codes sorted by risk of default estimated over the next 12 months.

[1] *RBA E2 Household Finances – Selected Ratios March 2016

Inequality Rules – The Property Imperative Weekly 8th July 2017

The Reserve Bank held the cash rate, more banks hiked mortgage interest rates, household debt rose again and our latest research showed that more than 800,000 households across Australia are experiencing mortgage stress. Welcome to the latest edition of the Property Imperative Weekly.

HSBC said the housing bubble fears were overblown. At a national level, a key reason for rising housing prices has been housing under-supply, Chief Economist Paul Bloxham wrote in a research note on Thursday and suggested that a significant fall in Australian housing prices, as occurred in the U.S. and Spain during the global financial crisis, is unlikely.

But data from CoreLogic showed whilst  home prices rose in the last quarter, whilst auction volumes fell, and housing affordability deteriorated. The national price to income ratio was recorded at 7.3 compared to 7.2 a year earlier, and 6.1 a decade ago. It would have taken 1.5 years of gross annual household income for a deposit nationally at the end of the March compared to 1.4 years a year earlier and 1.2 years a decade ago. The discounted variable mortgage rate for owner occupiers was 4.55% and an average mortgage required 38.9% of a household’s income.

New data from the RBA showed that the household debt to income rose to a high of 190.4. Households are more in debt than they have ever been, and the main question has to be, can it all be repaid down the track, before mortgage interest rates rise so high that more get into difficulty.

Our June mortgage stress results  showed that across the nation, more than 810,000 households are estimated to be now in mortgage stress up from 794,000 last month, with 29,000 of these in severe stress. This equates to 25.4% of households, up from 24.8% last month. We also estimate that nearly 55,000 households risk default in the next 12 months. The main drivers are rising mortgage rates and living costs whilst real incomes continue to fall and underemployment is on the rise.  This is a deadly combination and is touching households across the country, not just in the mortgage belts.

We analyse household cash flow based on real incomes, outgoings and mortgage repayments. Households are “stressed” when income does not cover ongoing costs, rather than identifying a set proportion of income, (such as 30%) going on the mortgage. Stressed households are less likely to spend at the shops, which acts as a drag anchor on future growth. The number of households impacted are economically significant, especially as household debt continues to climb to new record levels.

Census data shows that Home ownership has continued to fall among younger Australians. Only 36 per cent of people aged 25-29 said they owned their home outright or with a mortgage – likely the lowest level since at least the 1960s. Home ownership for the next age group, 30-34, also declined, to 49 per cent, which is likely another record low.

Overall inequality in Australia is rising, between those who have property and those who do not. Australia has prominent examples of economic policies that disproportionately benefit the upper-middle class, such as the capital gains tax discount and superannuation tax incentives. We also have a geographically concentrated income distribution, with the rich living in neighbourhoods with other rich people. The poor are also more likely to live in close proximity to people who share their disadvantage.

There were major changes to mortgage rates and underwriting standards this week, with many following the herd by lifting rates for interest only borrowers, especially investors whilst making small downward movements in principal and interest loan rates, especially at lower LVRs.

NAB will start automatically rejecting customers who want to borrow a high multiple of their income and only pay interest on their home loan, amid concerns over the growing risks created by rising household indebtedness.     While NAB already calculates loan-to-income ratios when assessing loans, it has not previously used the metric to determine whether a customer gets a loan, and such a blanket approach is unusual in the industry.

We have maintained for some time that LTI is an important measure. It should be use more widely in Australia, as it is a better indicator of risk than LVR (especially in a rising market).

Several more banks tweaked their mortgage rates this week. Virgin Money for example increased its variable and fixed rates for new owner occupied loans for LVRs of over 90% by 35 basis points or 0.35%, and increased its standard variable rates for owner occupied and investment interest online loans by 25 basis points.

Auswide Bank announced an increase to their reference rates for investment home loans and lines of credit of 25 basis points from 11 July 2017 will result in a new standard variable rate (SVR) of 6.10%. They blamed funding pressures and regulatory limits on investment and interest only lending.

ING Direct  changed their reference rates, for owner-occupier borrowers, the principal and interest rates will decrease by 5 basis points. But for owner-occupier borrowers, interest-only rates will increase by 20 basis points and investor borrowers on interest-only loans will cop a 35 basis point rise. They are also encouraging borrowers to switch to principal and interest repayment loans.

Bendigo Bank lifted variable interest rates by 30 basis points for existing owner occupied interest only customers and 40 basis points for existing investment interest only customers. They also lifted business loans with new business interest only variable rates up by 40 to 80 basis points and fixed interest only rates increasing by 10 to 40 basis points.  On the other hand, new Business Investment P&I variable rates will decrease by 15 basis points and fixed P&I interest rates decreased by 30 basis points.

The RBA held the official cash rate at 1.5 per cent for the tenth time on Tuesday. It hasn’t moved since a 25 basis point cut in August 2016. But Analysis shows that the gap between the RBA rate and the standard rate banks quote to mortgage borrowers is around the widest in 20 years. The Banks did not pass on the full benefit of the RBA’s record-low rates in order to offset costs and prop up profits. Last year there was a massive race to the bottom in terms of discounts to try to gain volume and share. Many banks dented their margins in the process. But now they’ve now got the perfect cover, thanks to APRA’s regulatory intervention, and so we expect to see mortgage rates continuing to grind higher, particularly for investors and anyone on interest-only. This will simply lead to more mortgage stress down the track whilst the banks rebuild their profit margins. Another example of inequality.

And that’s the Property Imperative to the 8th July. Check back again next week

Mortgage Stress Grinds Higher In June

Digital Finance Analytics has released mortgage stress and default modelling for Australian mortgage borrowers, to end June 2017.  Across the nation, more than 810,000 households are estimated to be now in mortgage stress (last month 794,000) with 29,000 of these in severe stress. This equates to 25.4% of households, up from 24.8% last month. We also estimate that nearly 55,000 households risk default in the next 12 months.

The main drivers are rising mortgage rates and living costs whilst real incomes continue to fall and underemployment is on the rise.  This is a deadly combination and is touching households across the country, not just in the mortgage belts.

This analysis uses our core market model which combines information from our 52,000 household surveys, public data from the RBA, ABS and APRA; and private data from lenders and aggregators. The data is current to end June 2017.

We analyse household cash flow based on real incomes, outgoings and mortgage repayments. Households are “stressed” when income does not cover ongoing costs, rather than identifying a set proportion of income, (such as 30%) going on the mortgage.

Those households in mild stress have little leeway in their cash flows, whereas those in severe stress are unable to meet repayments from current income. In both cases, households manage this deficit by cutting back on spending, putting more on credit cards and seeking to refinance, restructure or sell their home.  Those in severe stress are more likely to be seeking hardship assistance and are often forced to sell.

Martin North, Principal of Digital Finance Analytics said “flat incomes and underemployment mean rising costs are not being managed by many, and when added to rising mortgage rates, household budgets are really under pressure. Those with larger mortgages are more impacted by rate rises”.

“The latest housing debt to income ratio is at a record 190.4[1] so households will remain under pressure. Stressed households are less likely to spend at the shops, which acts as a drag anchor on future growth. The number of households impacted are economically significant, especially as household debt continues to climb to new record levels.”

[1] *RBA E2 Household Finances – Selected Ratios March 2016

Lower interest rates reducing mortgage stress – Roy Morgan

New results from Roy Morgan’s mortgage stress data show that in the three months to April 2017, 16.8% or 666,000 mortgage holders can be considered to be ‘at risk’ or facing some degree of stress over their repayments. This compares favourably with 18.4% or 744,000
mortgage holders 12 months ago.

These are the latest findings from Roy Morgan’s Single Source survey of 50,000+ people pa, which includes more than 10,000 owner occupied mortgage holders.

Mortgage stress is much higher among the lower income groups (Under $60kpa) where it currently reaches 85.3% for those considered ‘at risk’ and 65% for ‘extremely at risk’.

Mortgage stress is based on the ability of home borrowers to meet the repayment guidelines currently provided by the major banks. The level of mortgage holders being currently considered ‘at risk’ is based on their ability to meet repayments on the original amount borrowed. This is currently 16.8%, which is well below the average over the last decade.

DFA comments – interesting findings, presumably looking at owner occupied mortgages? The basis of assessment is different. Also, current repayment guidelines are in our opinion too generous, given current income growth. We think underwriting standards need to be tighter, judging by overall household cash flow, which have been tracking in our mortgage stress analysis.

Finally, whether 666,000 households from Roy Morgan, or 794,000 from DFA, are both big numbers!


What’s The Correlation Between Mortgage Stress And Loan Non Performance?

Last night DFA was involved in a flurry of tweets about the relationship between our rolling mortgage stress data and mortgage non-performance over time. The core questions revolved around our method of assessing mortgage stress, and the strength, or otherwise of the correlation.

We were also asked about our expectations as to when non-performing mortgage loans will more above 1% of portfolio, given the uptick in stress we are seeing at the moment.

Our May 2017 data showed that across the nation, more than 794,000 households are now in mortgage stress (last month 767,000) with 30,000 of these in severe stress. This equates to 24.8% of households, up from 23.4% last month. We also estimate that nearly 55,000 households risk default in the next 12 months.

However, it got too late last night to try and explain our analysis in 140 characters. So here is more detail on our approach to mortgage stress, and importantly a chart which slows the relationship between stress data and mortgage non-performance.

Our analysis uses our core market model which combines information from our 52,000 household surveys, public data from the RBA, ABS and APRA; and private data from lenders and aggregators. The data is current to end May 2017.

We analyse household cash flow based on real incomes, outgoings and mortgage repayments. Households are “stressed” when income does not cover ongoing costs, rather than identifying a set proportion of income, (such as 30%) going on the mortgage.

Those households in mild stress have little leeway in their cash flows, whereas those in severe stress are unable to meet repayments from current income. In both cases, households manage this deficit by cutting back on spending, putting more on credit cards and seeking to refinance, restructure or sell their home. Those in severe stress are more likely to be seeking hardship assistance and are often forced to sell.

We also make an estimate of predicated 30 day defaults in the year ahead (PD30) based on our stress data, and an economic overlay including expected mortgage rates, inflation, income growth and underemployment, at a post code level.

Here is the mapping between stress and non-performance of loans.

The red line is the data from the regulators on non-performing mortgage loans. In 2016 it sat around 0.7%. There was a peak following the 2007/8 financial crisis, after which interest rates and mortgage rates came down.

We show three additional lines on the chart. The first is our severe stress measure, the blue line, which is higher than the default rate, but follows the non-performance line quite well. The second line is the PD30 estimate, our prediction at the time of the expected level of default, in the year ahead. This is shown by the dotted yellow line, and tends to lead the actual level of defaults. Again there is a reasonable correlation.

The final line shows the mild stress household data. This is plotted on the right hand scale, and has a lower level of correlation, but nevertheless a reasonable level of shaping. After the GFC, rates cuts, plus the cash splash, helped households get out of trouble by in large, but since then the size of mortgages have grown, income in real terms is falling, living cost are rising as is underemployment. Plus mortgage rates have been rising, and the net impact in the past six months, with the RBA cash rate cut on one hand, and out of cycle rises by the banks on the other, is that mortgage repayments are higher today, than they were, for both owner occupied borrowers and investors. Interest only investors are the hardest hit.

Households are responding by cutting back on their spending, seeking to refinance and restructure their loans, and generally hunkering down. All not good for broader economic growth!

So, given the severe stress, mild stress and our PD30 estimates are all currently rising, we expect non-performing loans to rise above 1% of portfolio during 2018. Unless the RBA cuts, and the mortgage rates follow.


Australians Curb Spending as Household Debt Balloons

From Reuters.

Australia’s economy may have achieved a remarkable winning streak, avoiding a recession for 25 years, but there are now clear signs that the consumers who have driven much of the growth are running out of puff.

With cash interest rates at a record low and house prices near record highs, the nation’s household debt-to-income ratio has climbed to an all-time peak of 189 percent, according to the Reserve Bank of Australia (RBA).

That means there are an increasing number of people who have little cash for discretionary spending – on everything from cars to electrical appliances and new clothes – as their pay packets get consumed by large mortgages and high rental payments in the country’s red-hot property market.

And it’s not as if a sudden plunge in home prices would help – it might well expose and exacerbate the problem, at least in the short run, squeezing many who have bought into the frothy market with high mortgage repayments and little equity in their homes.

“We are seeing a considerable spike in stress even in more affluent households. Large mortgages, big commitments but no income growth,” said Digital Finance Analytics (DFA) Principal Martin North. “Stressed households are less likely to spend at the shops, which acts as a drag anchor on future growth.”

North estimates a record 52,000 households risk default in the next 12 months and that 23.4 percent of Australian families are under mortgage stress, meaning their income does not cover ongoing costs. That compares with about 19 percent a year ago.

“People are up to their ears in mortgages,” said Brad Smith, a car sales consultant at MotorPoint Sydney which has seen a stark slowdown in sales in the past six months. “They are all on a budget. Everyone’s got all their money in houses, that’s how it is.”

Australians are also facing a cash crunch because price inflation in essential items such as food, electricity and insurance is accelerating at a 3.4 percent annual rate at a time when Australian wages are rising at their slowest pace on record, just 1.9 percent in the year to March.

Meanwhile, growth in retail sales, personal loans and luxury car sales are all at multi-year lows, suggesting the household sector – nearly 60 percent of Australia’s A$1.7 trillion ($1.3 trillion) economy – is under severe strain.

A CONSUMPTION PROBLEM

Australia’s love affair with property is worrying the RBA which has repeatedly warned against the danger of excessive real estate borrowing and the impact on spending elsewhere in the economy.

The central bank is reluctant to raise interest rates to cool the property market as it is concerned that would hit domestic demand at a time when real wages growth has turned negative. Besides, borrowing by businesses is growing at the slowest rate in three years.

Still, signs of a spending pullback is prompting economists to rethink Australia’s strong growth projections.

Only last month, the RBA upgraded its gross domestic product (GDP) forecast by 25 basis points to an annual 2.75-3.75 percent by the middle of next year from 2.50-3.50 percent it projected in February.

RBA’s confidence emanates from a levelling off in mining investment after years of steep falls, a rebound in the price of iron ore and coal prices – Australia is a major exporter of both – from 2015 lows, and the home building boom.

However, many believe the central bank’s forecast might prove too optimistic.

Both Morgan Stanley and National Australia Bank believe the economy might have slammed into reverse in the March quarter, after rising 1.1 percent in the December quarter. First-quarter GDP data is due on June 7.

“As the housing market slows, we see consumption growth as a major risk amid record-low wages growth and ongoing headwinds to discretionary cash flows,” Morgan Stanley economist Daniel Blake said.

RETAILING PAIN

Weak consumer spending is proving a huge drag on retailers’ performance, with shares in furniture and appliance chain Harvey Norman and electronics shop JB Hi-Fi both trading near one-year lows.

Retail sales have hardly grown in the past few months. Even online sales have slowed, with all major categories including homeware, games and toys, daily deals and takeaway food shrinking in April, according to the NAB Online Retail Sales Index.

Car sales have flattened this year after solid growth in 2016 while sales of luxury cars and sports utility vehicles are at a four-year low.

For consumers such as Sydney resident Marie-Aimee Guillermin, there’s little ‘play money’ left after stepping into Sydney’s housing market with a A$1.4 million 3-bedroom house last month.

“We thought once we had the house we could take our foot off the brake a little bit but now that we have it I feel even less certain in terms of stability and financial security,” she told Reuters.

“So whether we’ll end up spending a bit more on clothes and restaurants and going out and what have you I don’t see that happening.” ($1 = 1.3377 Australian dollars)

(Reporting by Swati Pandey; Editing by Jonathan Barrett and Martin Howell)


Mortgage Stress Accelerates Further In May

Digital Finance Analytics has released mortgage stress and default modelling for Australian mortgage borrowers, to end May 2017.  Across the nation, more than 794,000 households are now in mortgage stress (last month 767,000) with 30,000 of these in severe stress. This equates to 24.8% of households, up from 23.4% last month. We also estimate that nearly 55,000 households risk default in the next 12 months.

The main drivers are rising mortgage rates and living costs whilst real incomes continue to fall and underemployment is on the rise.  This is a deadly combination and is touching households across the country,  not just in the mortgage belts.

This analysis uses our core market model which combines information from our 52,000 household surveys, public data from the RBA, ABS and APRA; and private data from lenders and aggregators. The data is current to end May 2017.

We analyse household cash flow based on real incomes, outgoings and mortgage repayments. Households are “stressed” when income does not cover ongoing costs, rather than identifying a set proportion of income, (such as 30%) going on the mortgage.

Those households in mild stress have little leeway in their cash flows, whereas those in severe stress are unable to meet repayments from current income. In both cases, households manage this deficit by cutting back on spending, putting more on credit cards and seeking to refinance, restructure or sell their home.  Those in severe stress are more likely to be seeking hardship assistance and are often forced to sell.

Martin North, Principal of Digital Finance Analytics said “Mortgage stress continues to rise as households experience rising living costs, higher mortgage rates and flat incomes. Risk of default is rising in areas of the country where underemployment, and unemployment are also rising. Expected future mortgage rate rises will add further pressure on households”.

“Stressed households are less likely to spend at the shops, which acts as a drag anchor on future growth. The number of households impacted are economically significant, especially as household debt continues to climb to new record levels. The latest housing debt to income ratio is at a record 188.7* so households will remain under pressure.”

“Analysis across our household segments highlights that stress is touching more affluent groups as well as those in traditional mortgage belts”.

*RBA E2 Household Finances – Selected Ratios Dec 2016.

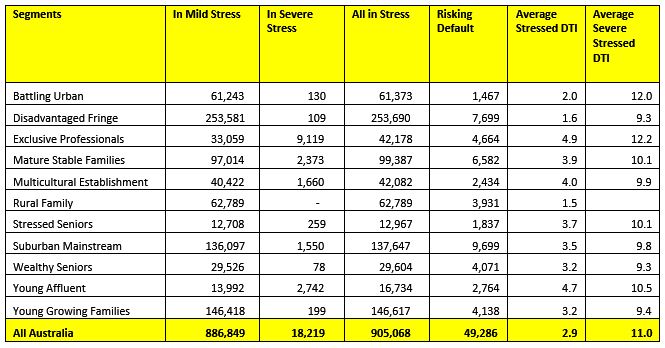
Regional analysis shows that NSW has 216,836 (211,000 last month) households in stress, VIC 217,000 (209,000), QLD 145,970 (139,000) and WA 119,690 (109,000). The probability of default has also risen, with more than 10,000 in WA, 10,000 in QLD, 13,000 in VIC and 15,000 in NSW.

Probability of default extends the mortgage stress analysis by overlaying economic indicators such as employment, future wage growth and cpi changes.  Regional analysis is included in the table below.

Record numbers of home owners approaching Mortgage stress

From Ten Eyewitness News

When it comes to paying off the Mortgage, it’s a slippery slope that could see the entire house of cards come tumbling down.

New figures released by the Australian National University have found that one in five Aussies are constantly struggling to pay their mortgage, while others have admitted to falling behind.

The results showed that almost one in every four mortgage holders would face difficulty keeping up with their repayments if interest rates increased by two percentage points.

It’s an ugly picture to paint, with one of four households nationwide in mortgage stress, Digital Finance Analytics principal Martin North said the risk of default was rising, especially in areas where underemployment and unemployment were also rising.

“Mortgage stress continues to rise as households experience rising living costs, higher mortgage rates and flat incomes,” Mr North said.

“Expected future mortgage rate rises will add further pressure on households.”

Tuesday’s Federal budget is predicted to contain housing affordability measures, but the ANU poll found 68 percent of those not in the housing market are concerned they will never be able to afford a home.

It’s a stark contrast; 75 percent of those surveyed believe owning a home is part of the Australian way of life, yet 87 percent are concerned future generations won’t be able to afford to buy a house.

Associate Professor Ben Phillips said the survey showed support for an increase in the supply of housing and public housing.

“The ANU poll also found almost half of homeowners would be willing to see their property stop growing in value to improve housing affordability while only 31.8 percent would not.

“This may suggest that the issue of housing affordability is acute enough that Australians may accept policy change that could reduce prices or the rate of price growth to allow more equitable access to the housing market,” he said.