As we continue our series on mortgage stress, using the latest data from our surveys, we look at how stress aligns with our core household and property owning segments.
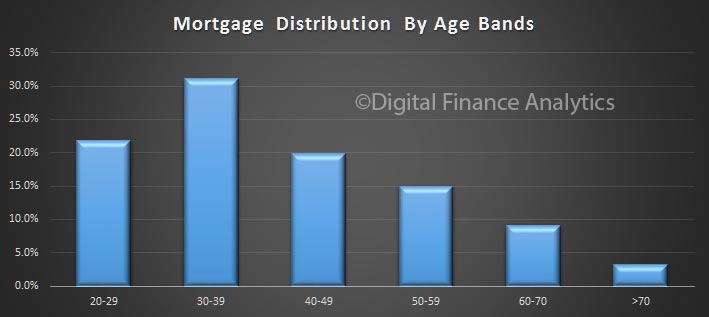
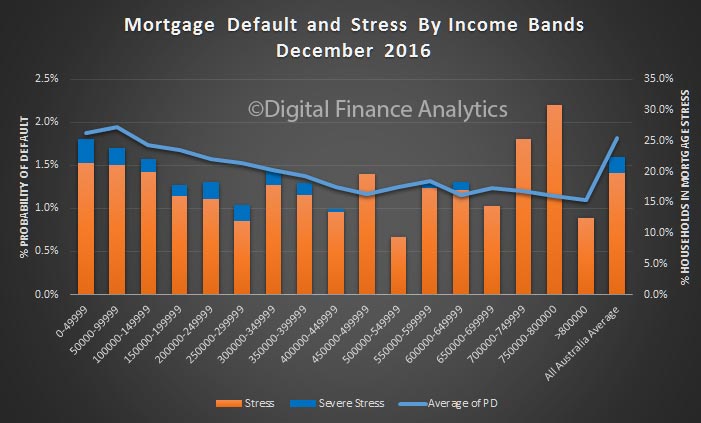
To set the context for this, here are a couple of charts showing the mortgage distribution by income and age bands. The majority of mortgages are held by households with an income of between $50,000 and $150,000.
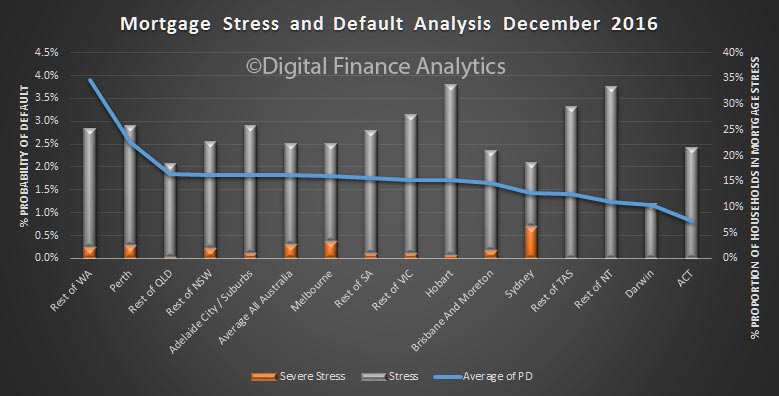
 Mortgage stress and default are slightly higher across the lower income bands, but note that households with substantially higher incomes can also be in severe stress. But of course the absolute number are very small.
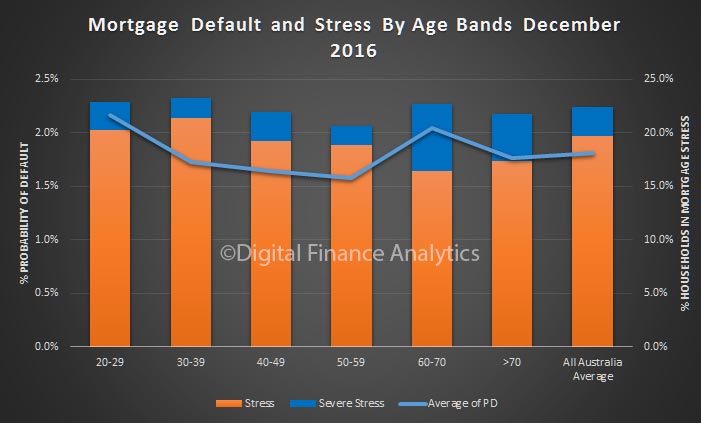
 The highest proportion of mortgages are held by those aged 30-39, more than 30%.
Default probability is higher among younger and older households. Whilst the number of these households with a mortgage is relatively low, more are in severe mortgage stress because their incomes are much lower. More generally, some mortgage stress is evident across all age bands. In volume terms, the highest stress volumes are found in those 30-39 years.
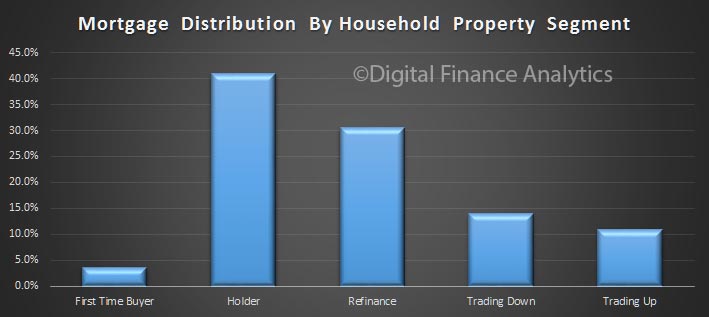
 Next we turn to our property segmentation. Those holding property account for the largest segment of the market. You can read about our segmentation approach here.
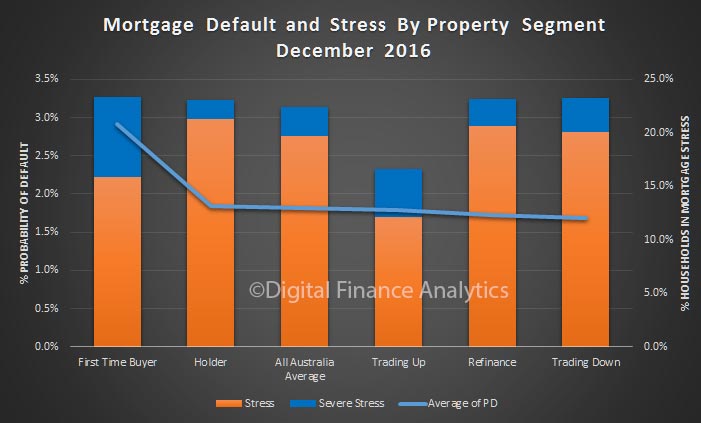
 Probability of default is highest among first time buyers, who also have the highest proportion of severe mortgage stress. The segment with the lower risk and levels of stress are those seeking to trade up.
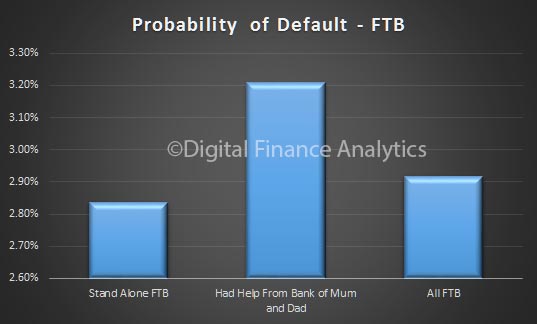
 On interesting finding, bearing in mind we highlighted the rise of first time buyers seeking help from “The Bank of Mum and Dad“, is that those who do get help are more likely to default. So, assistance from parents may be a two-edged sword.
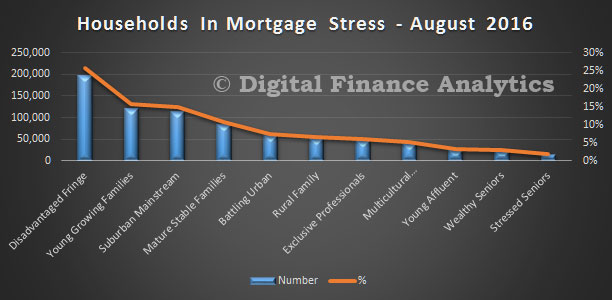
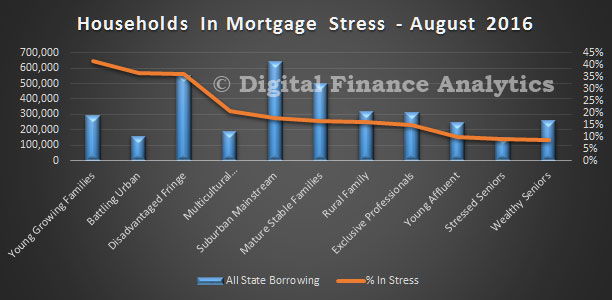
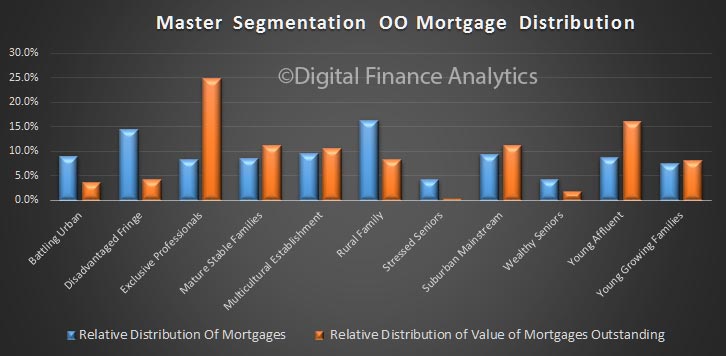
 Finally, we turn to our master segmentation. The number of households with a mortgage varies across these segments. The value distribution footprint is quite different, with the exclusive professional and young affluent segments holding the larger average mortgage.
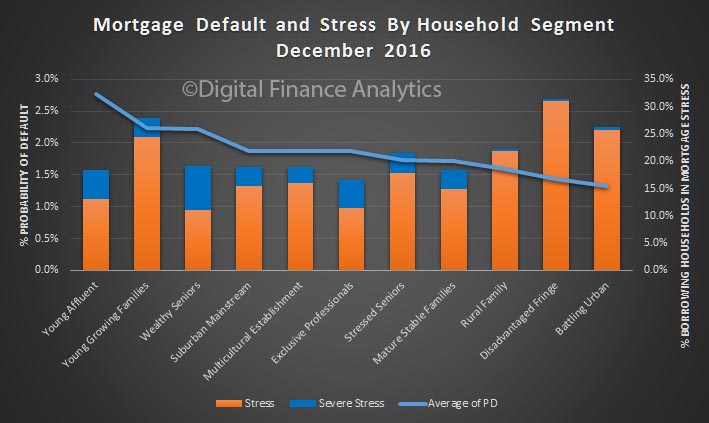
 Mortgage stress is highest among the disadvantaged fringe, though their mortgages are relatively lower and default rates are relatively low. Wealthy seniors registered high levels of severe mortgage stress, thanks to pressure on incomes (the impact of low returns from bank deposits and rentals are important here).
However, the highest risk of defaults sits with the younger segments. Young affluent households, with large mortgages are most exposed because their incomes are flat whilst they are highly leveraged, so as interest rates rise, they are exposed. Many have bought new high-rise apartments in the inner city areas.
Young growing families may have, on average smaller mortgages, but their finances are tight, with little room to maneuver, and any rise in interest rates will be a problem for them. Costs are living are moving higher for this group, especially child care costs.
 So, we think effective segmentation is critical to understand the various portfolio risks which reside in the bank’s mortgage book. We need to move beyond LVR and LTI.
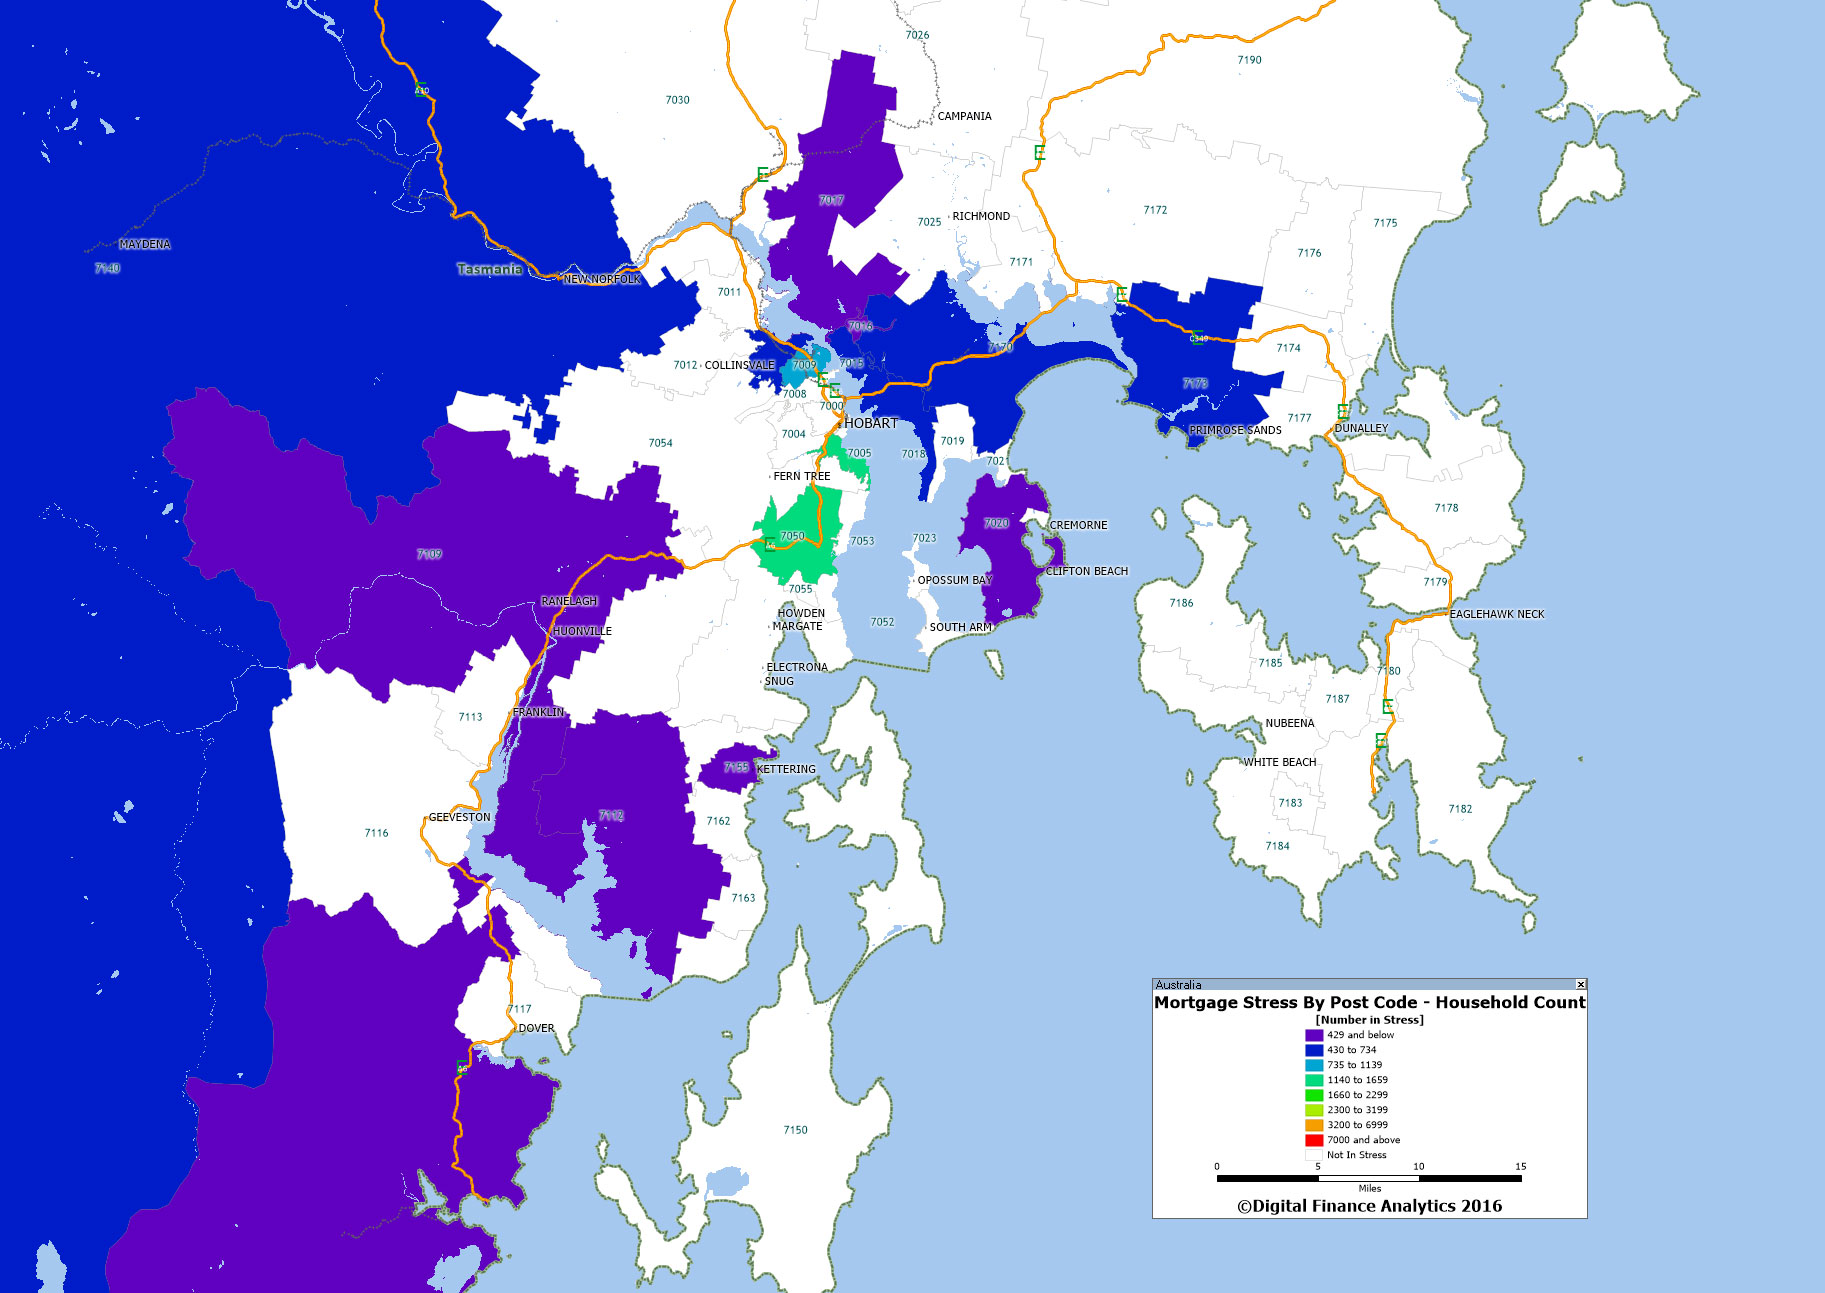
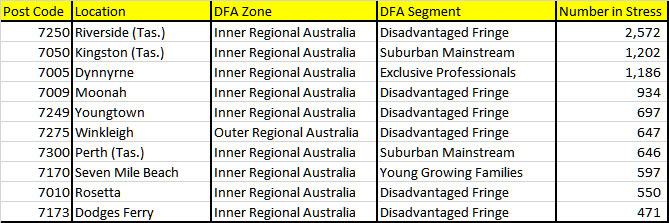
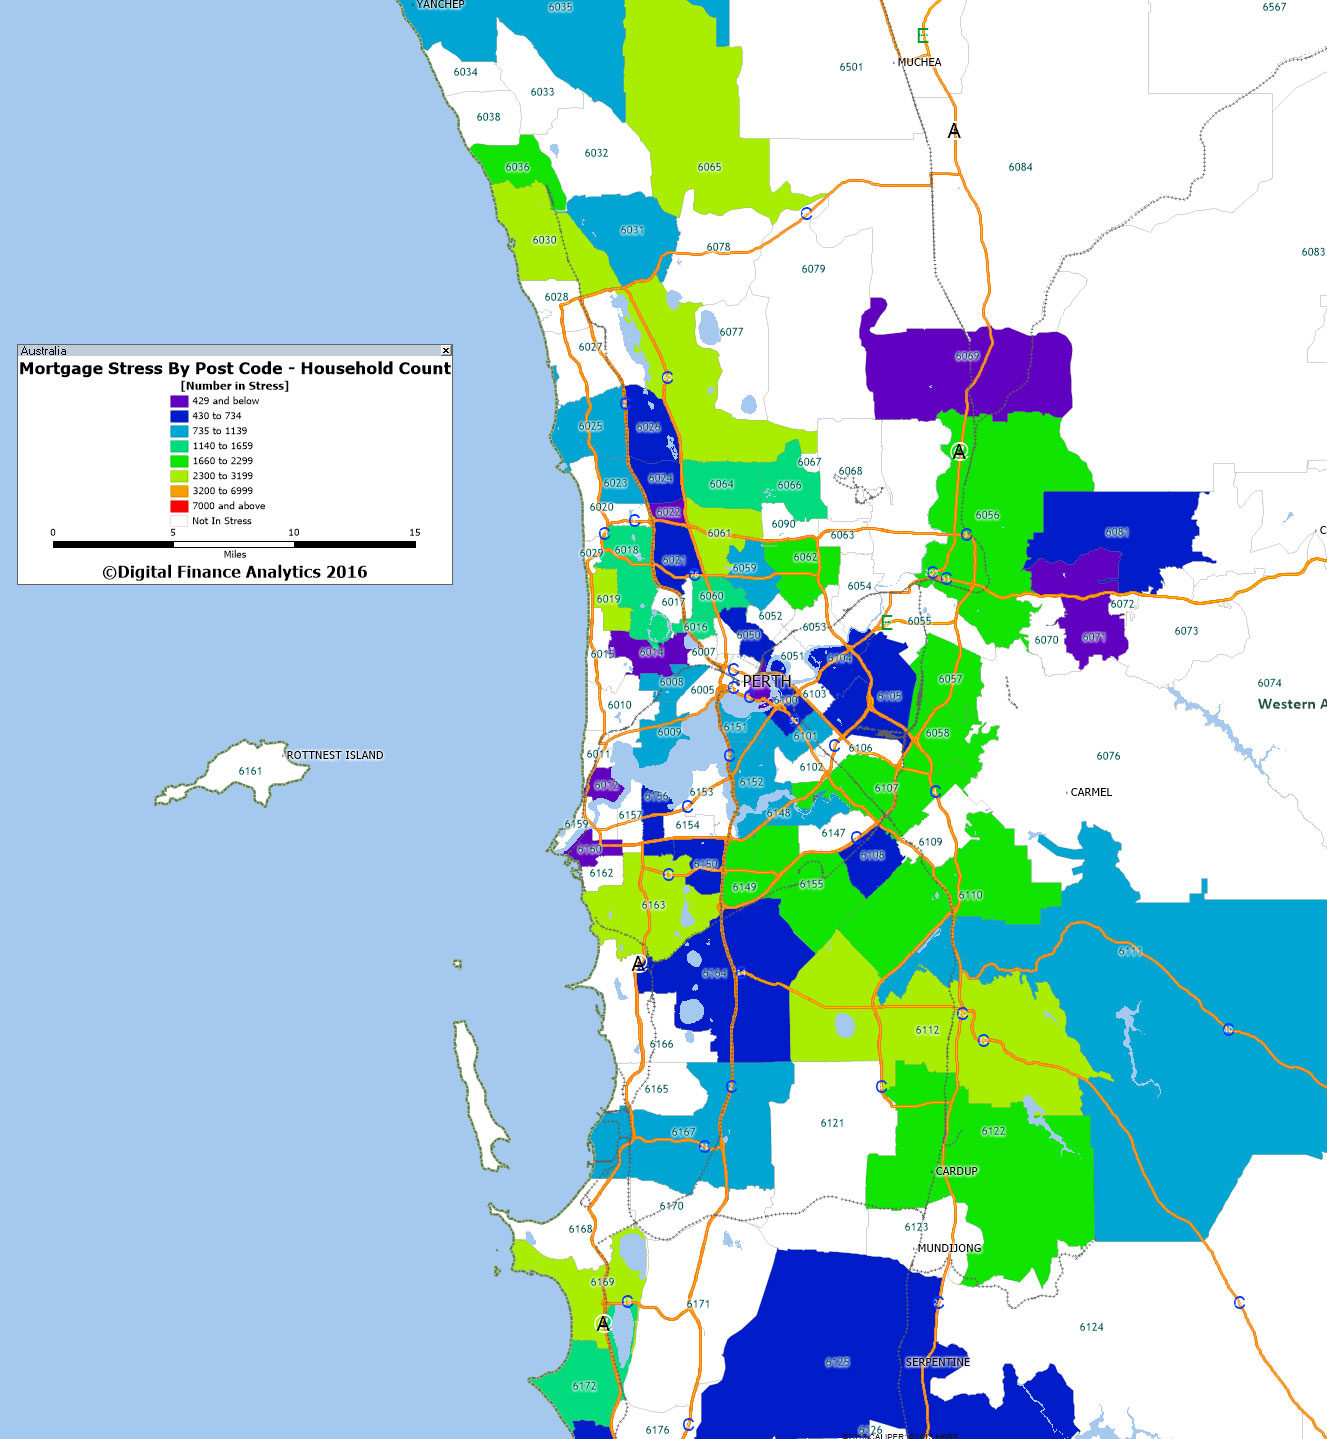
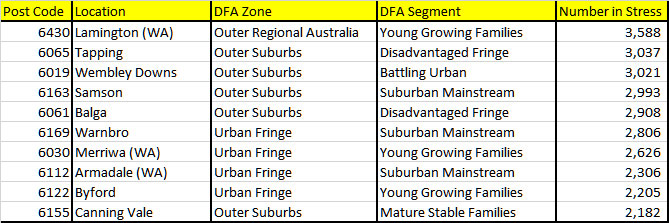
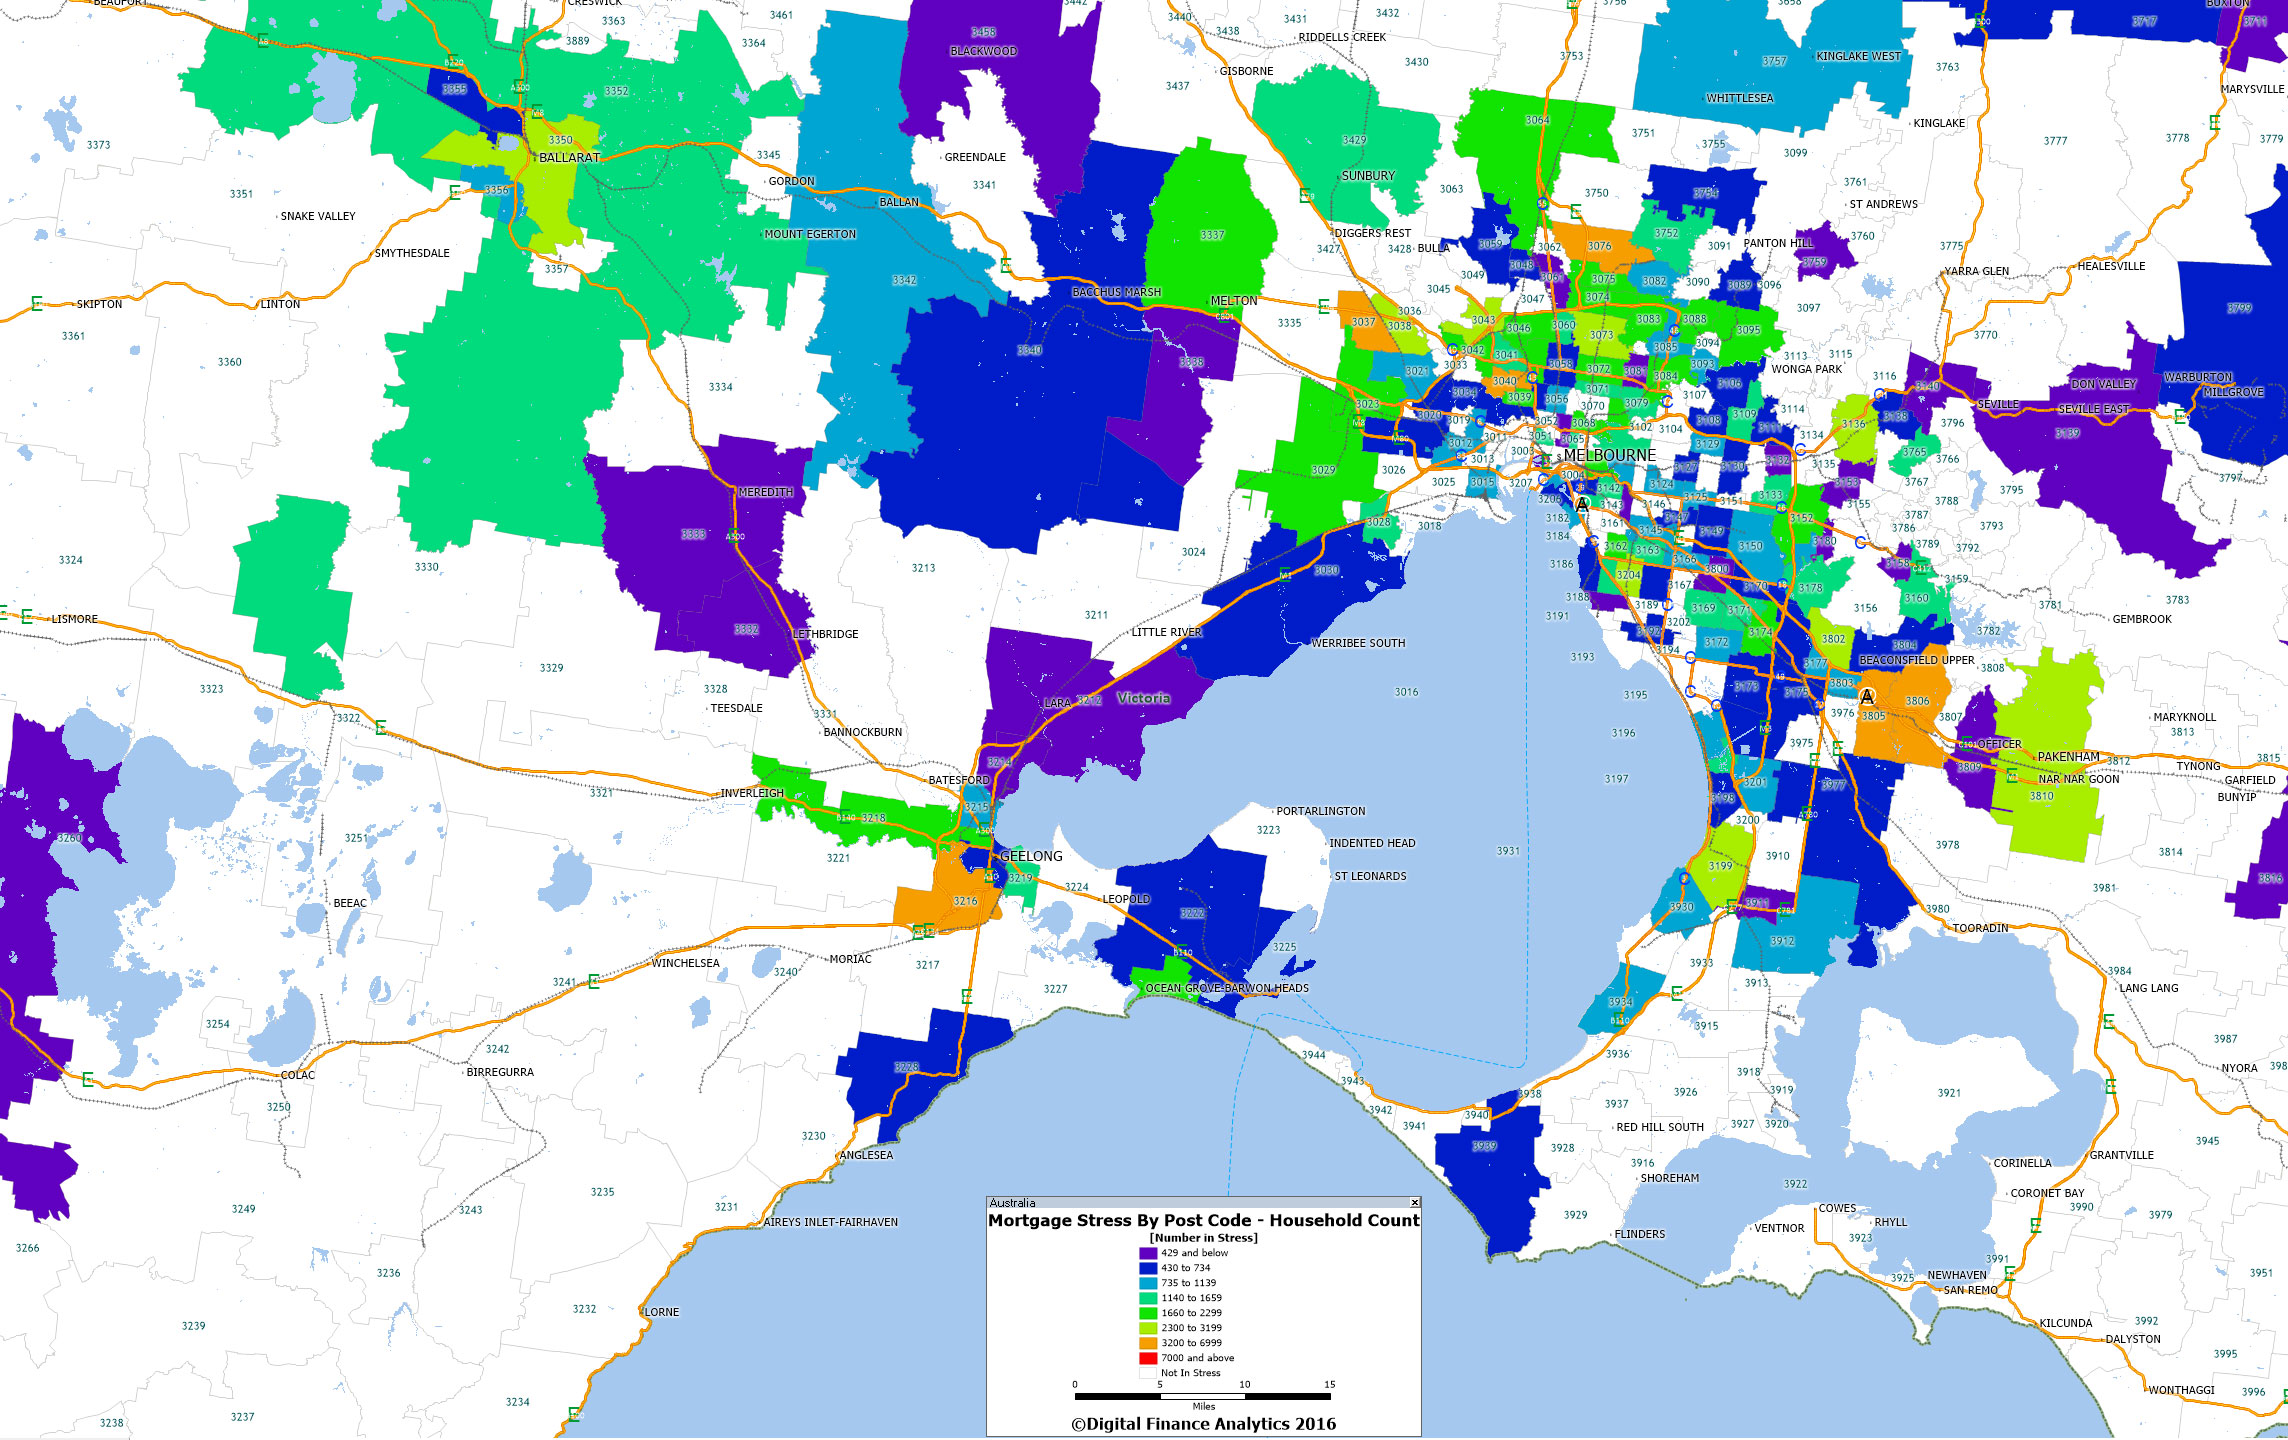
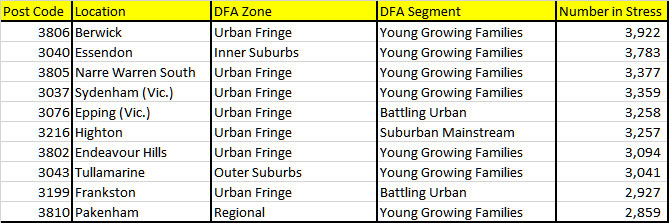
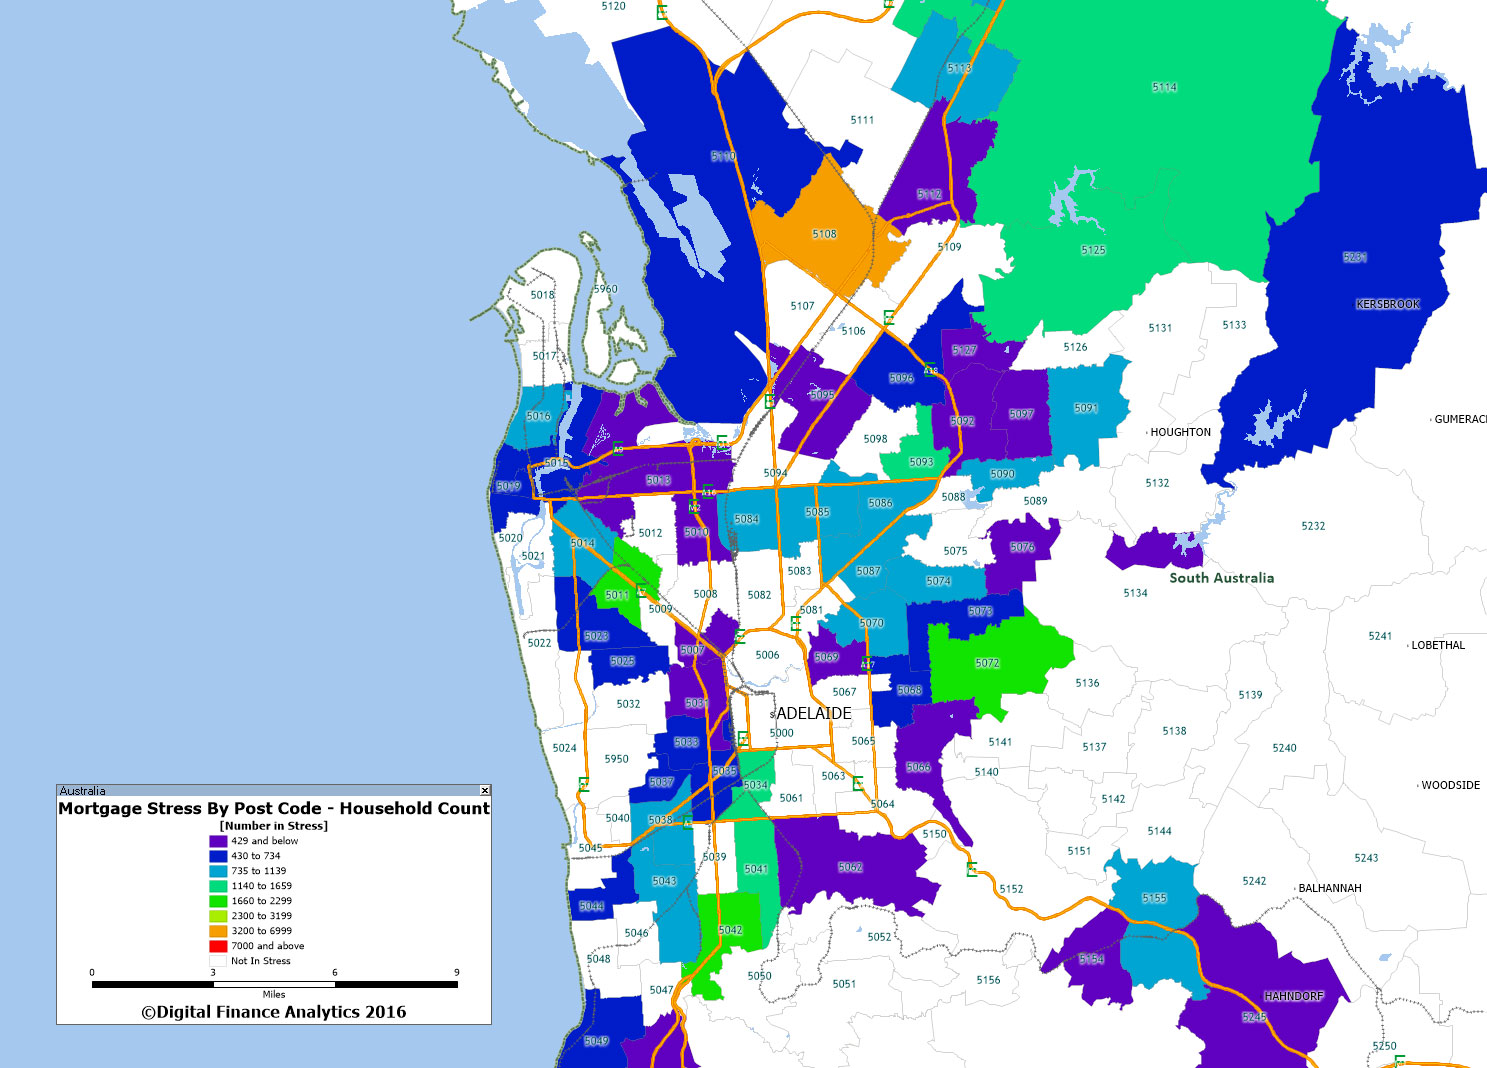
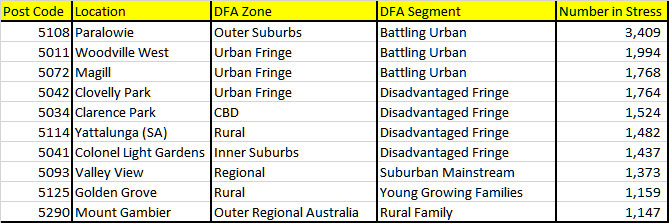
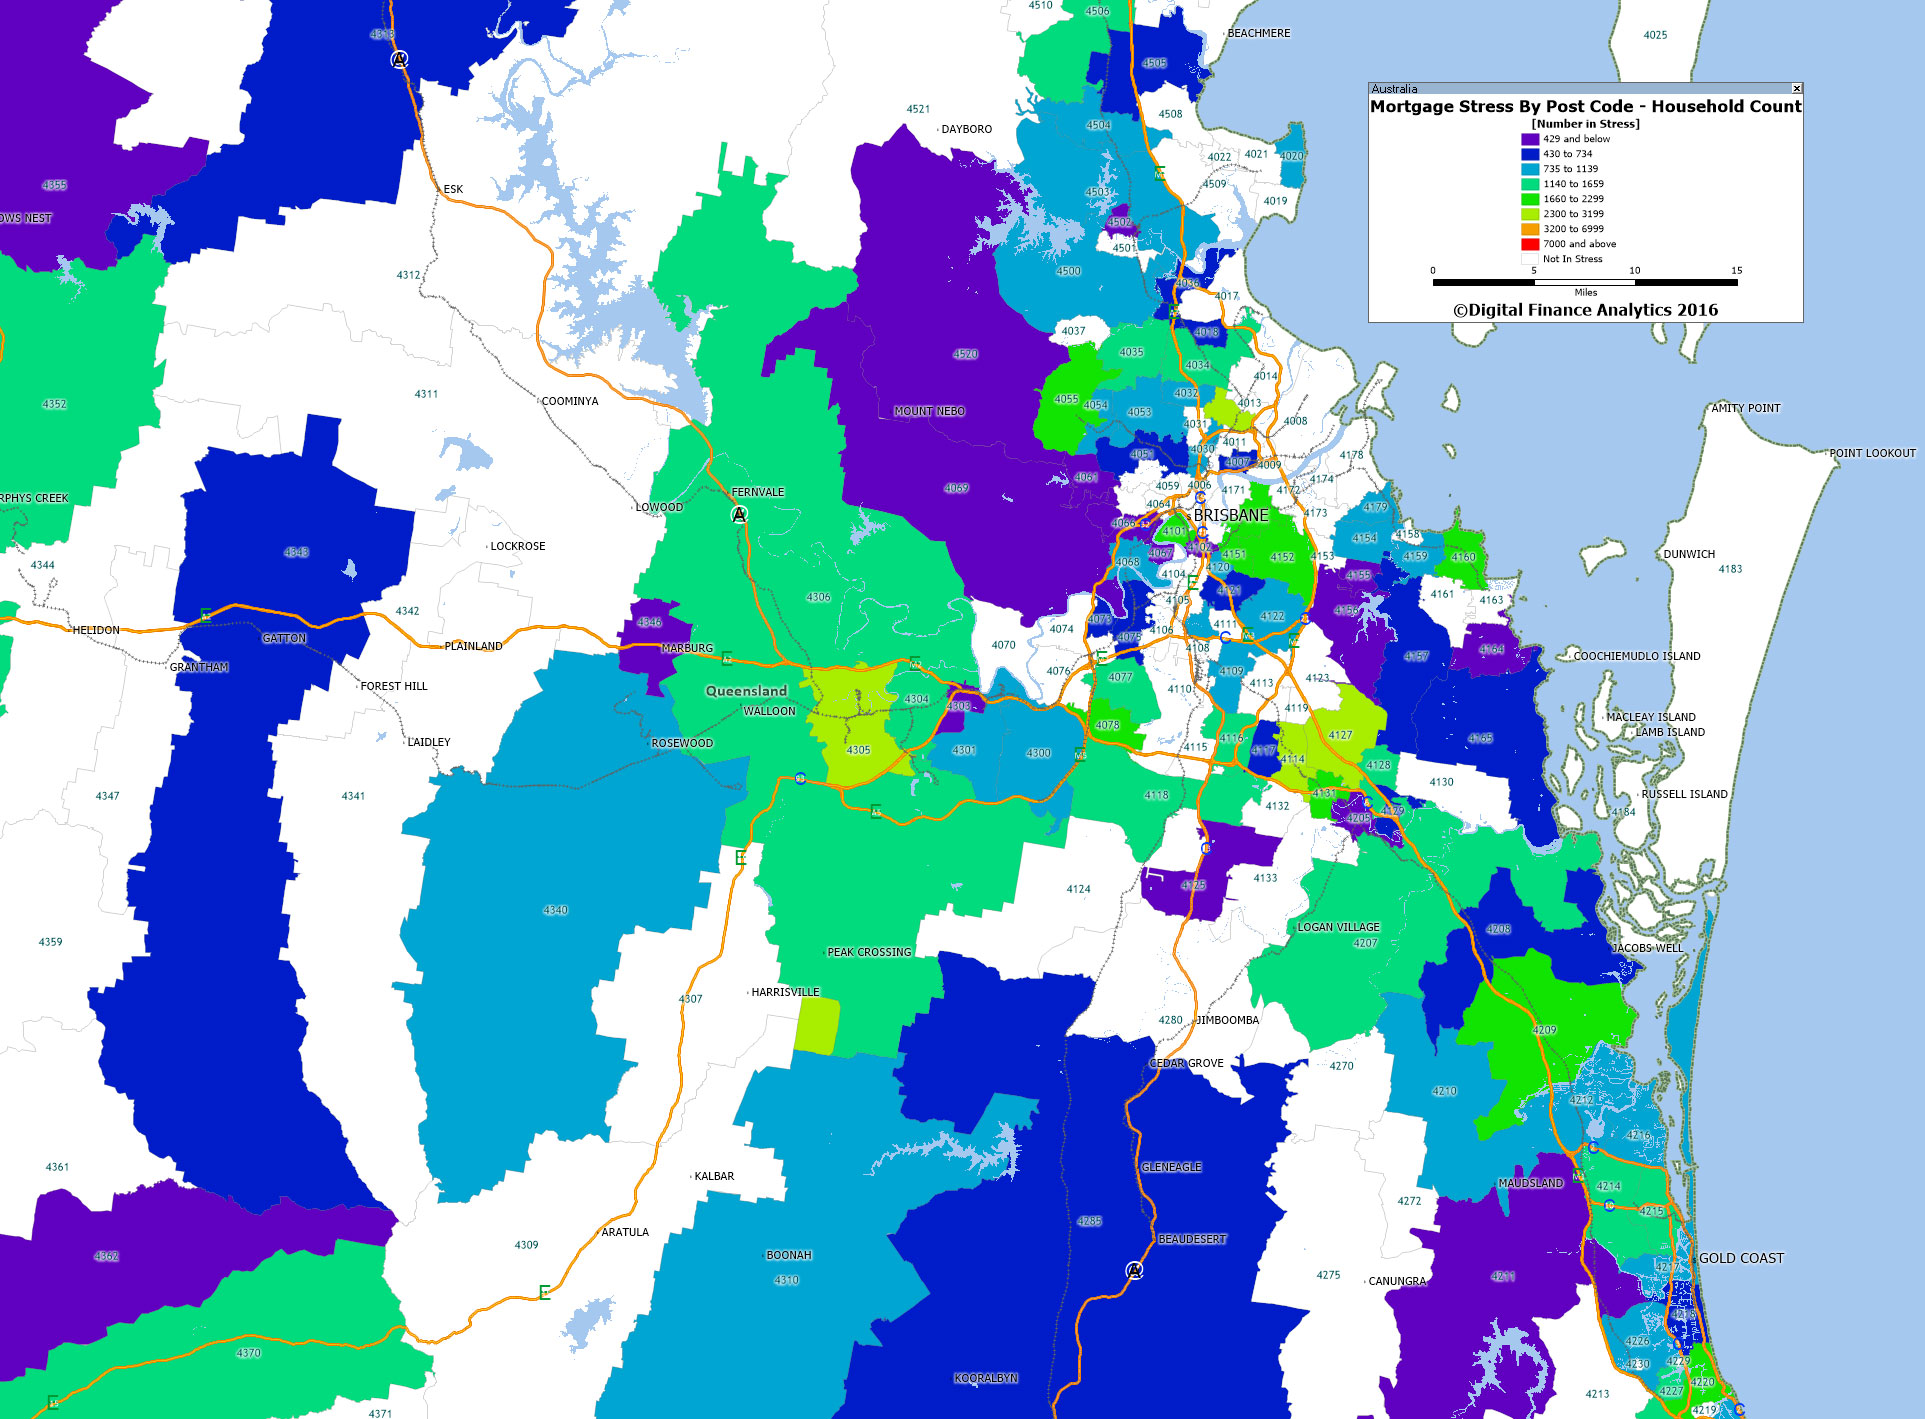
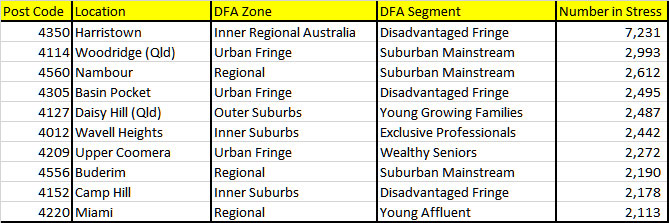
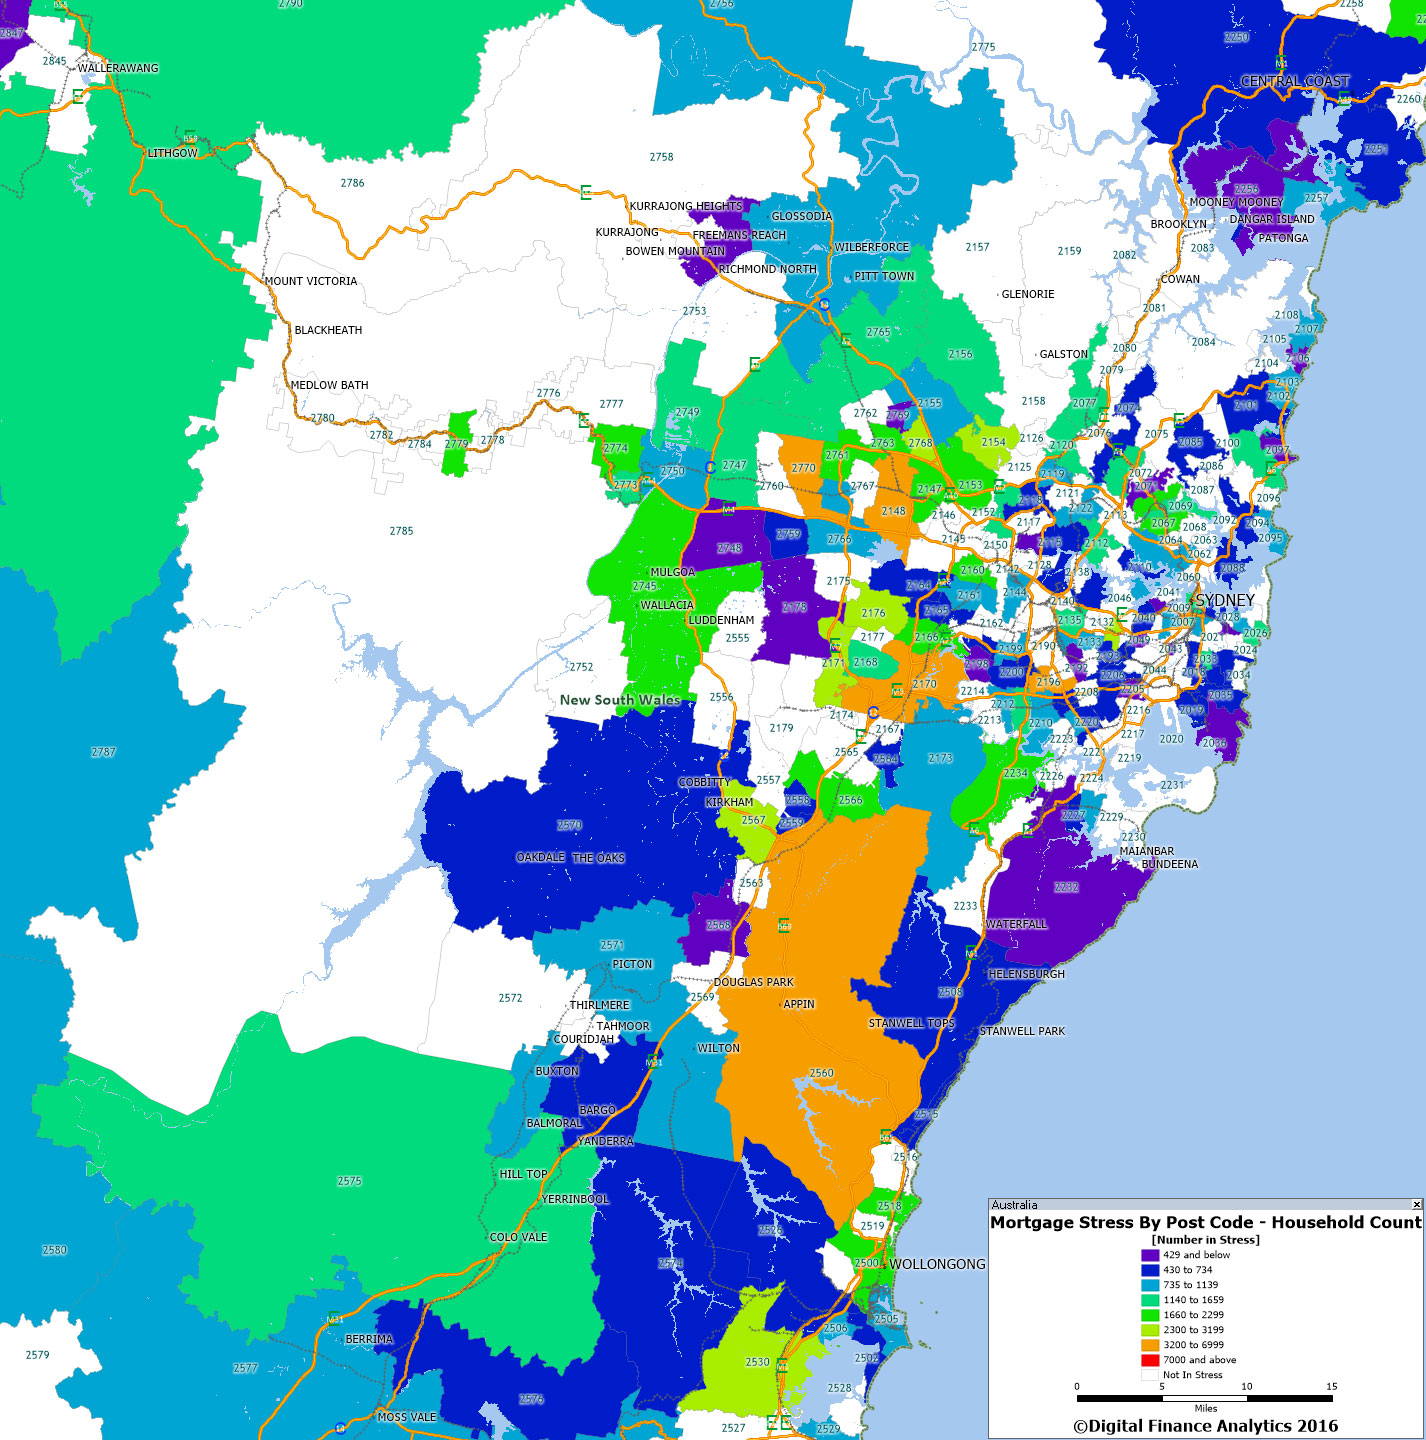
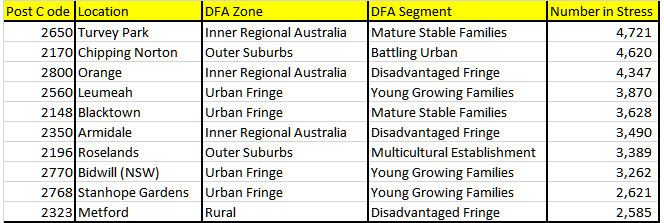
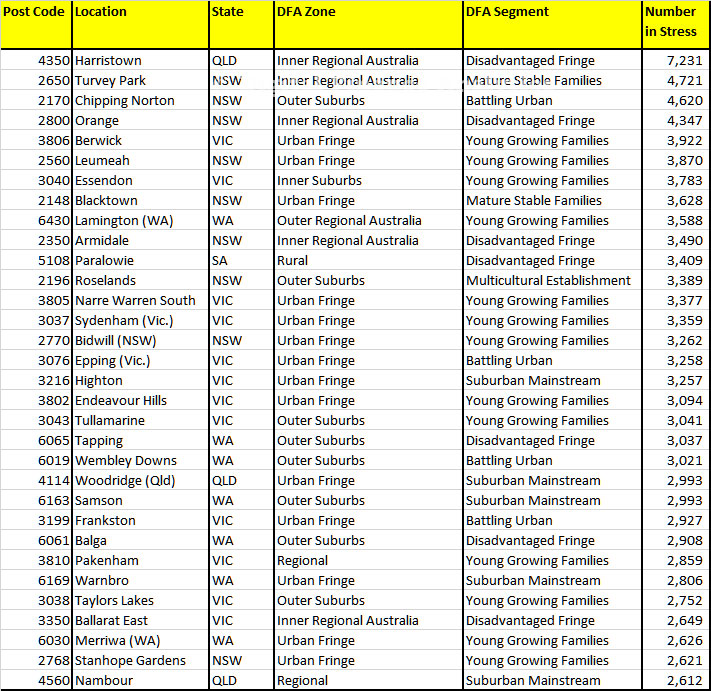
Next time we will look at some of the post code level data.