Why Household Financial Stress Remains High

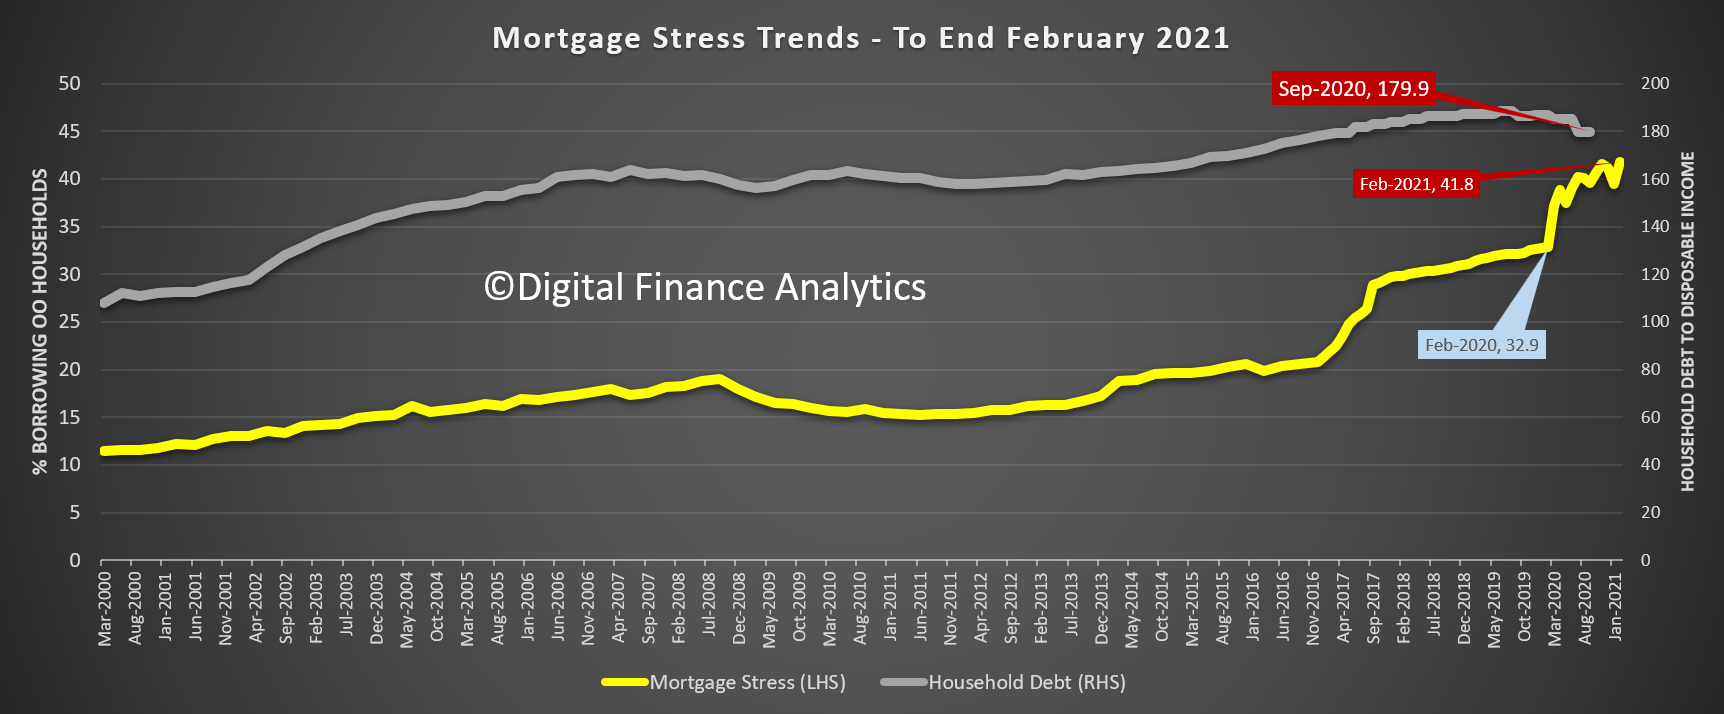
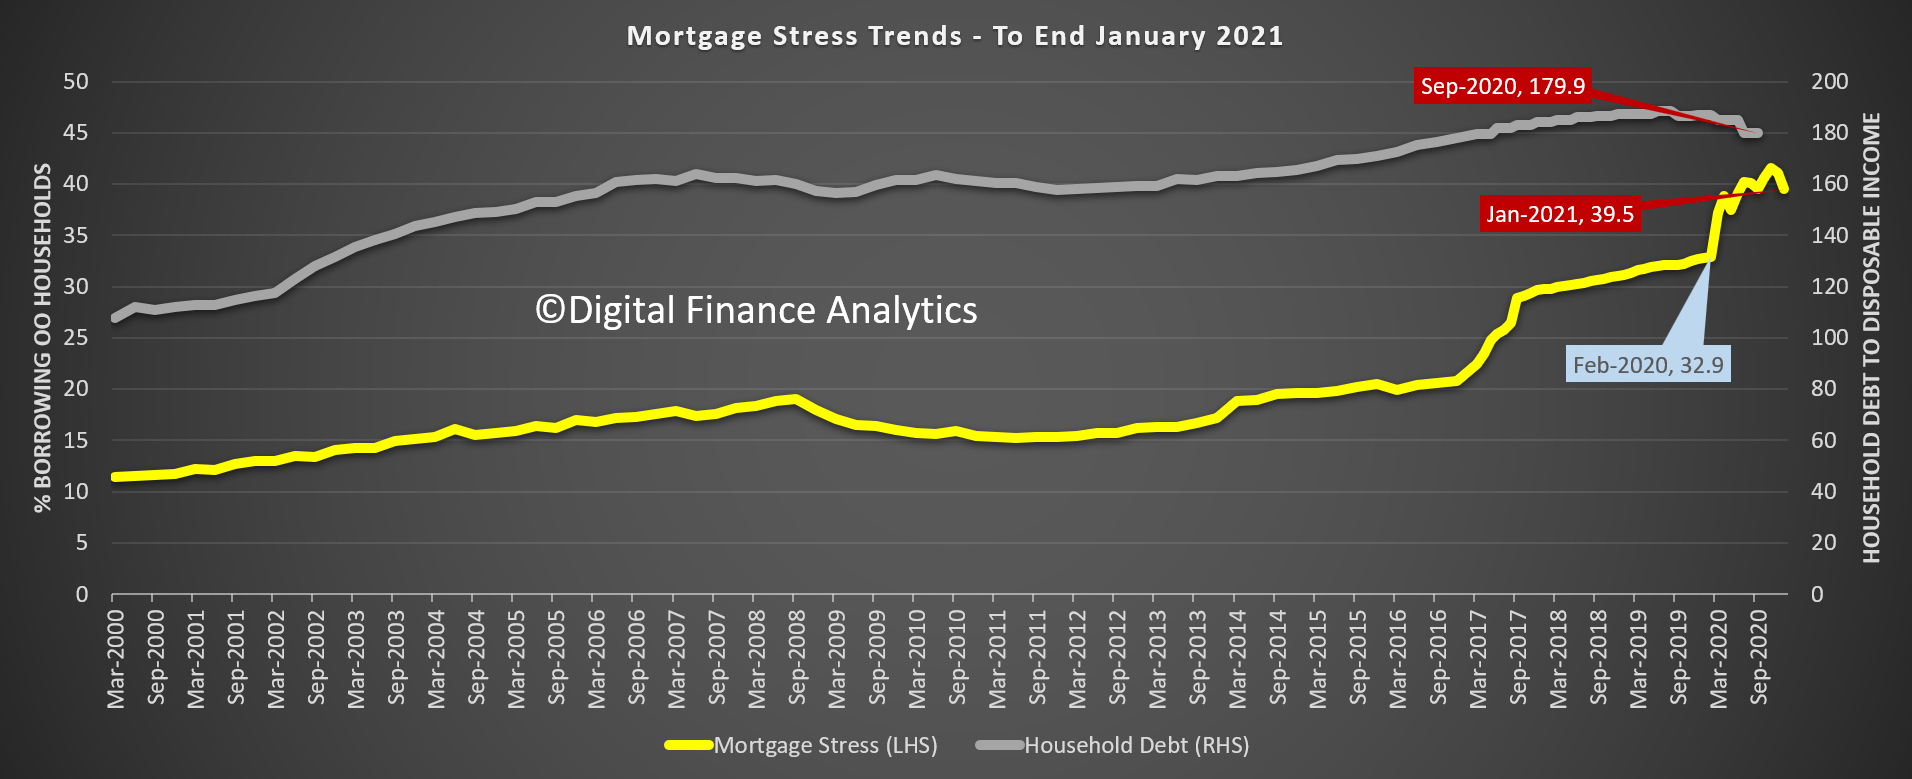
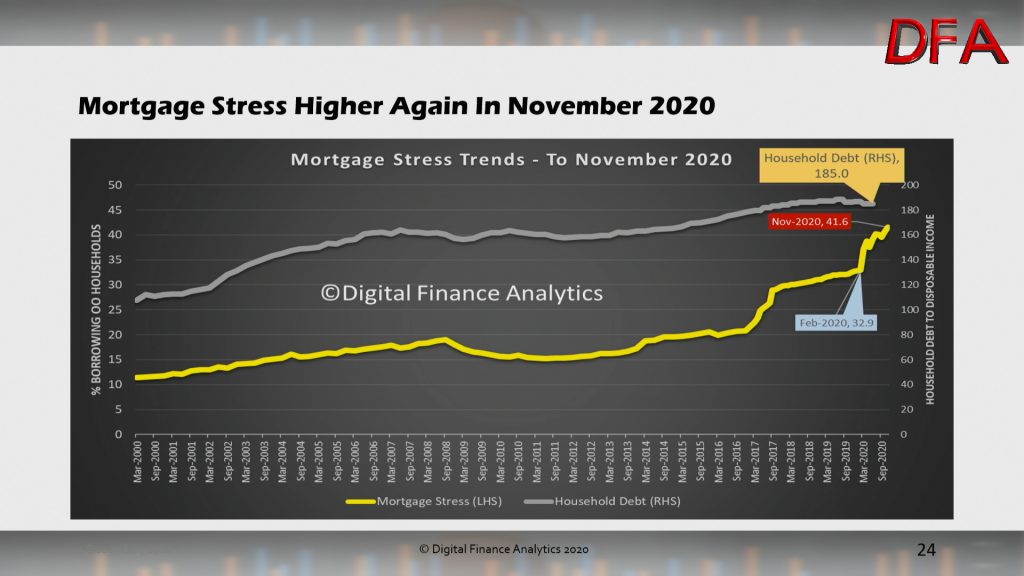
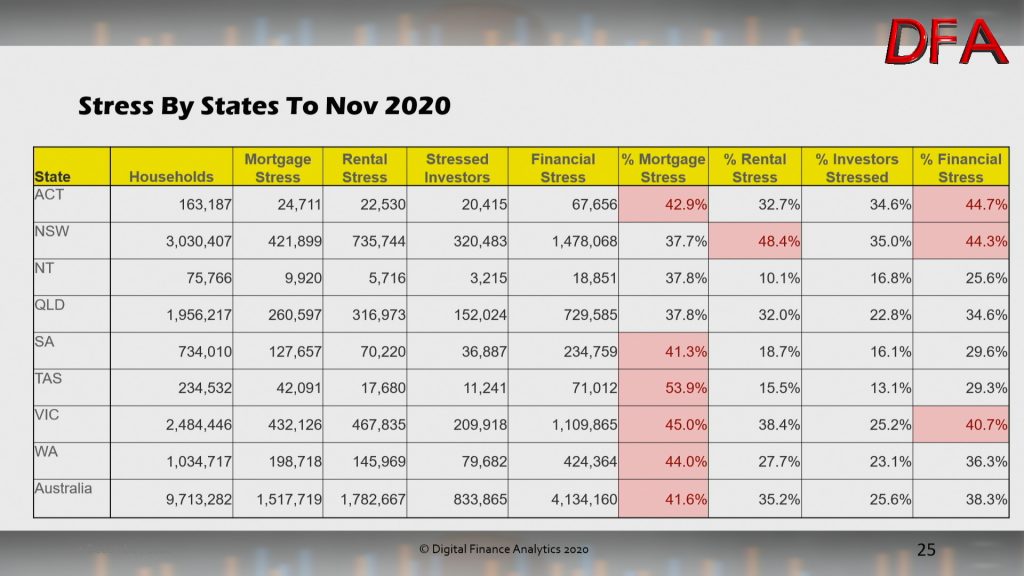
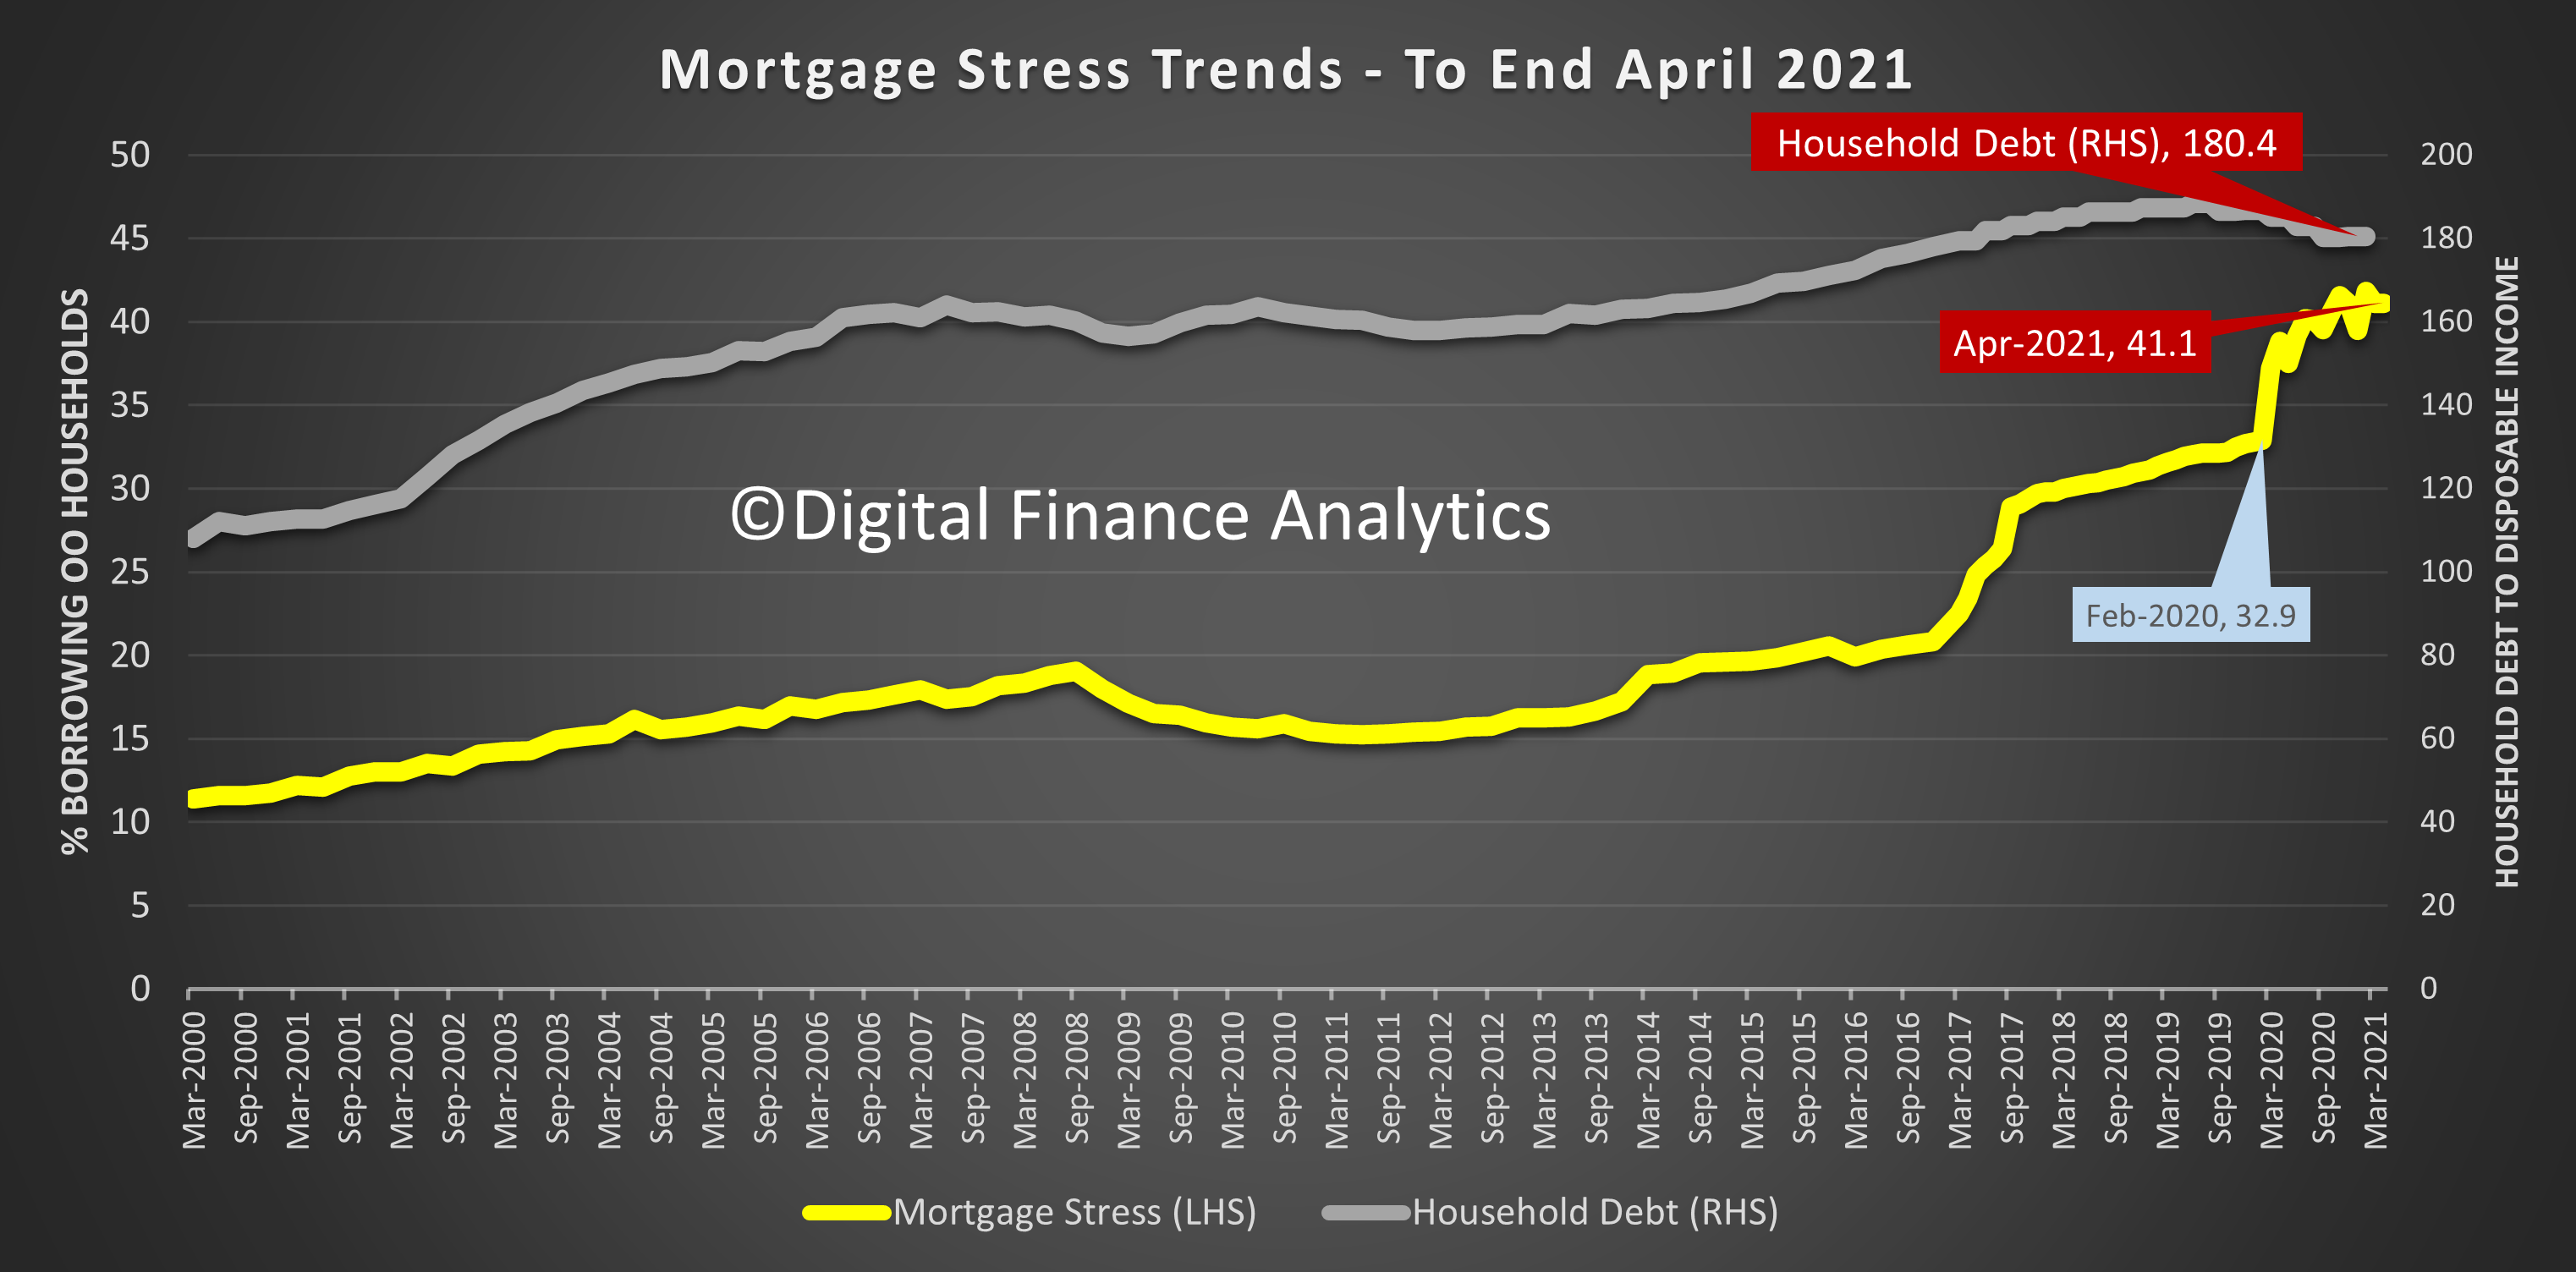
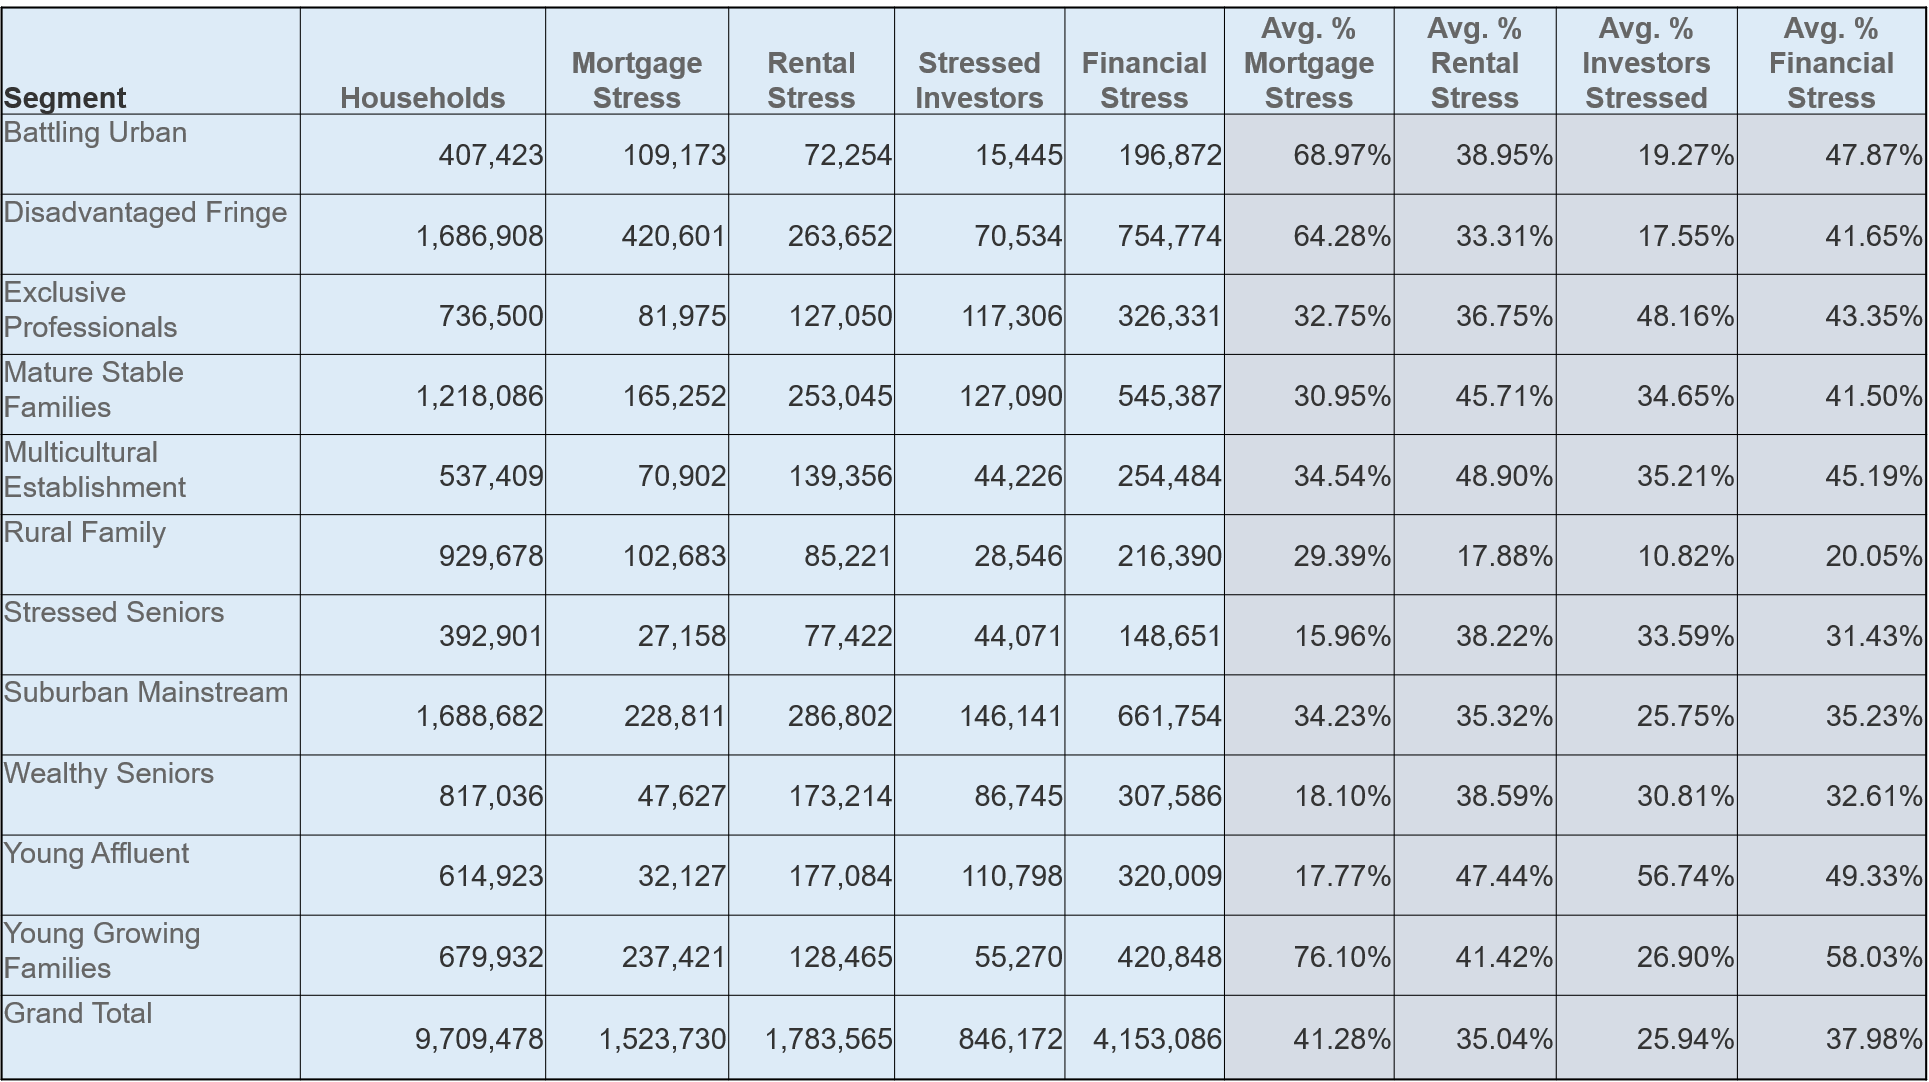
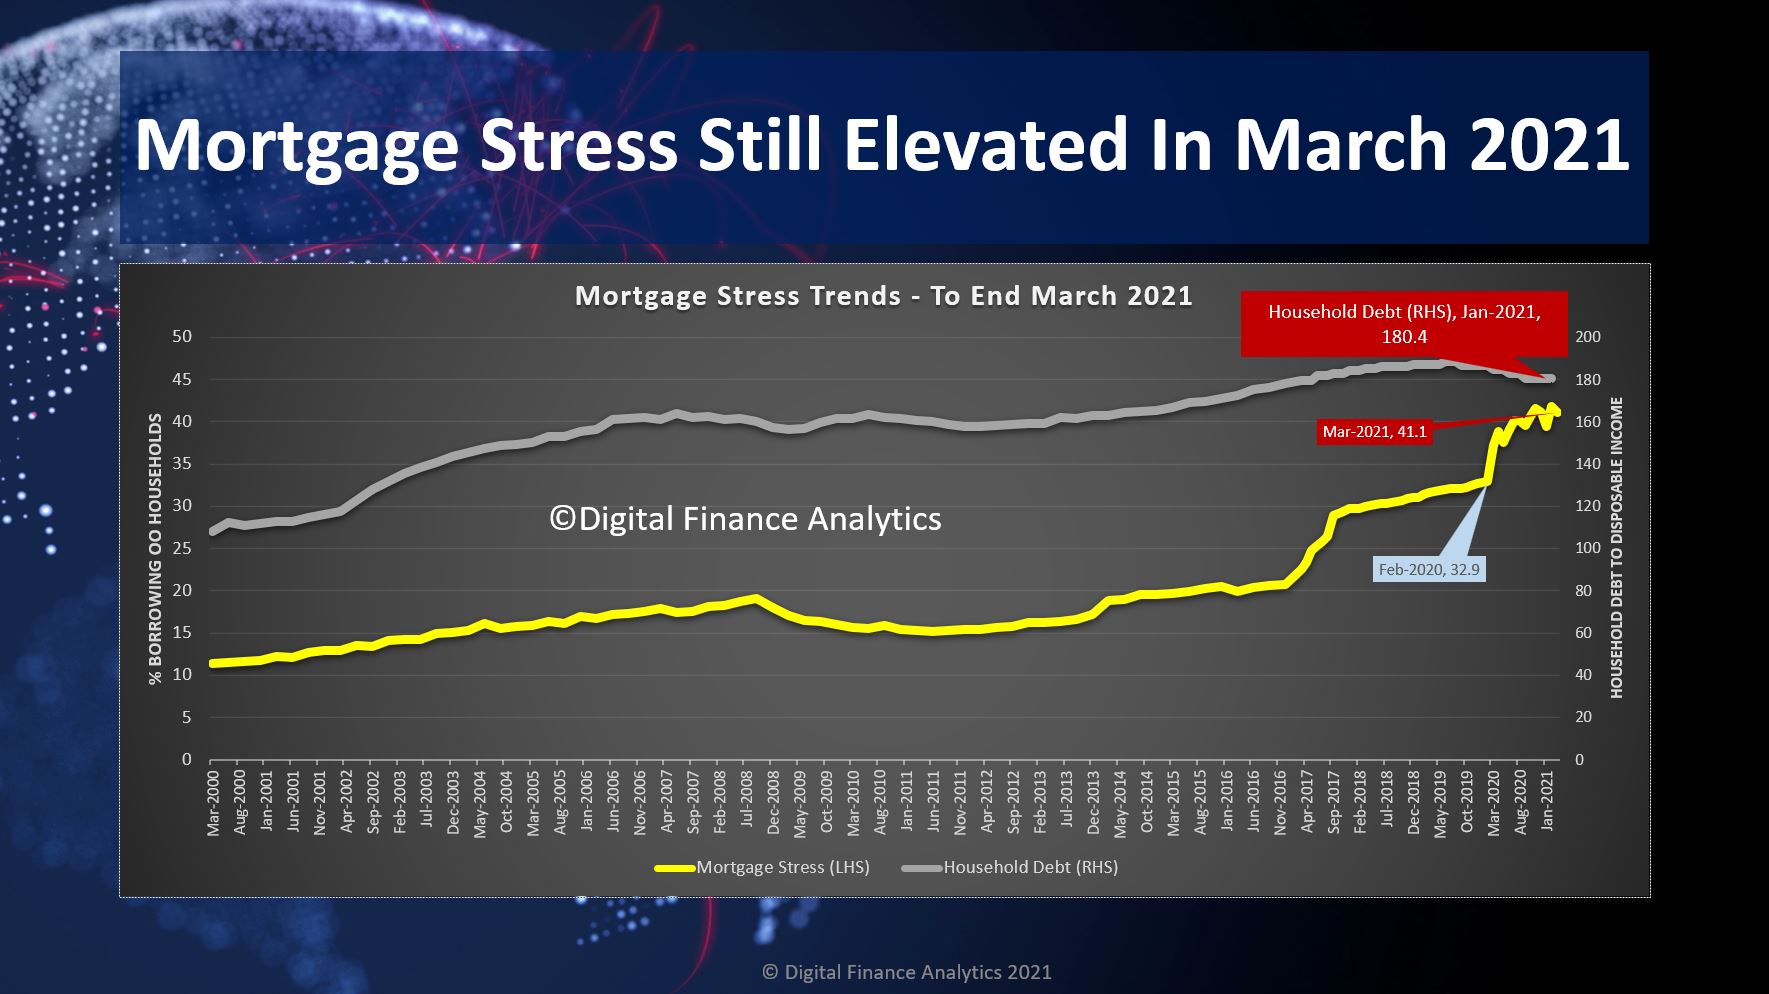
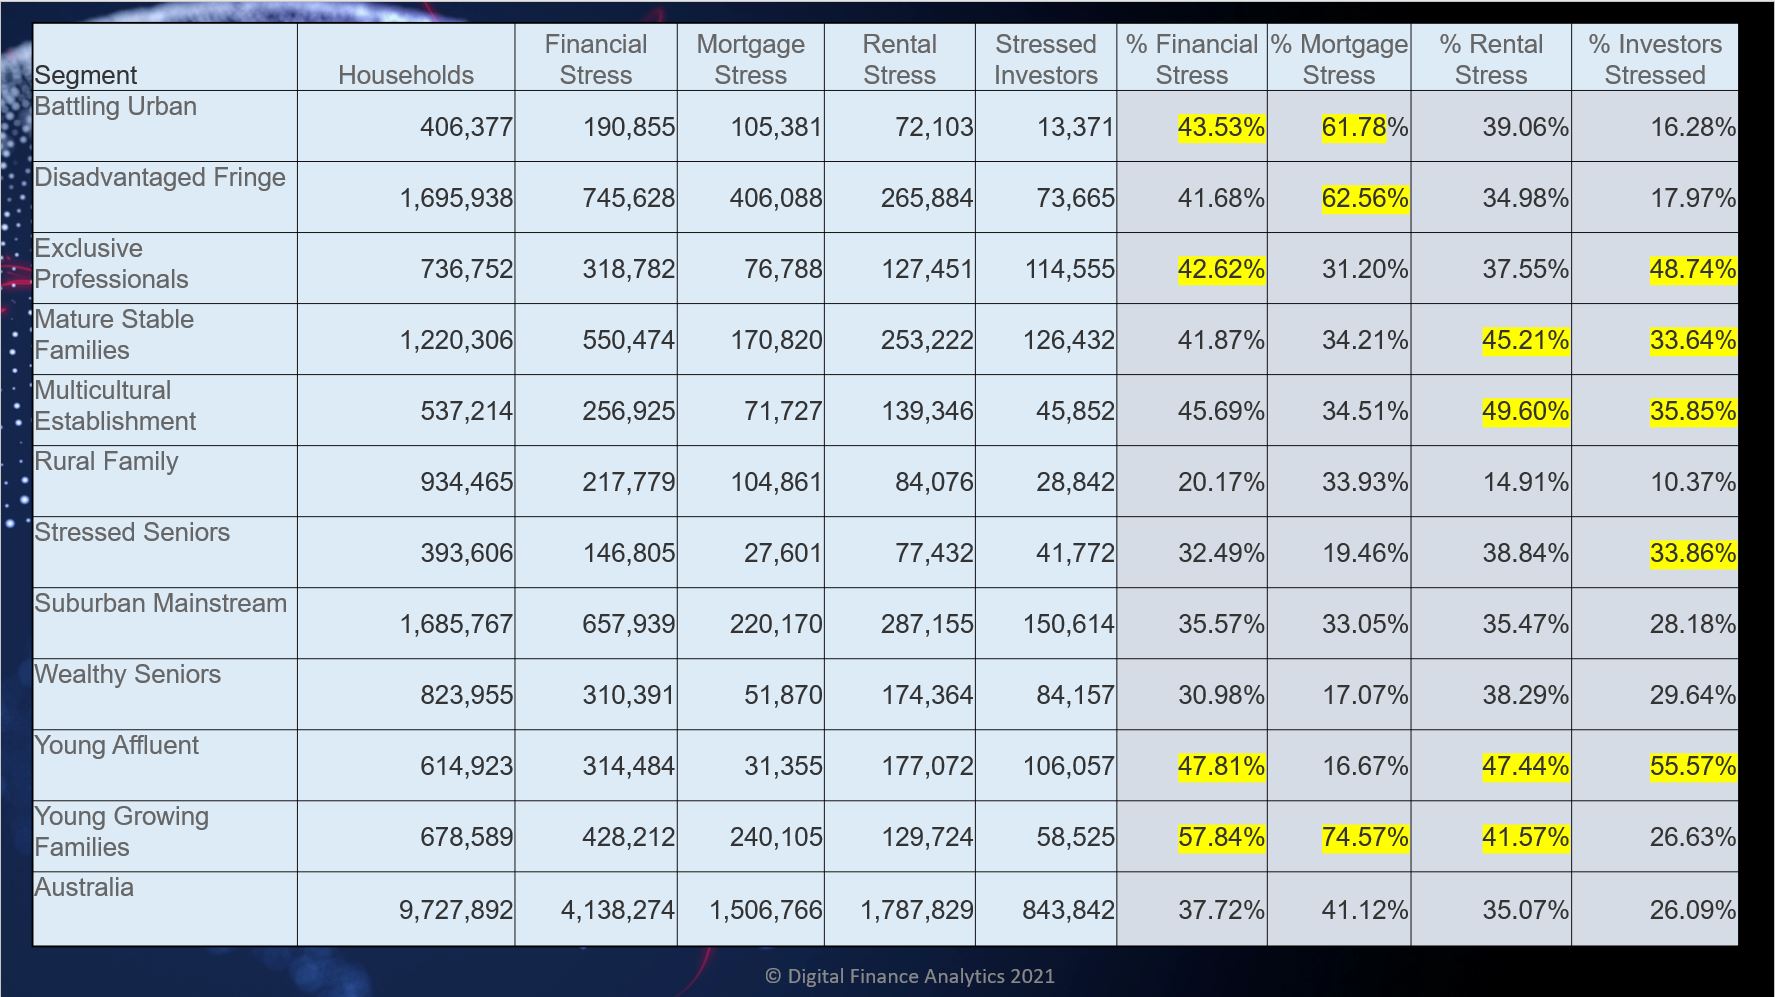
The latest data from our household surveys for May revealed little change in mortgage stress among households – still at around 41%, but there was a shocking rise in rental stress as the JobSeeker and JobKeeper supports were withdrawn, and the random lock-downs continue.

Even Property “experts” accept that affordability has deteriorated recently, as house prices rocket higher in many suburbs, although of course real interest rates are very low, for now, if rising ahead.

Our approach to measuring stress is unique in that we examine household cash flow – money in and money out. Given that many households saved hard last year though the heights of COVID, it is not surprising to see many now draining down those savings, by spending more. This means that their cash flow will in net terms be negative for now, and so will register as stressed. That said, if spending continues unabated financial difficulties will eventuate.

In addition we continue to see more households reaching for credit (from Buy Now Pay Later, to Pay Day loans) as well as equity release from property. In fact the latest hikes in perceived values has led to a run of refinancing, to try and pay down debt, or to provide funds to offspring for property purchase via the Bank of Mum and Dad. Again these one-off moves can adversely impact household stress measures in our methodology.

And we also note that many prefer not to accept the truth that some households are not home and clear in terms of their finances, given the uncertain part-time work, multiple jobs and zero hours contracts which many are on. But we continue to analyze households in net cash flow terms. If more funds drain away, compared with income, they are classified as stressed.

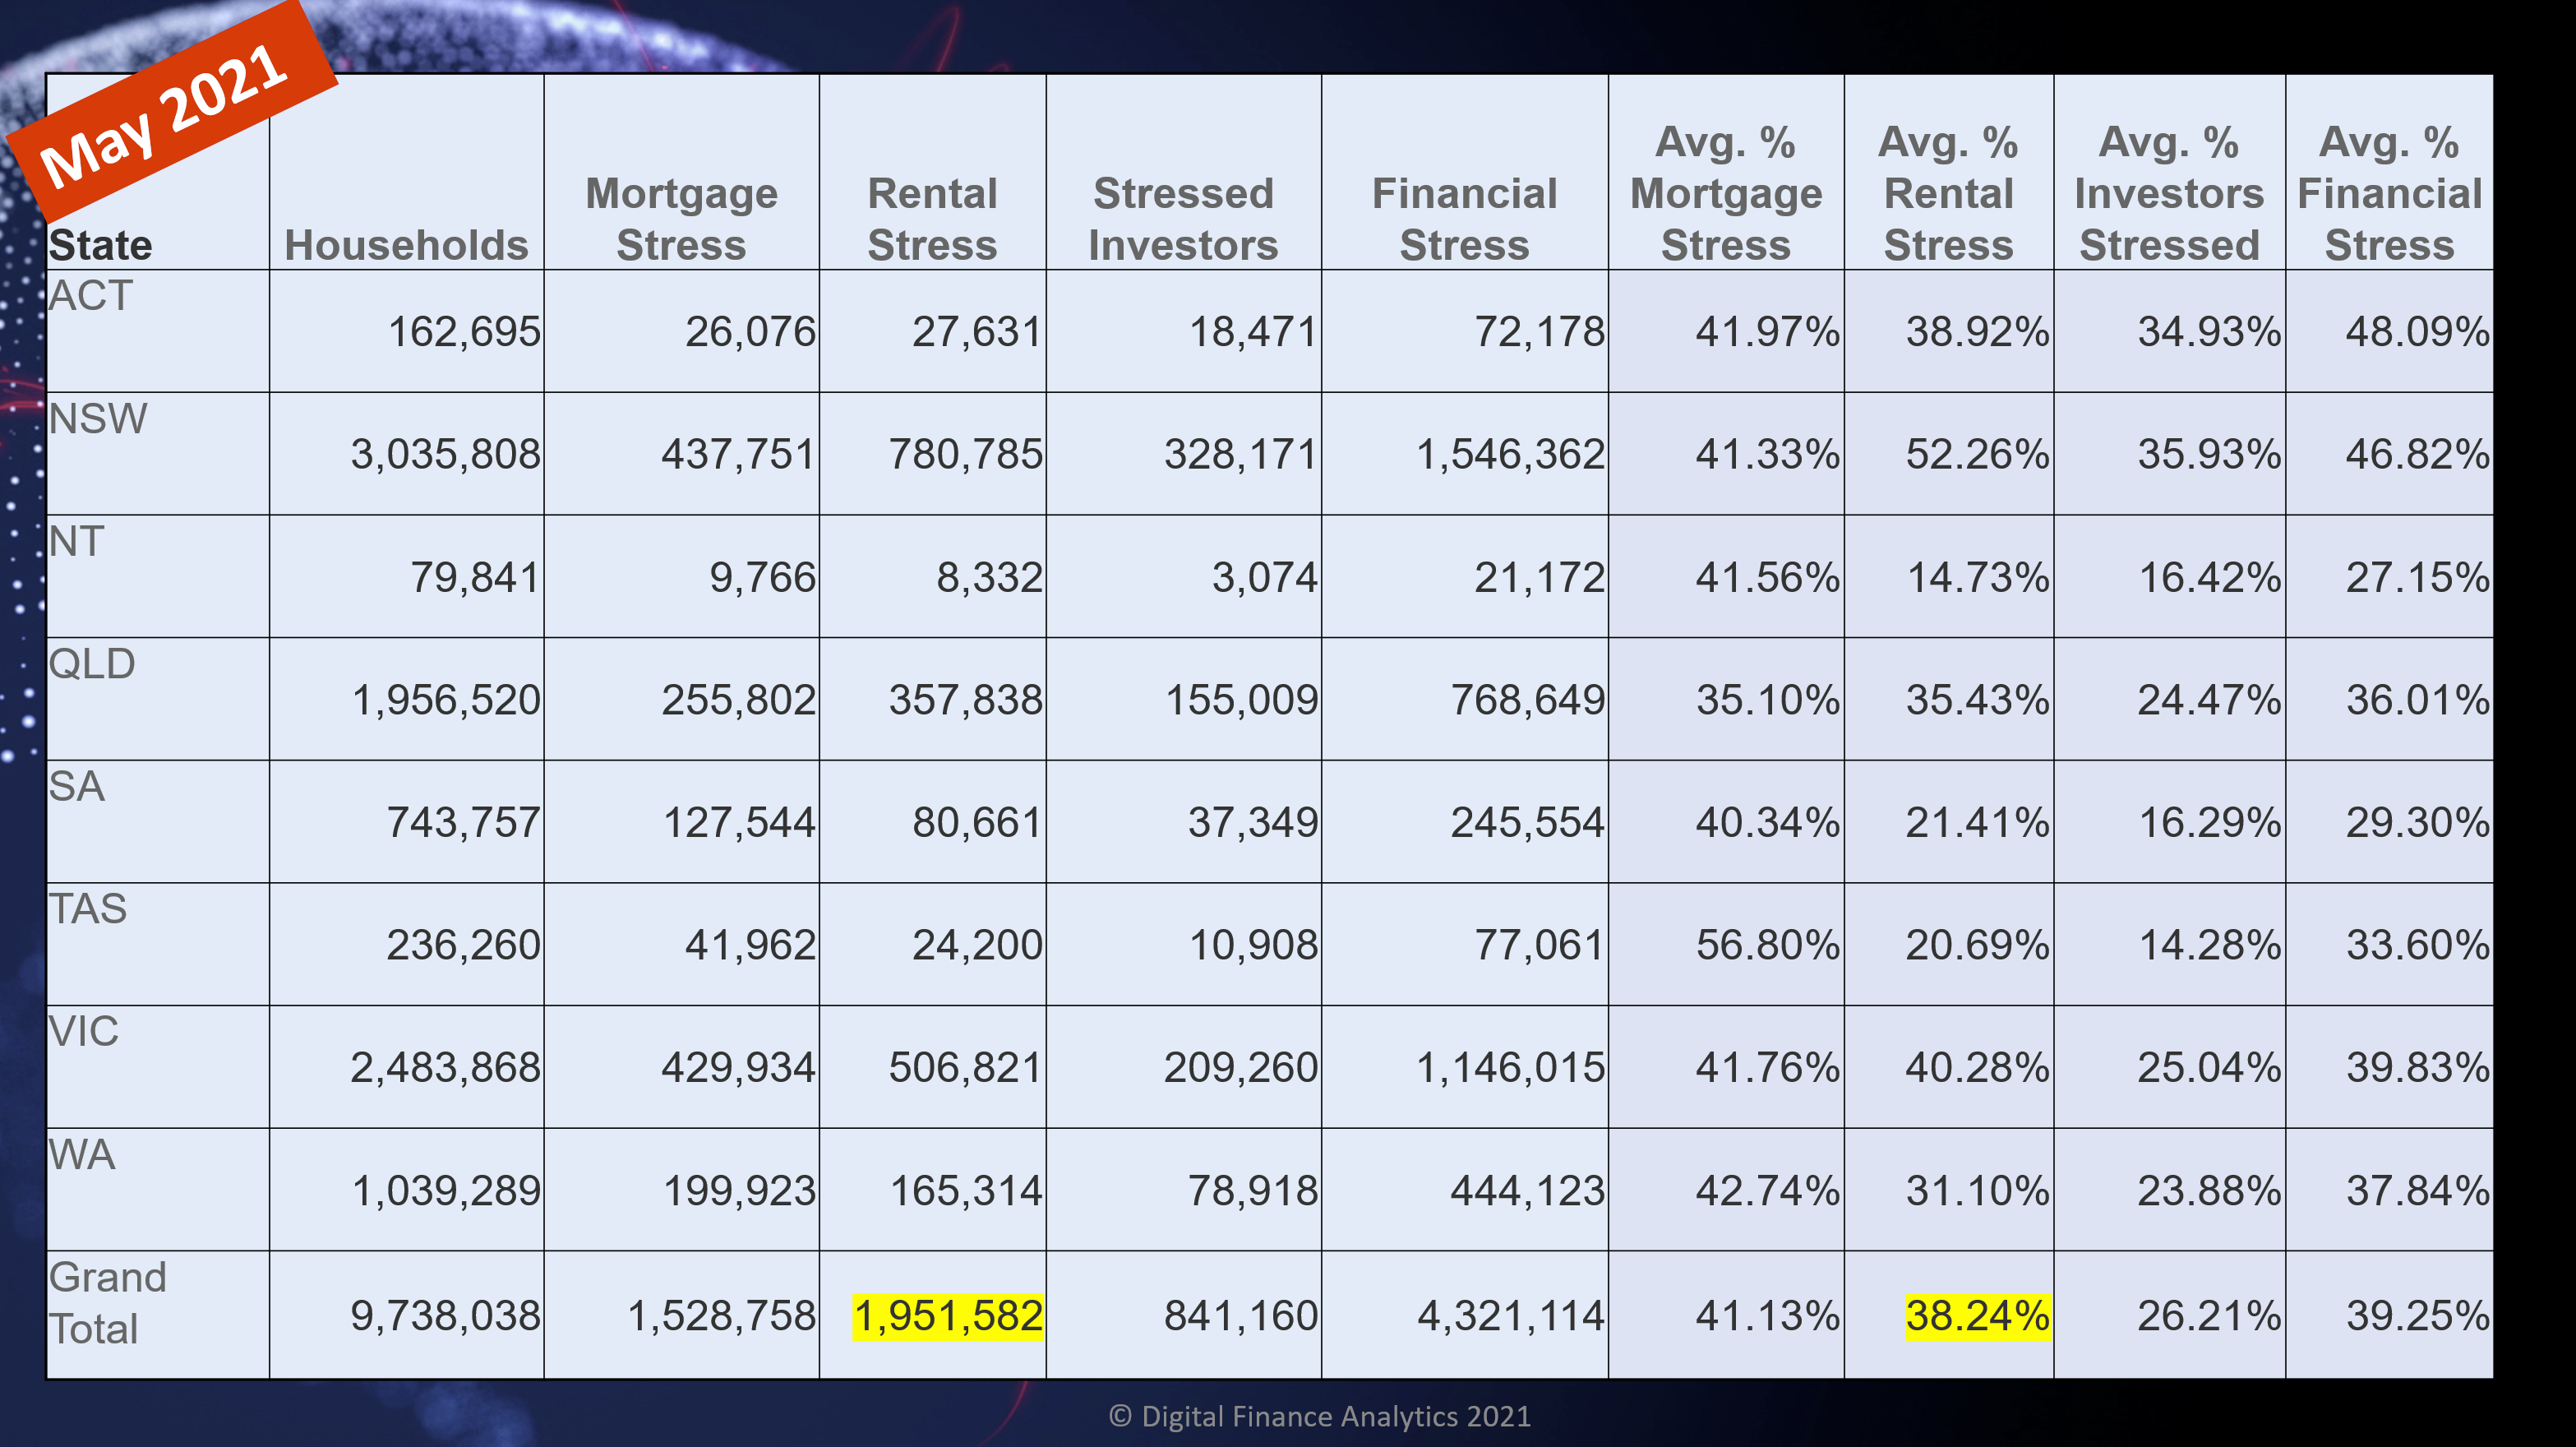
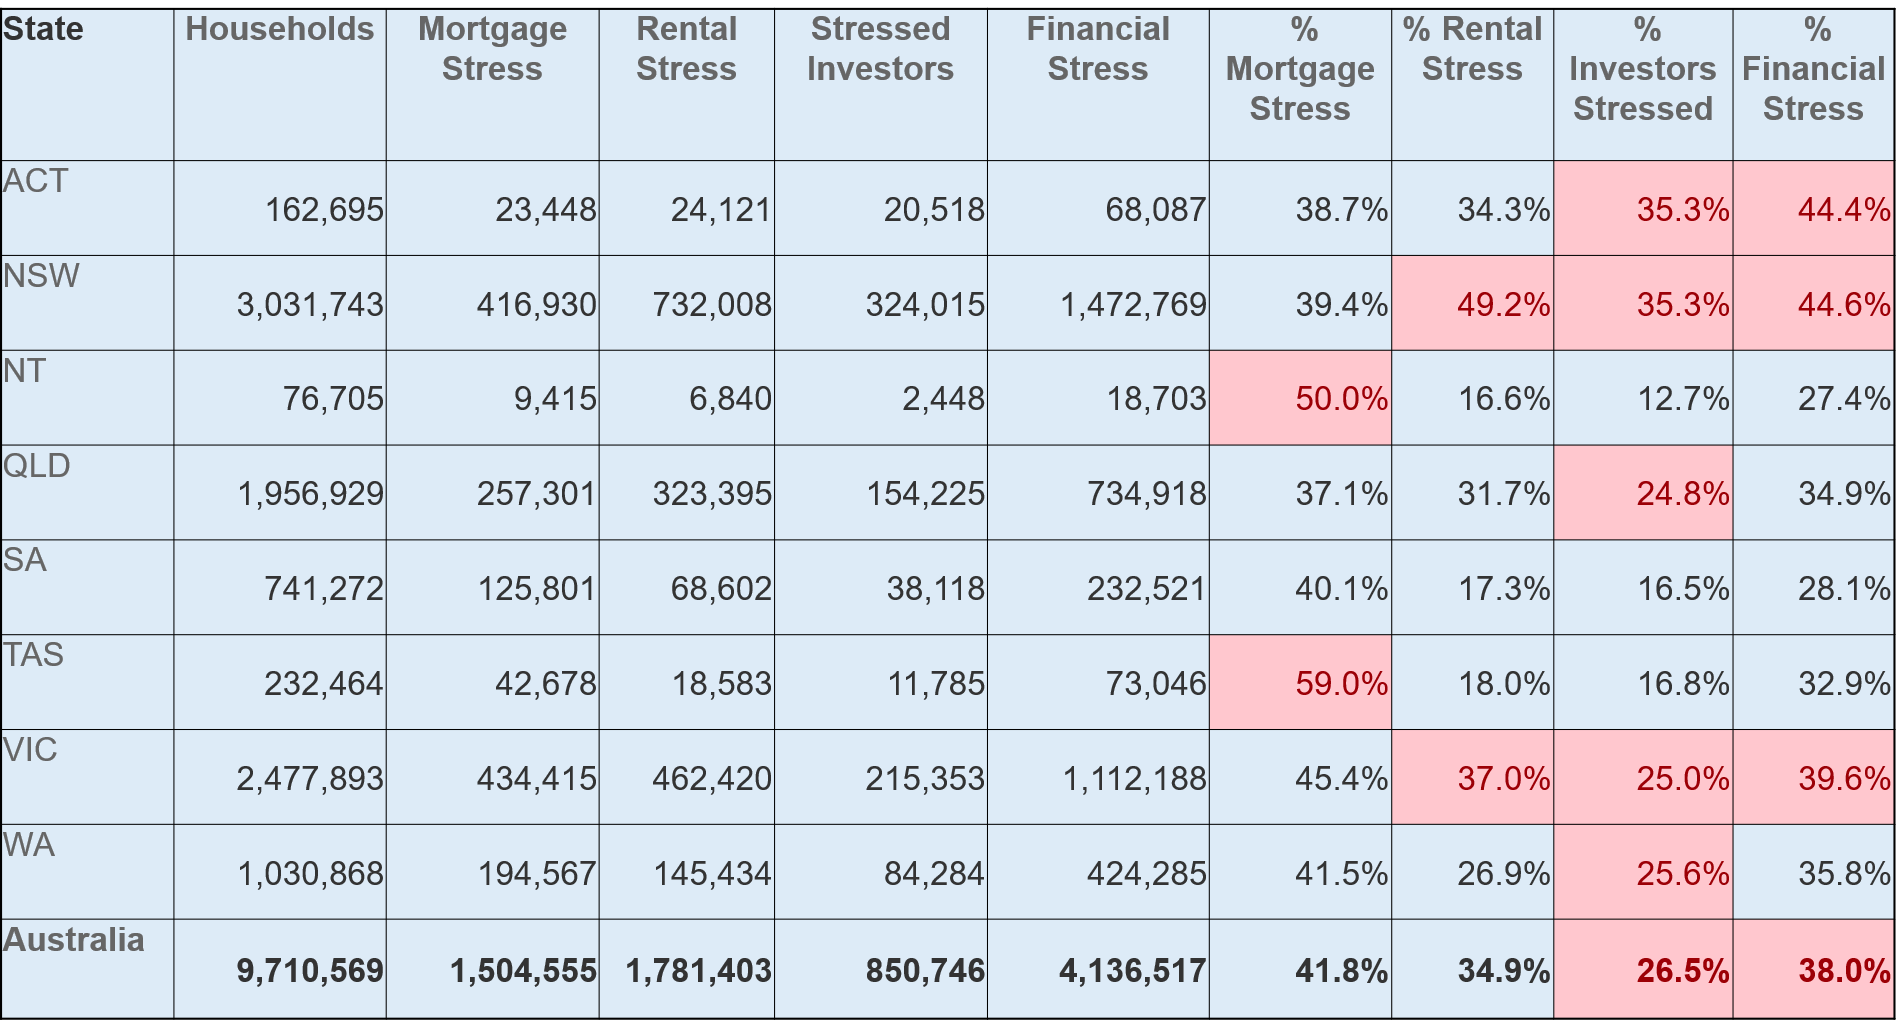
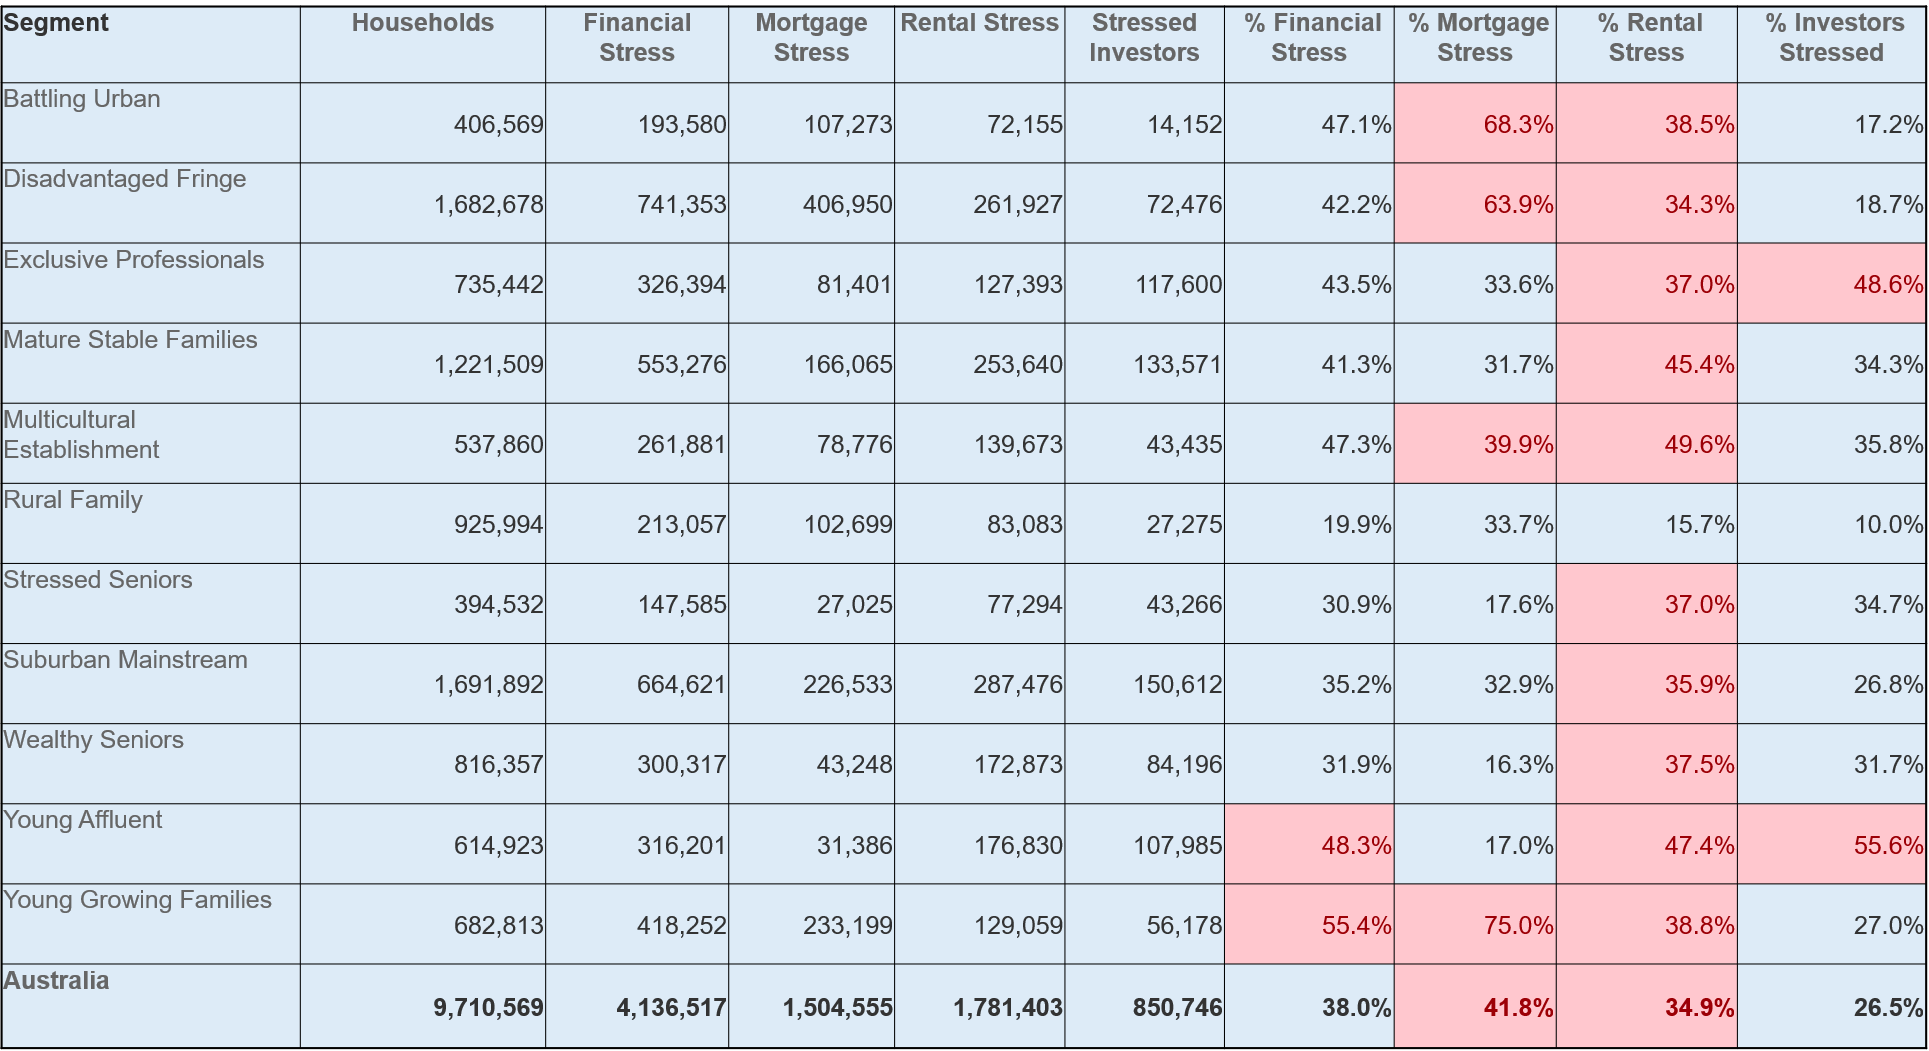
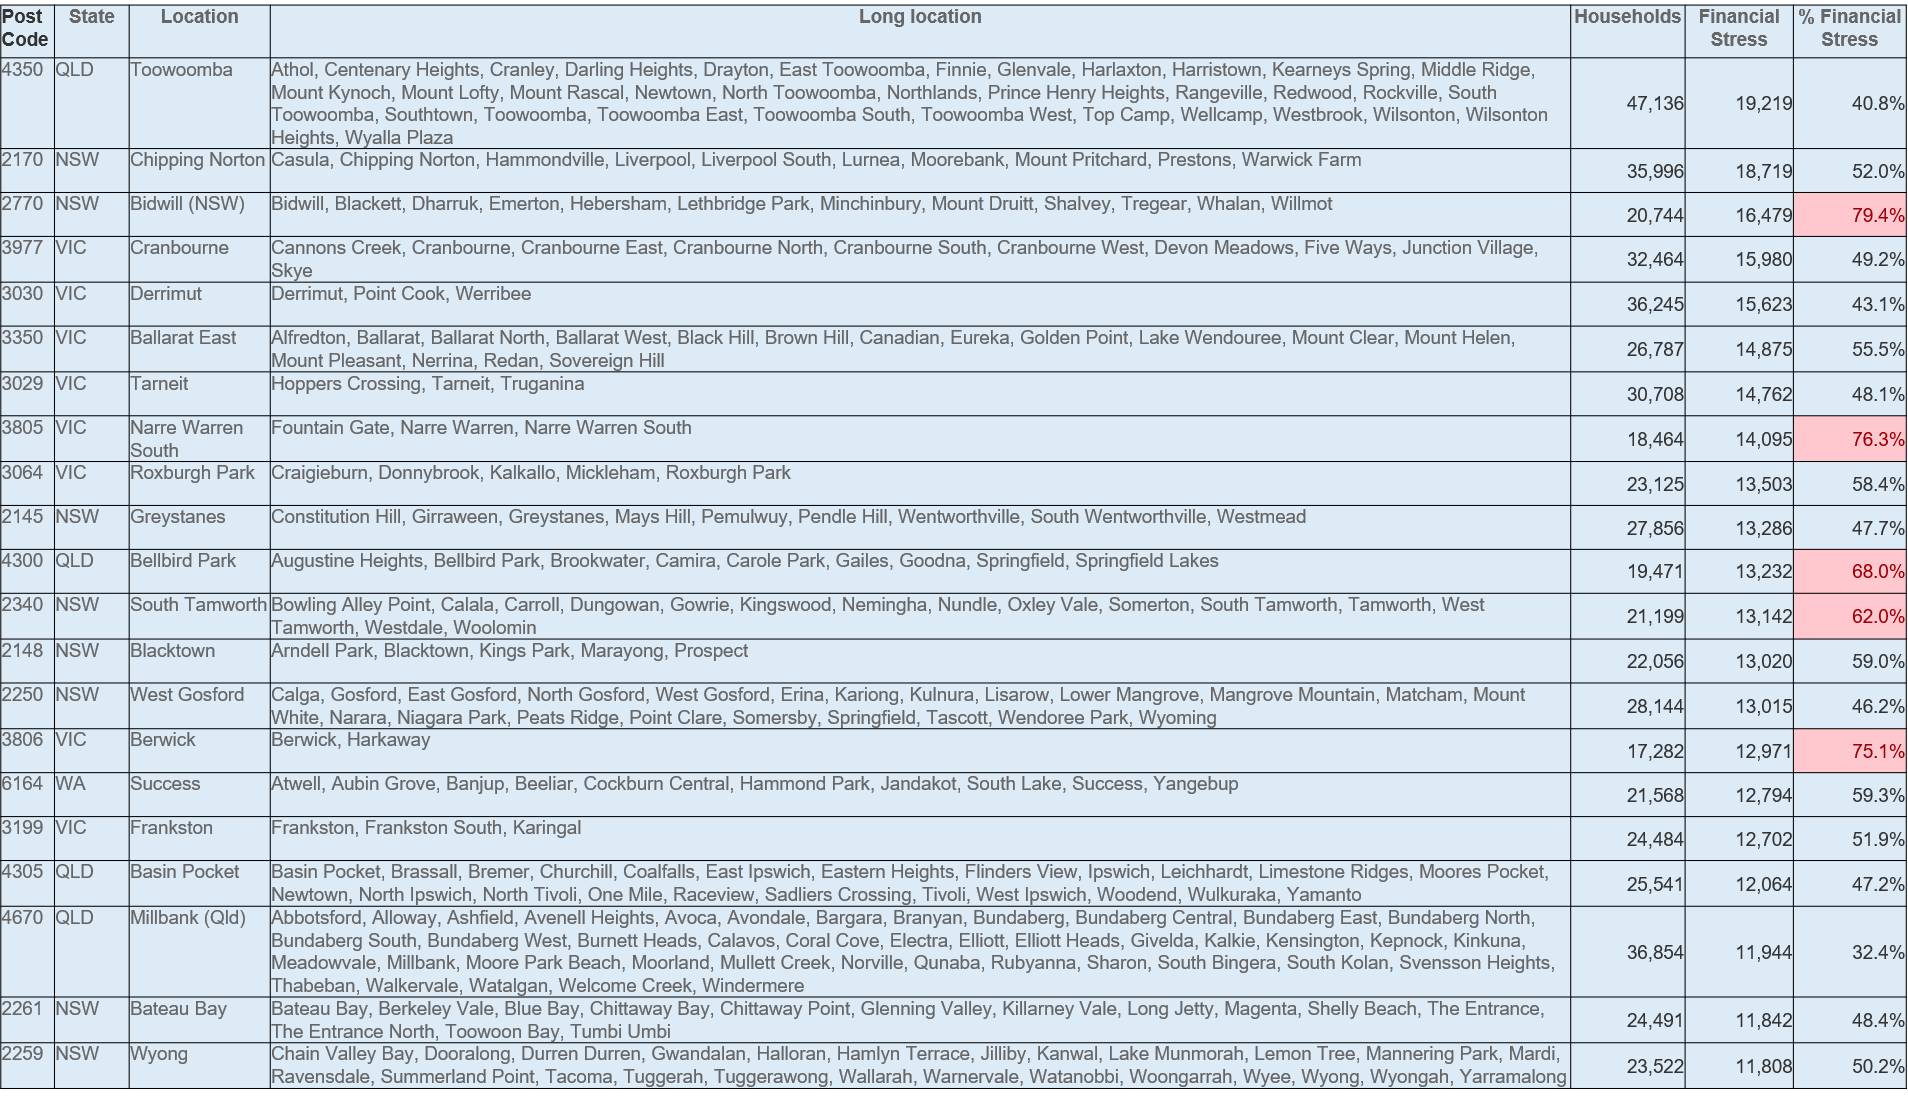
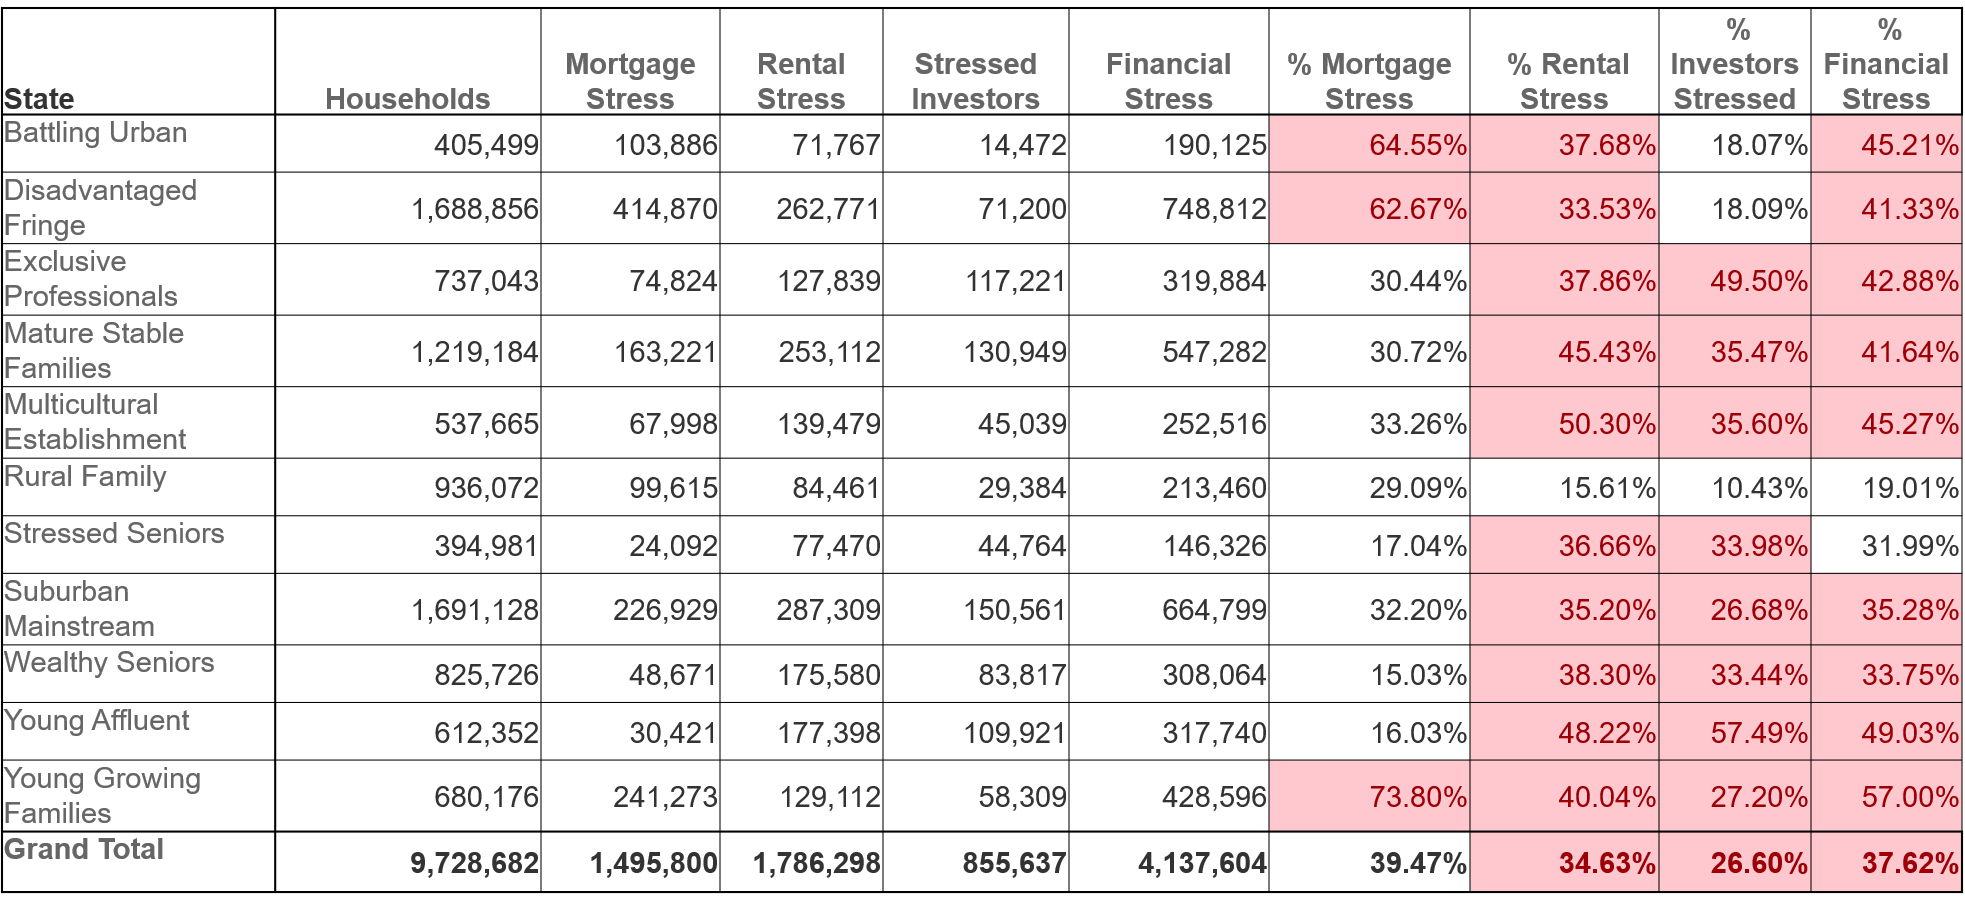
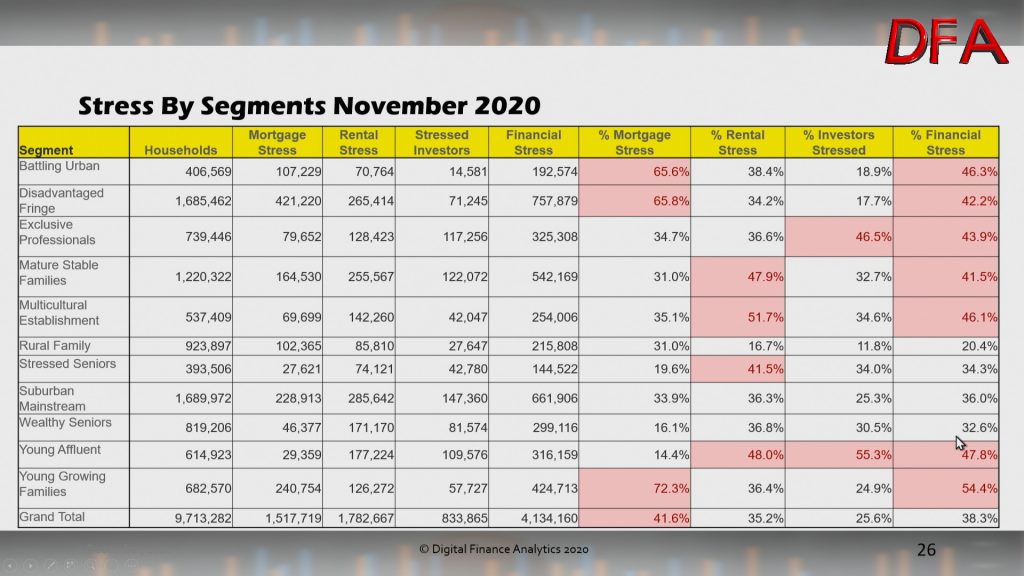
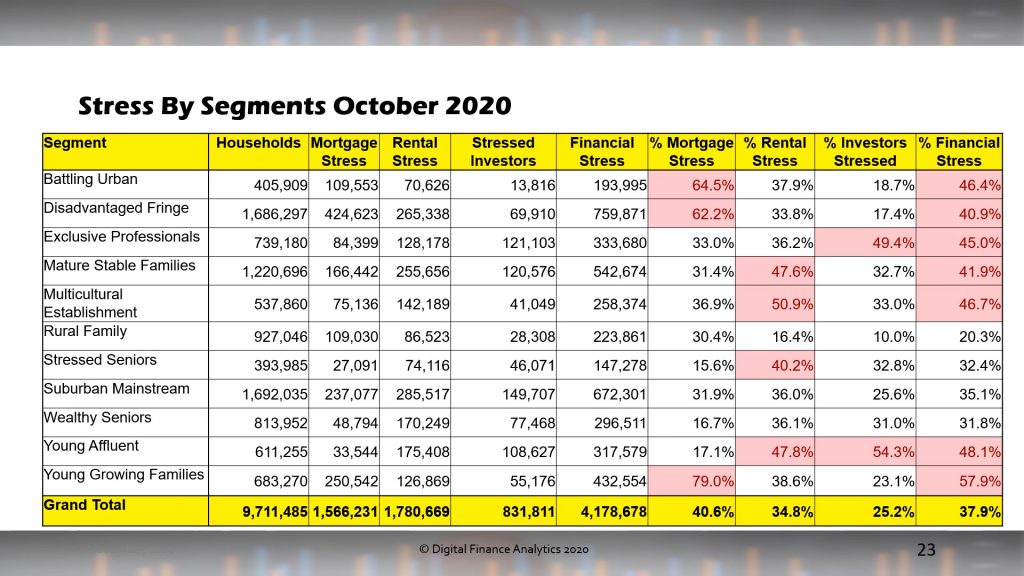
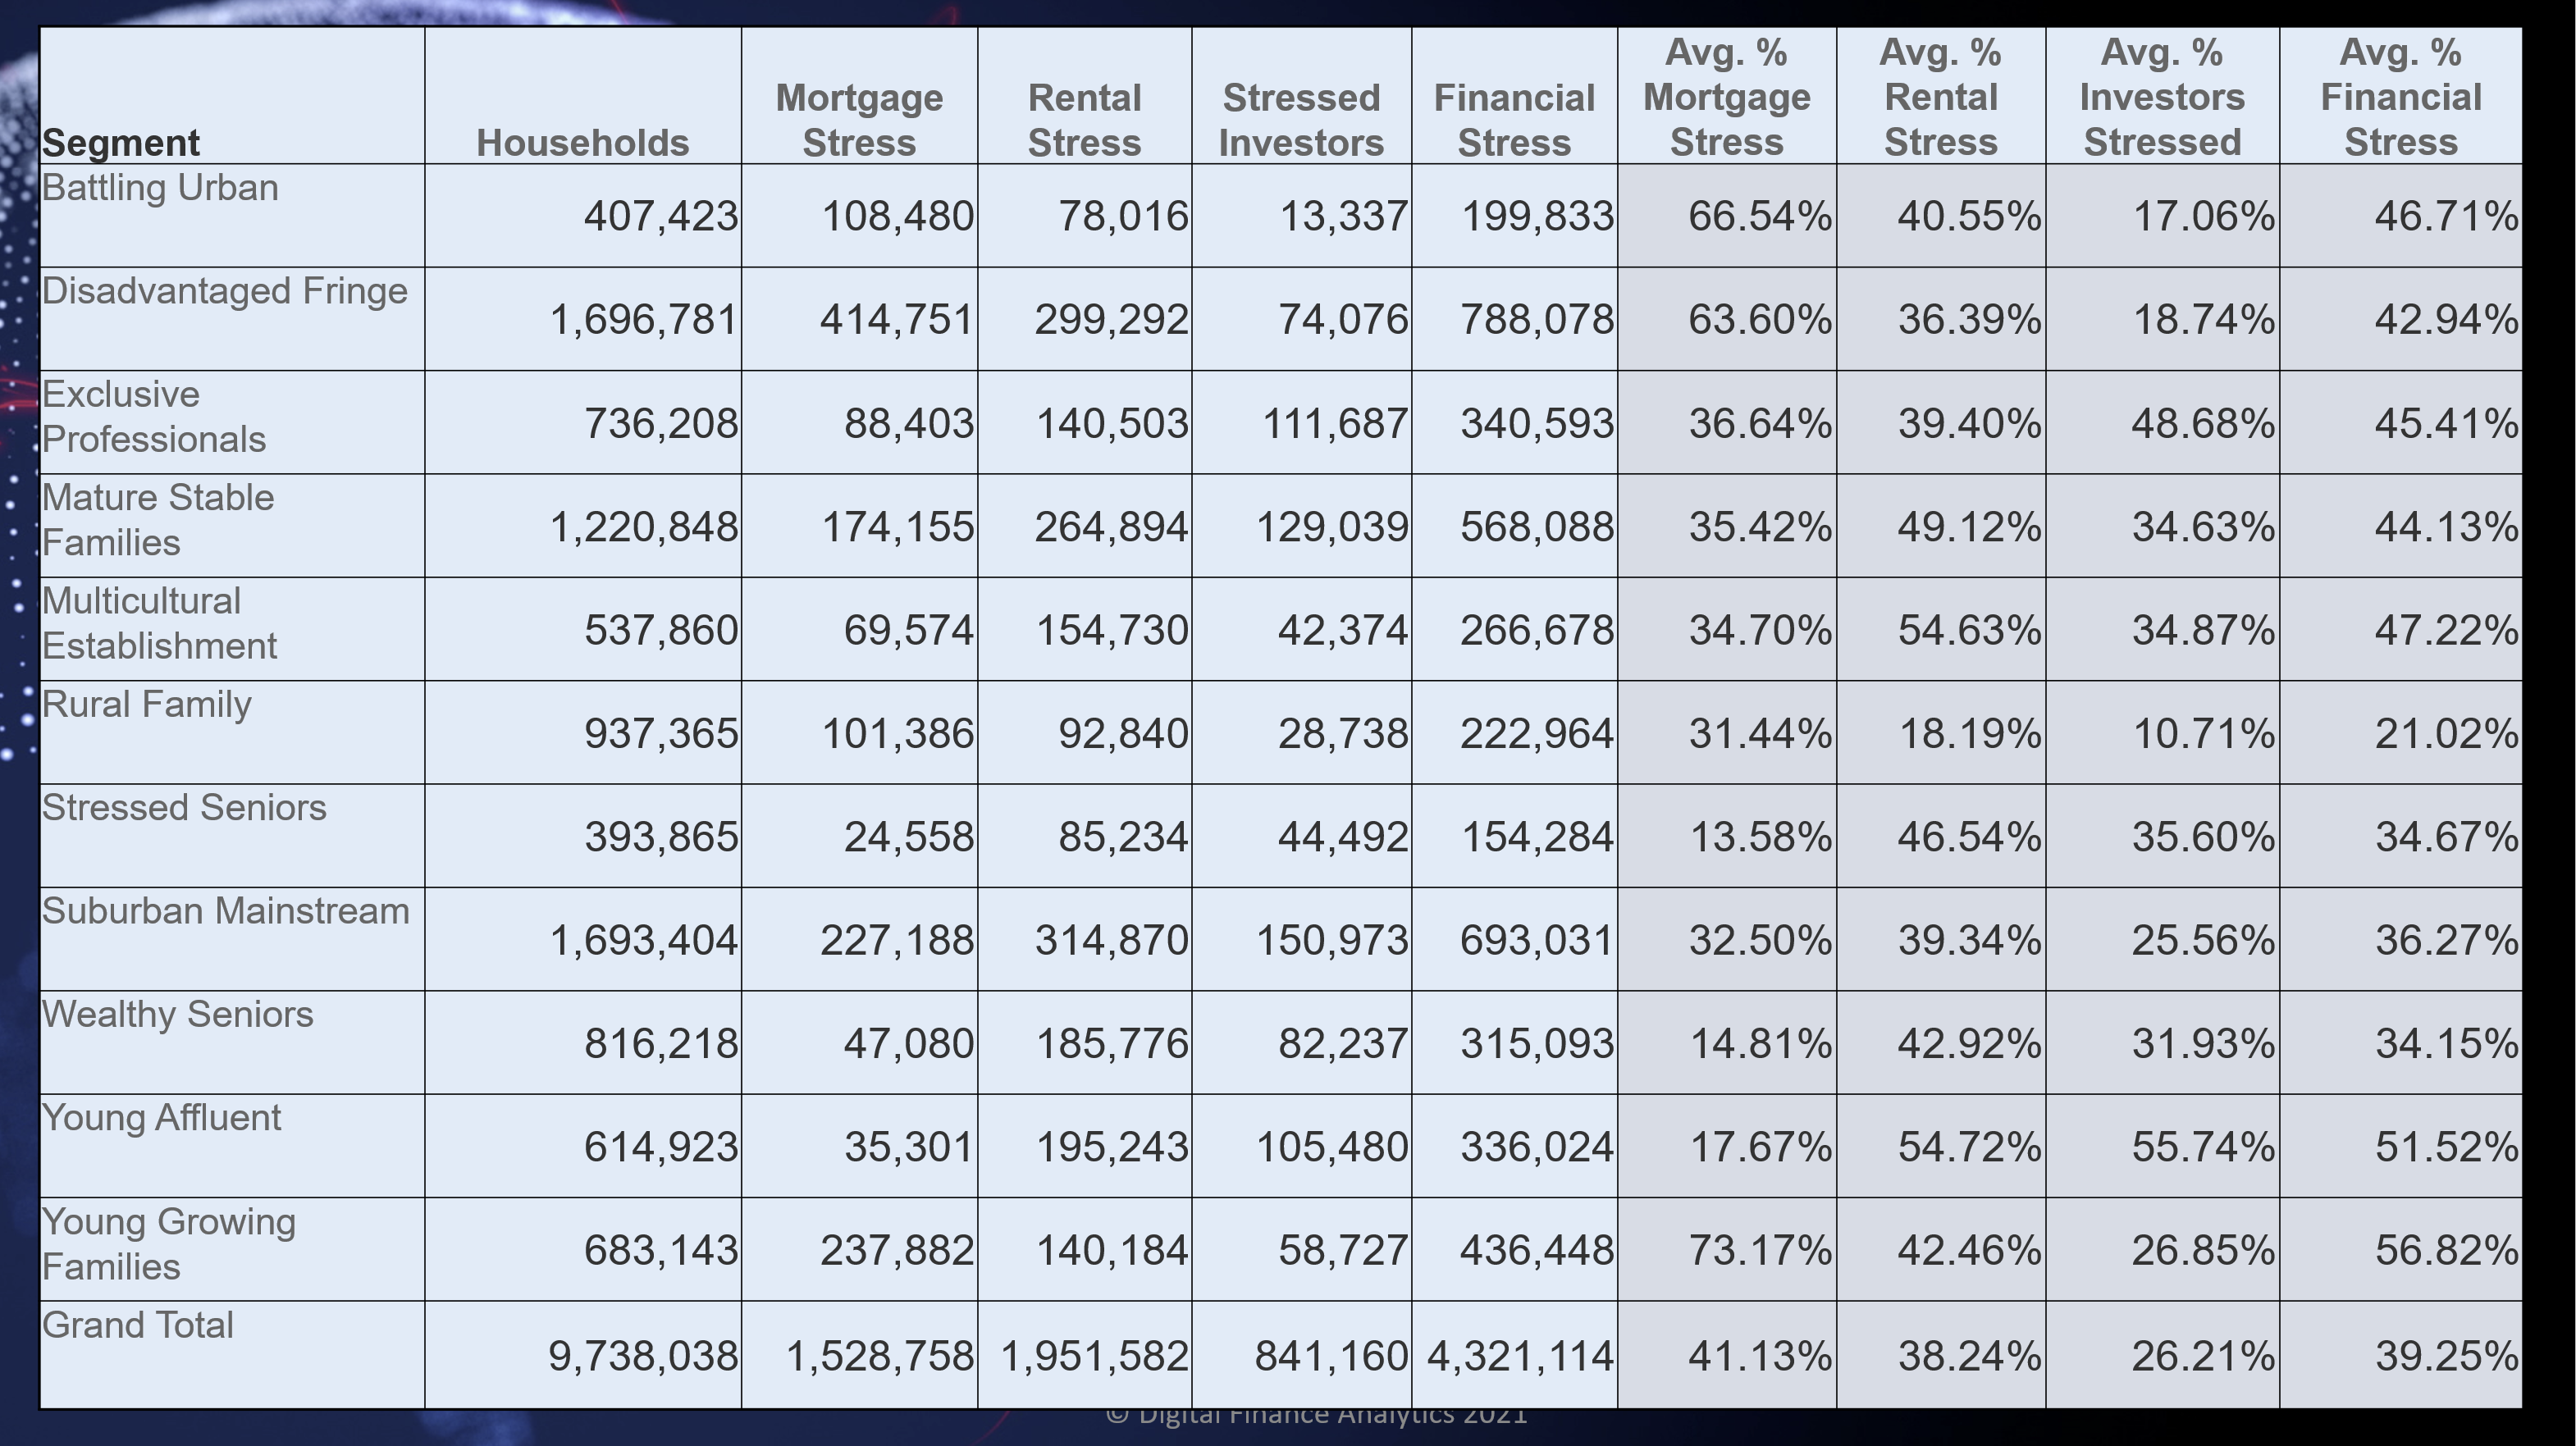
Across our segments we continue to see quite different dynamics emerging, with many younger households (often first time buyers) impacted, alongside the high growth corridors containing many first generation Australians, as well as some more affluent groups. Financial Stress takes no prisoners.

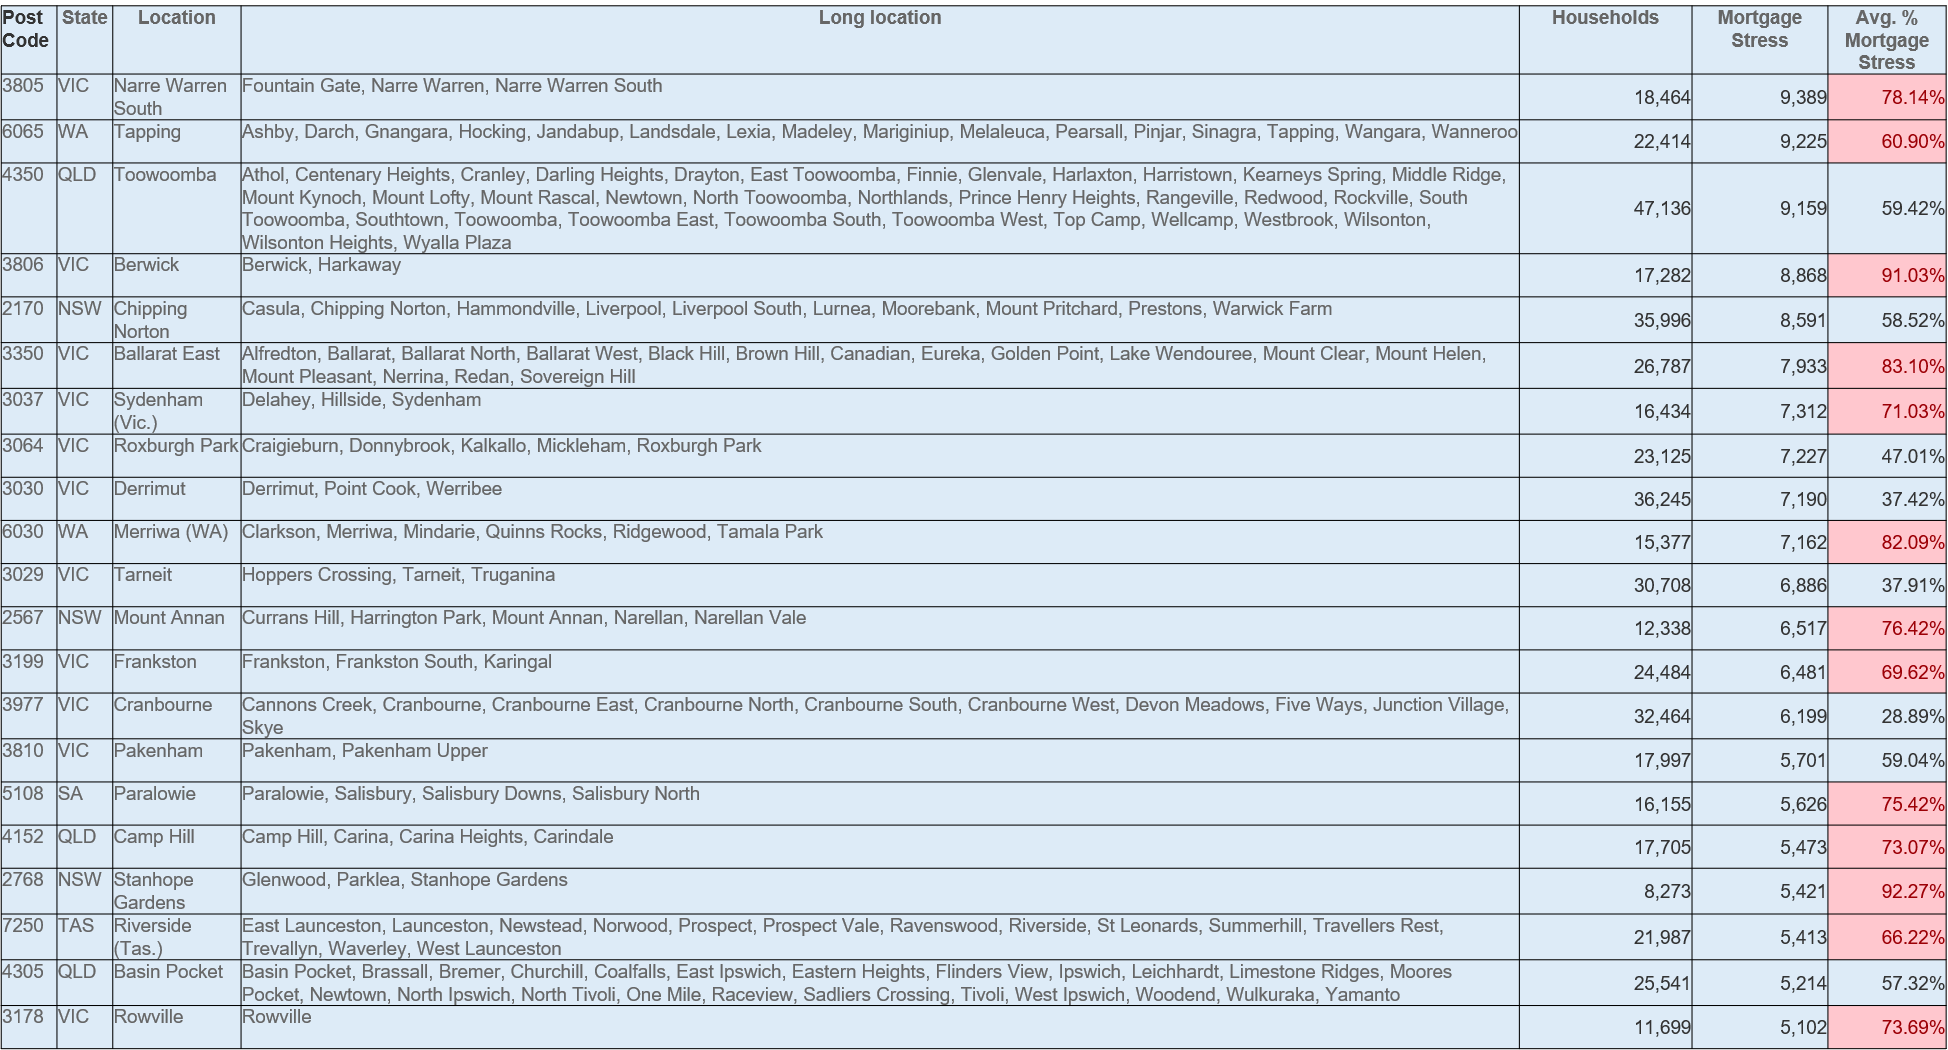
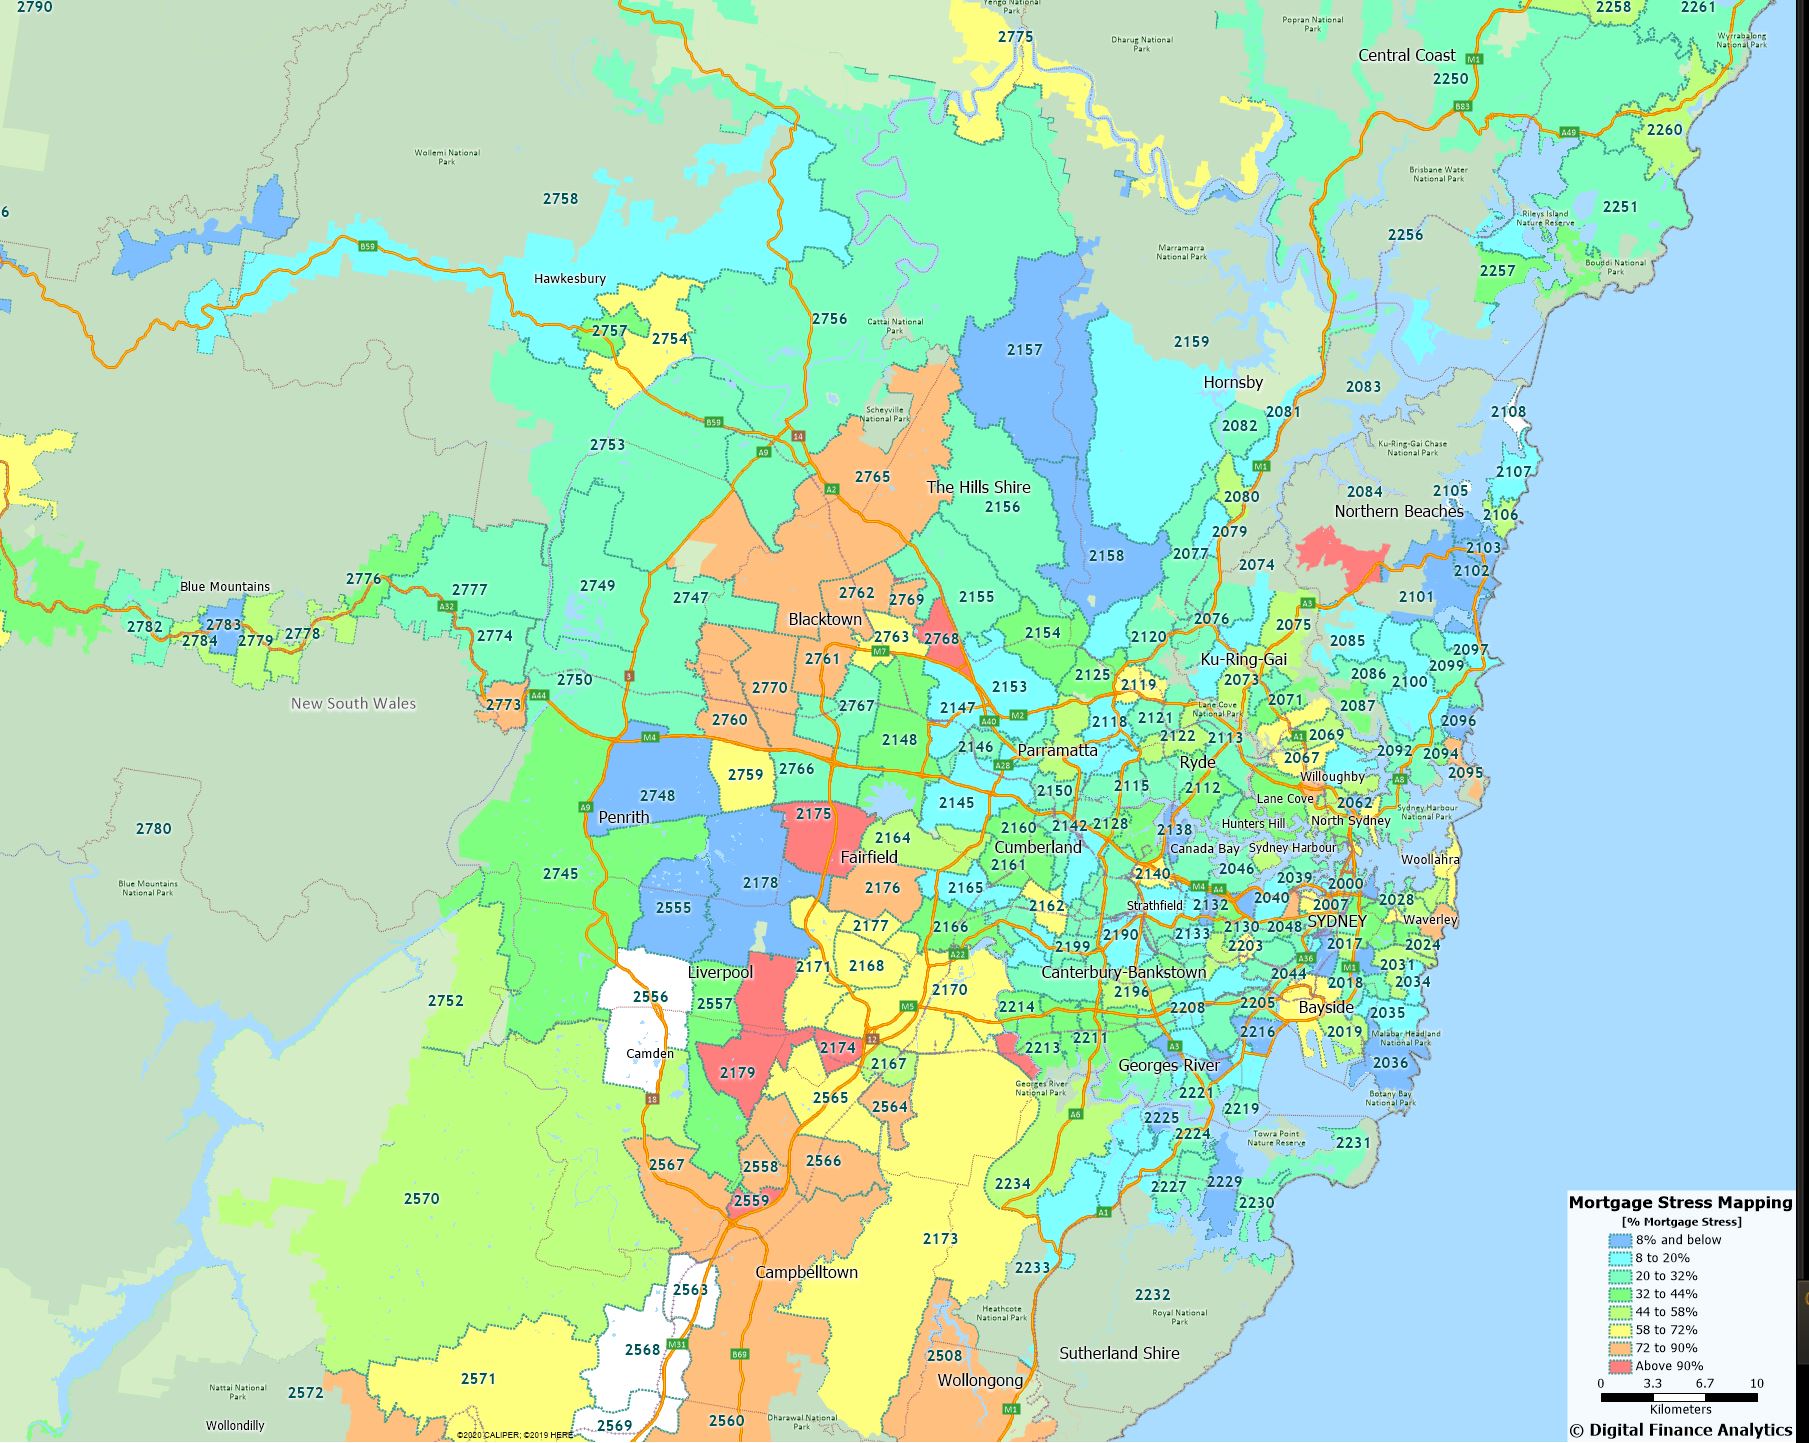
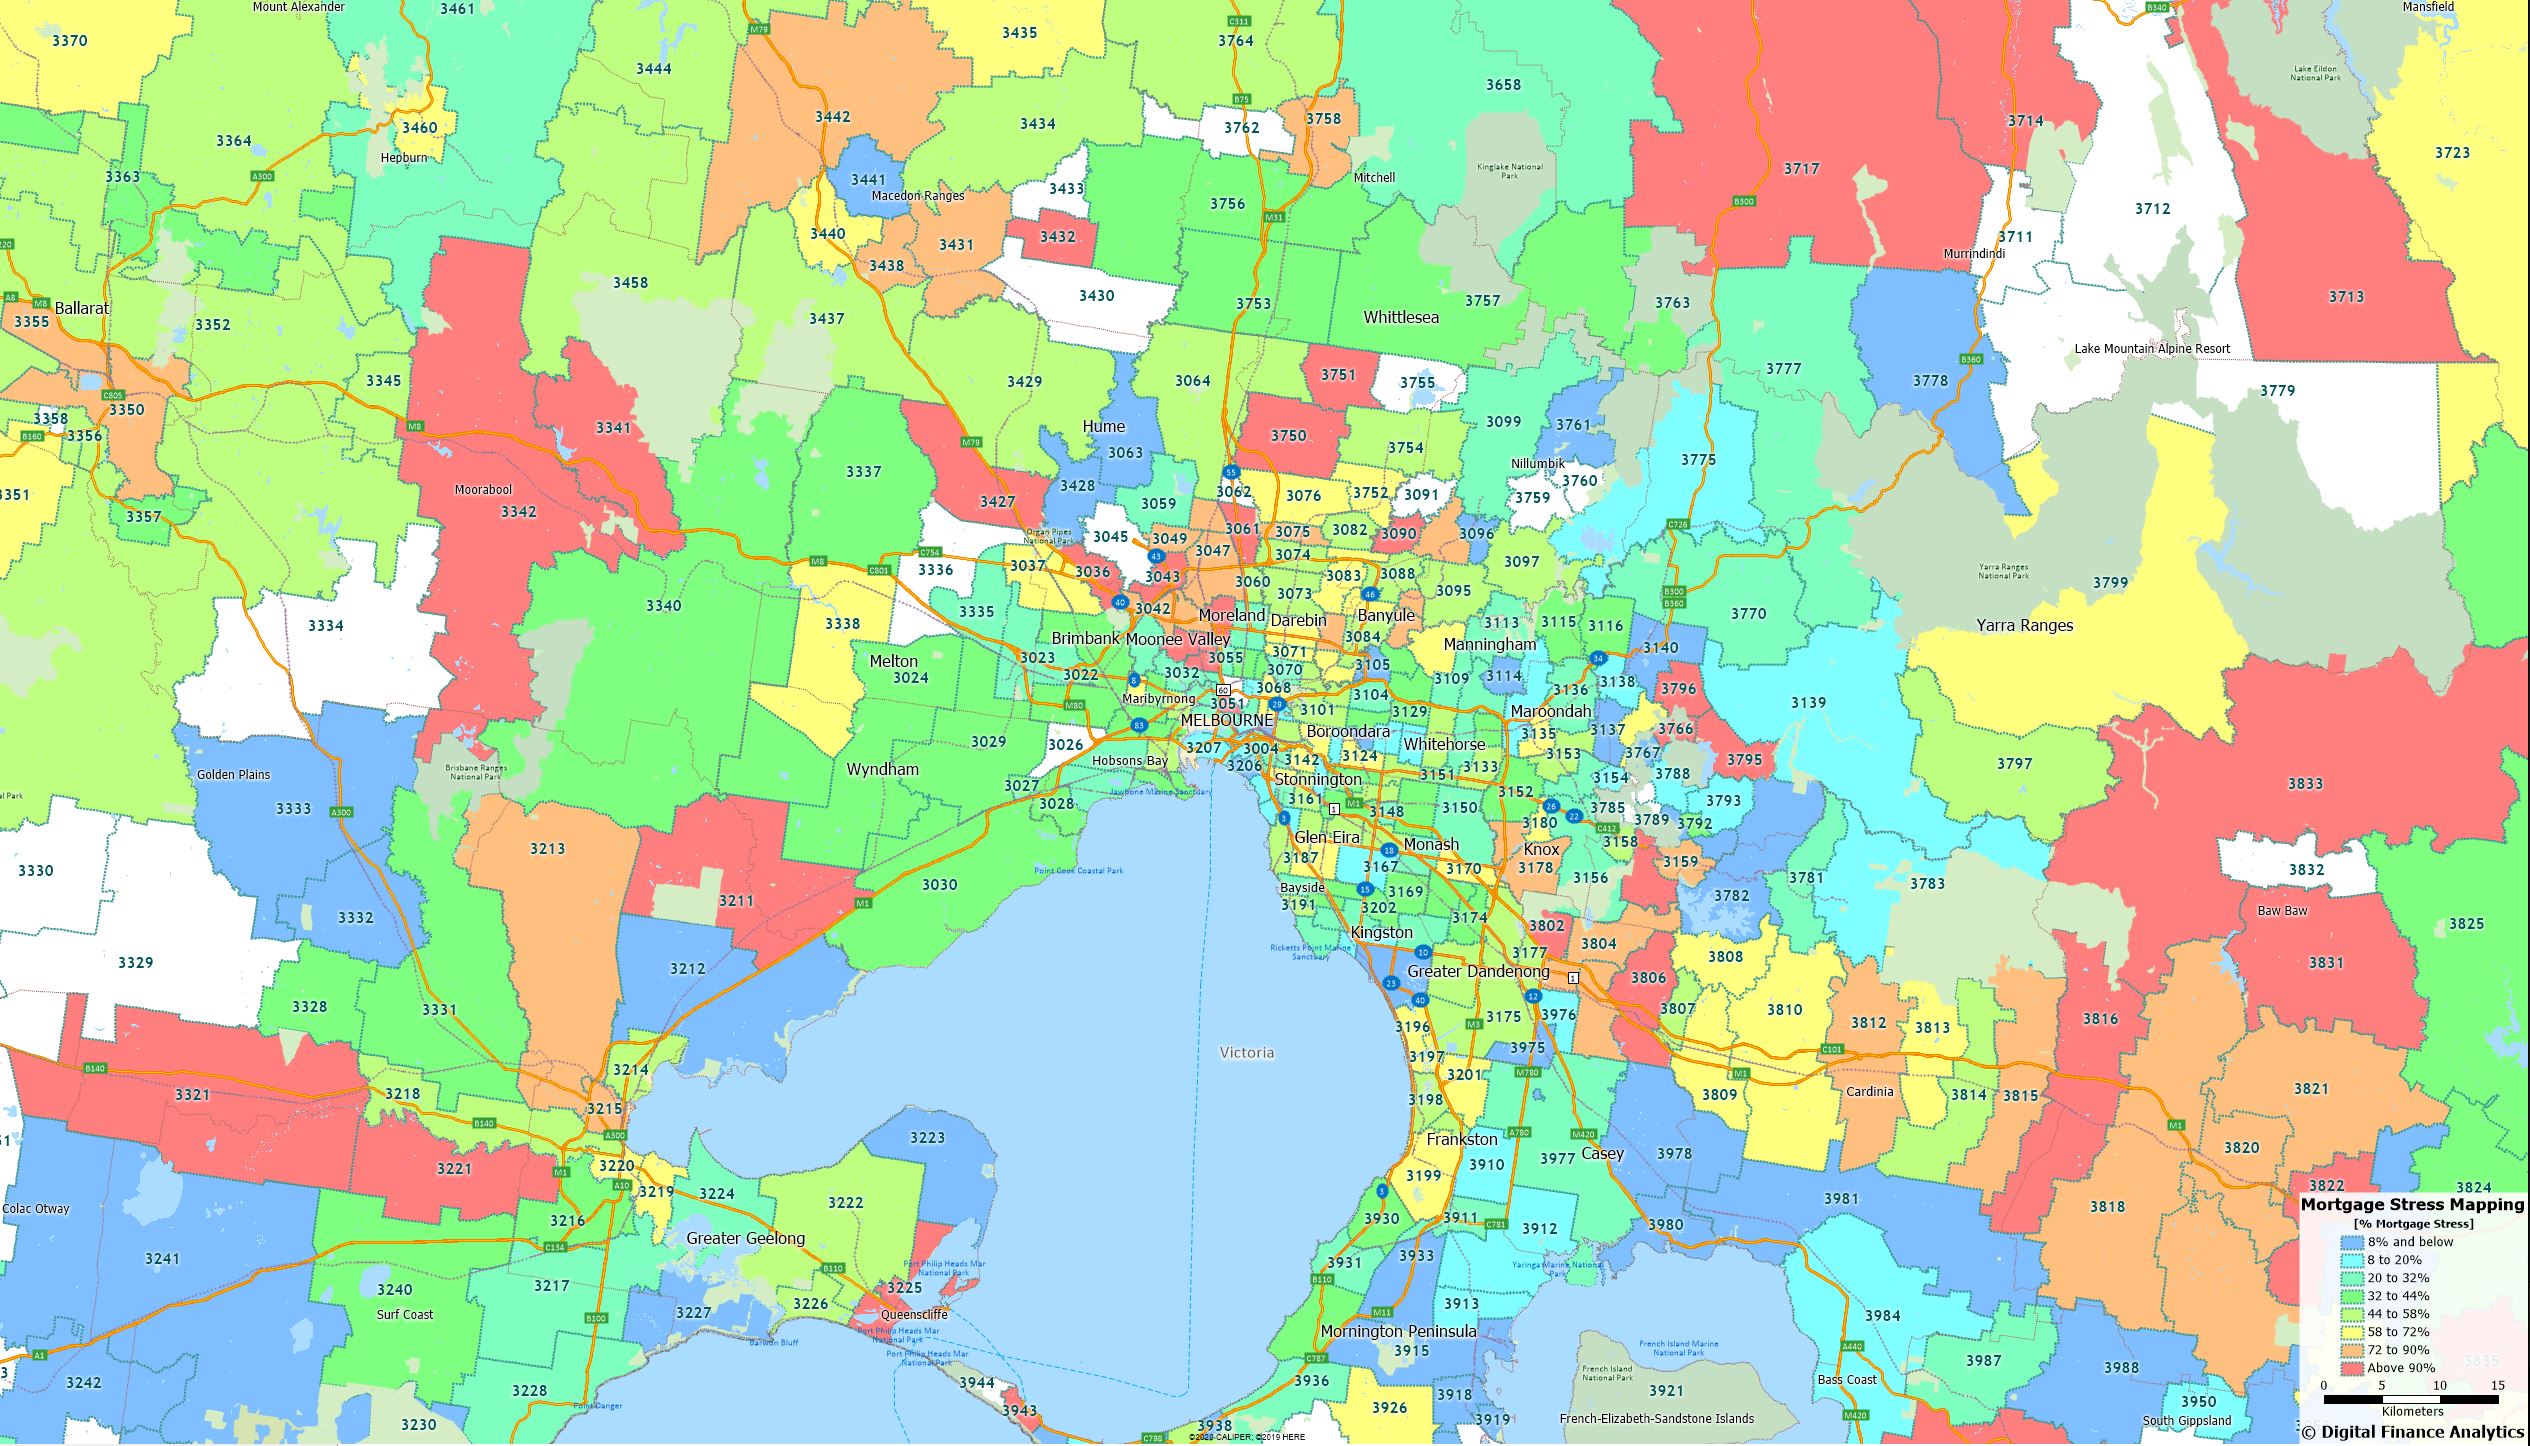
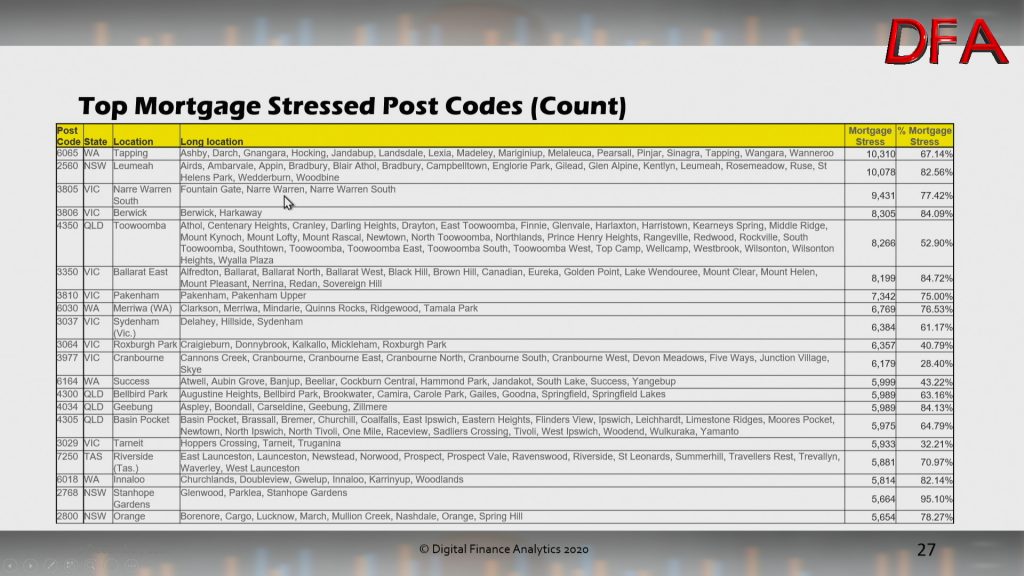
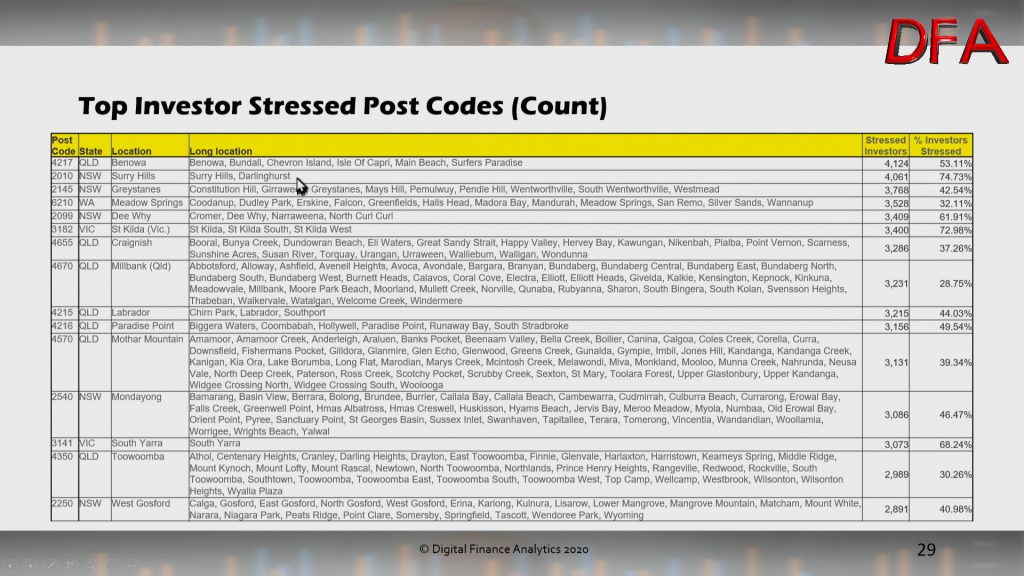
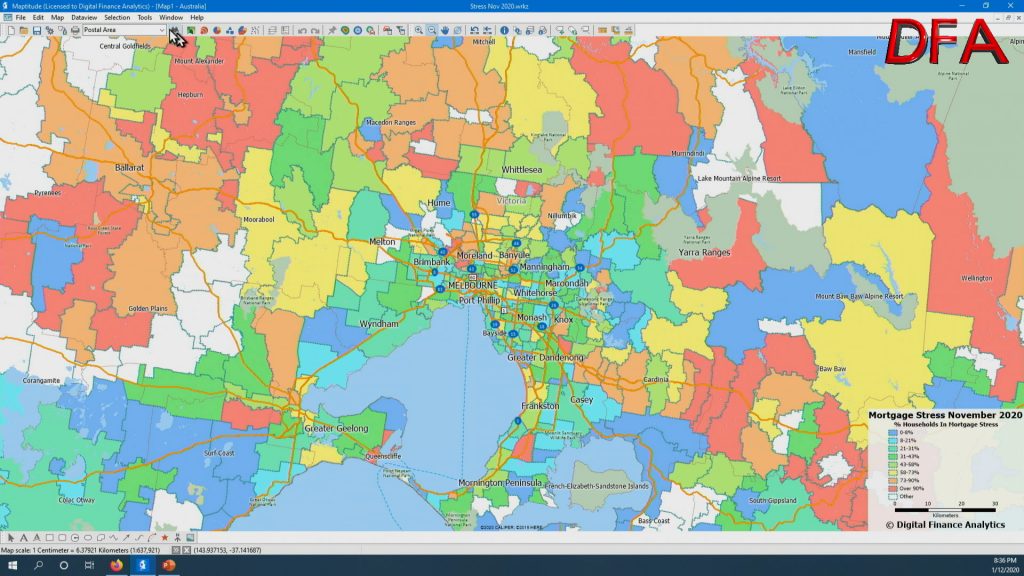
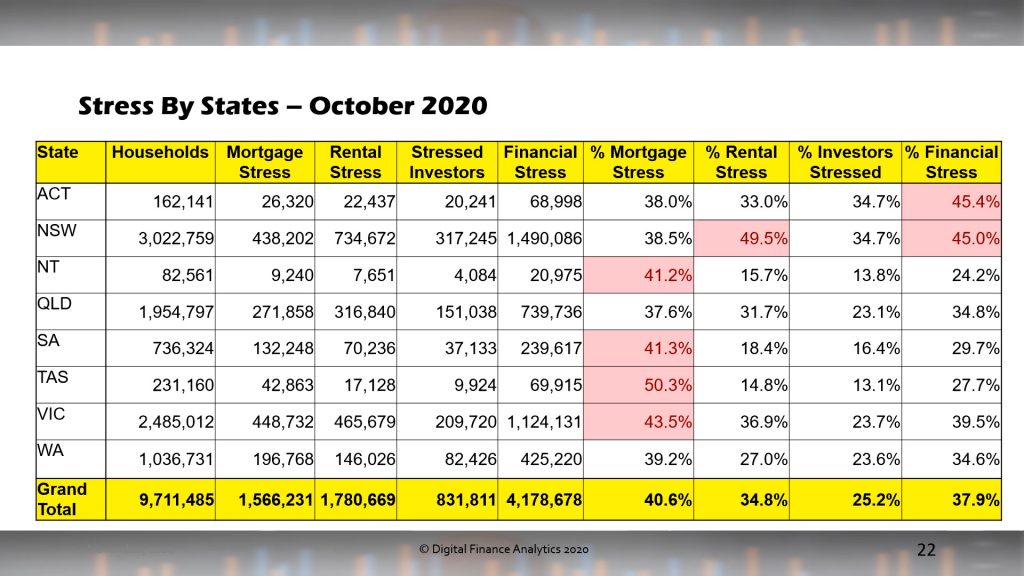
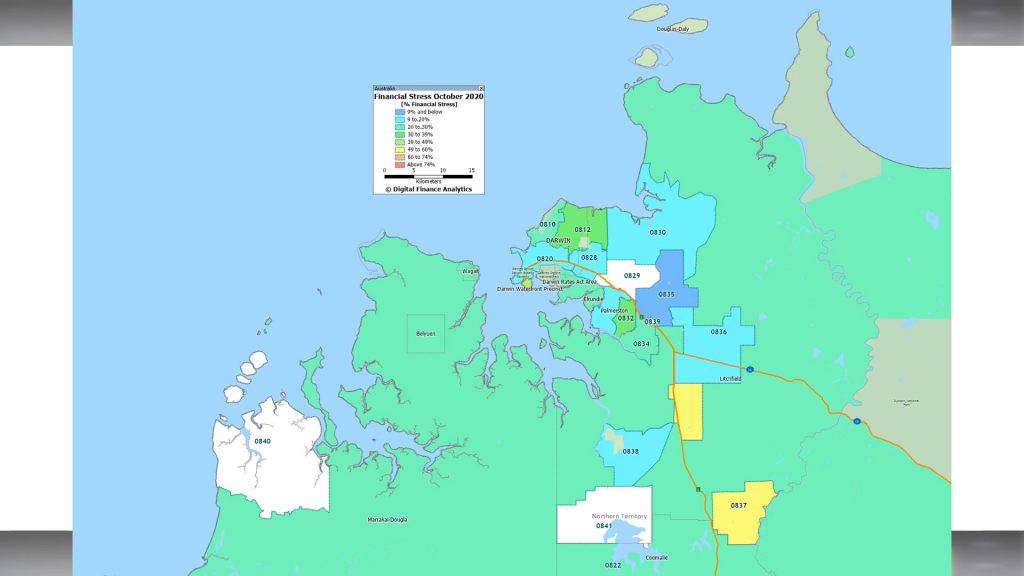
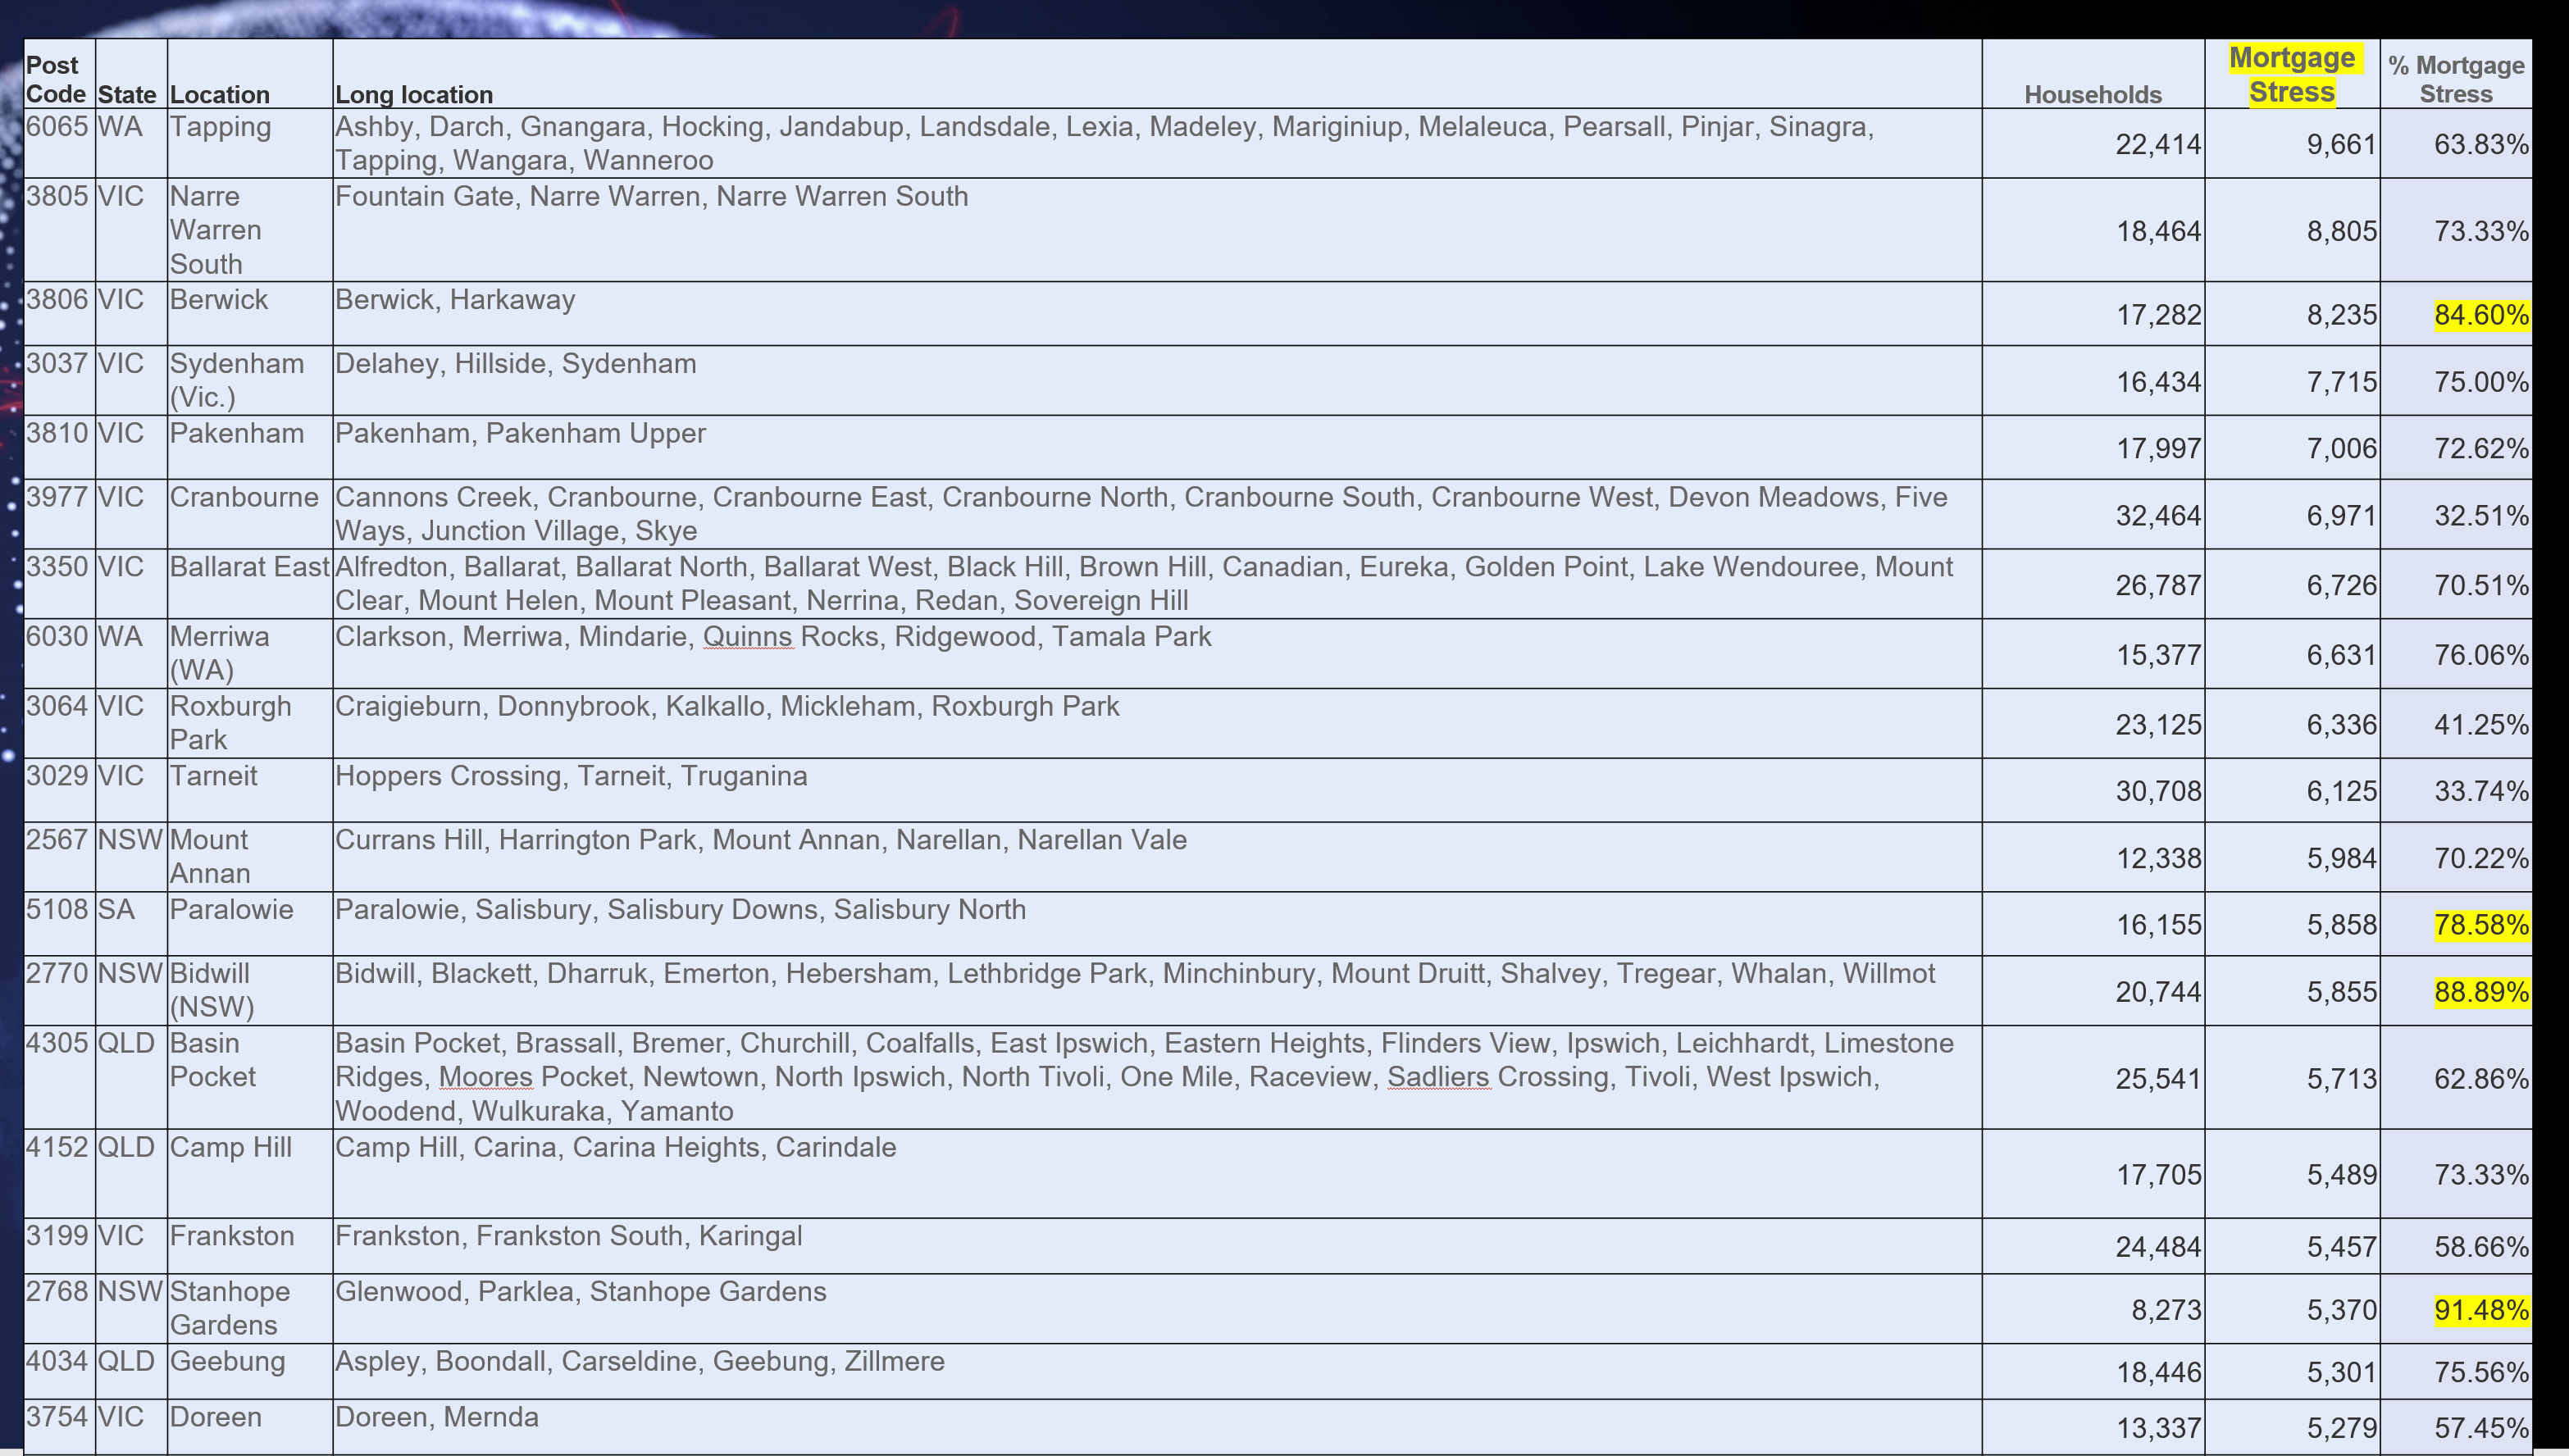
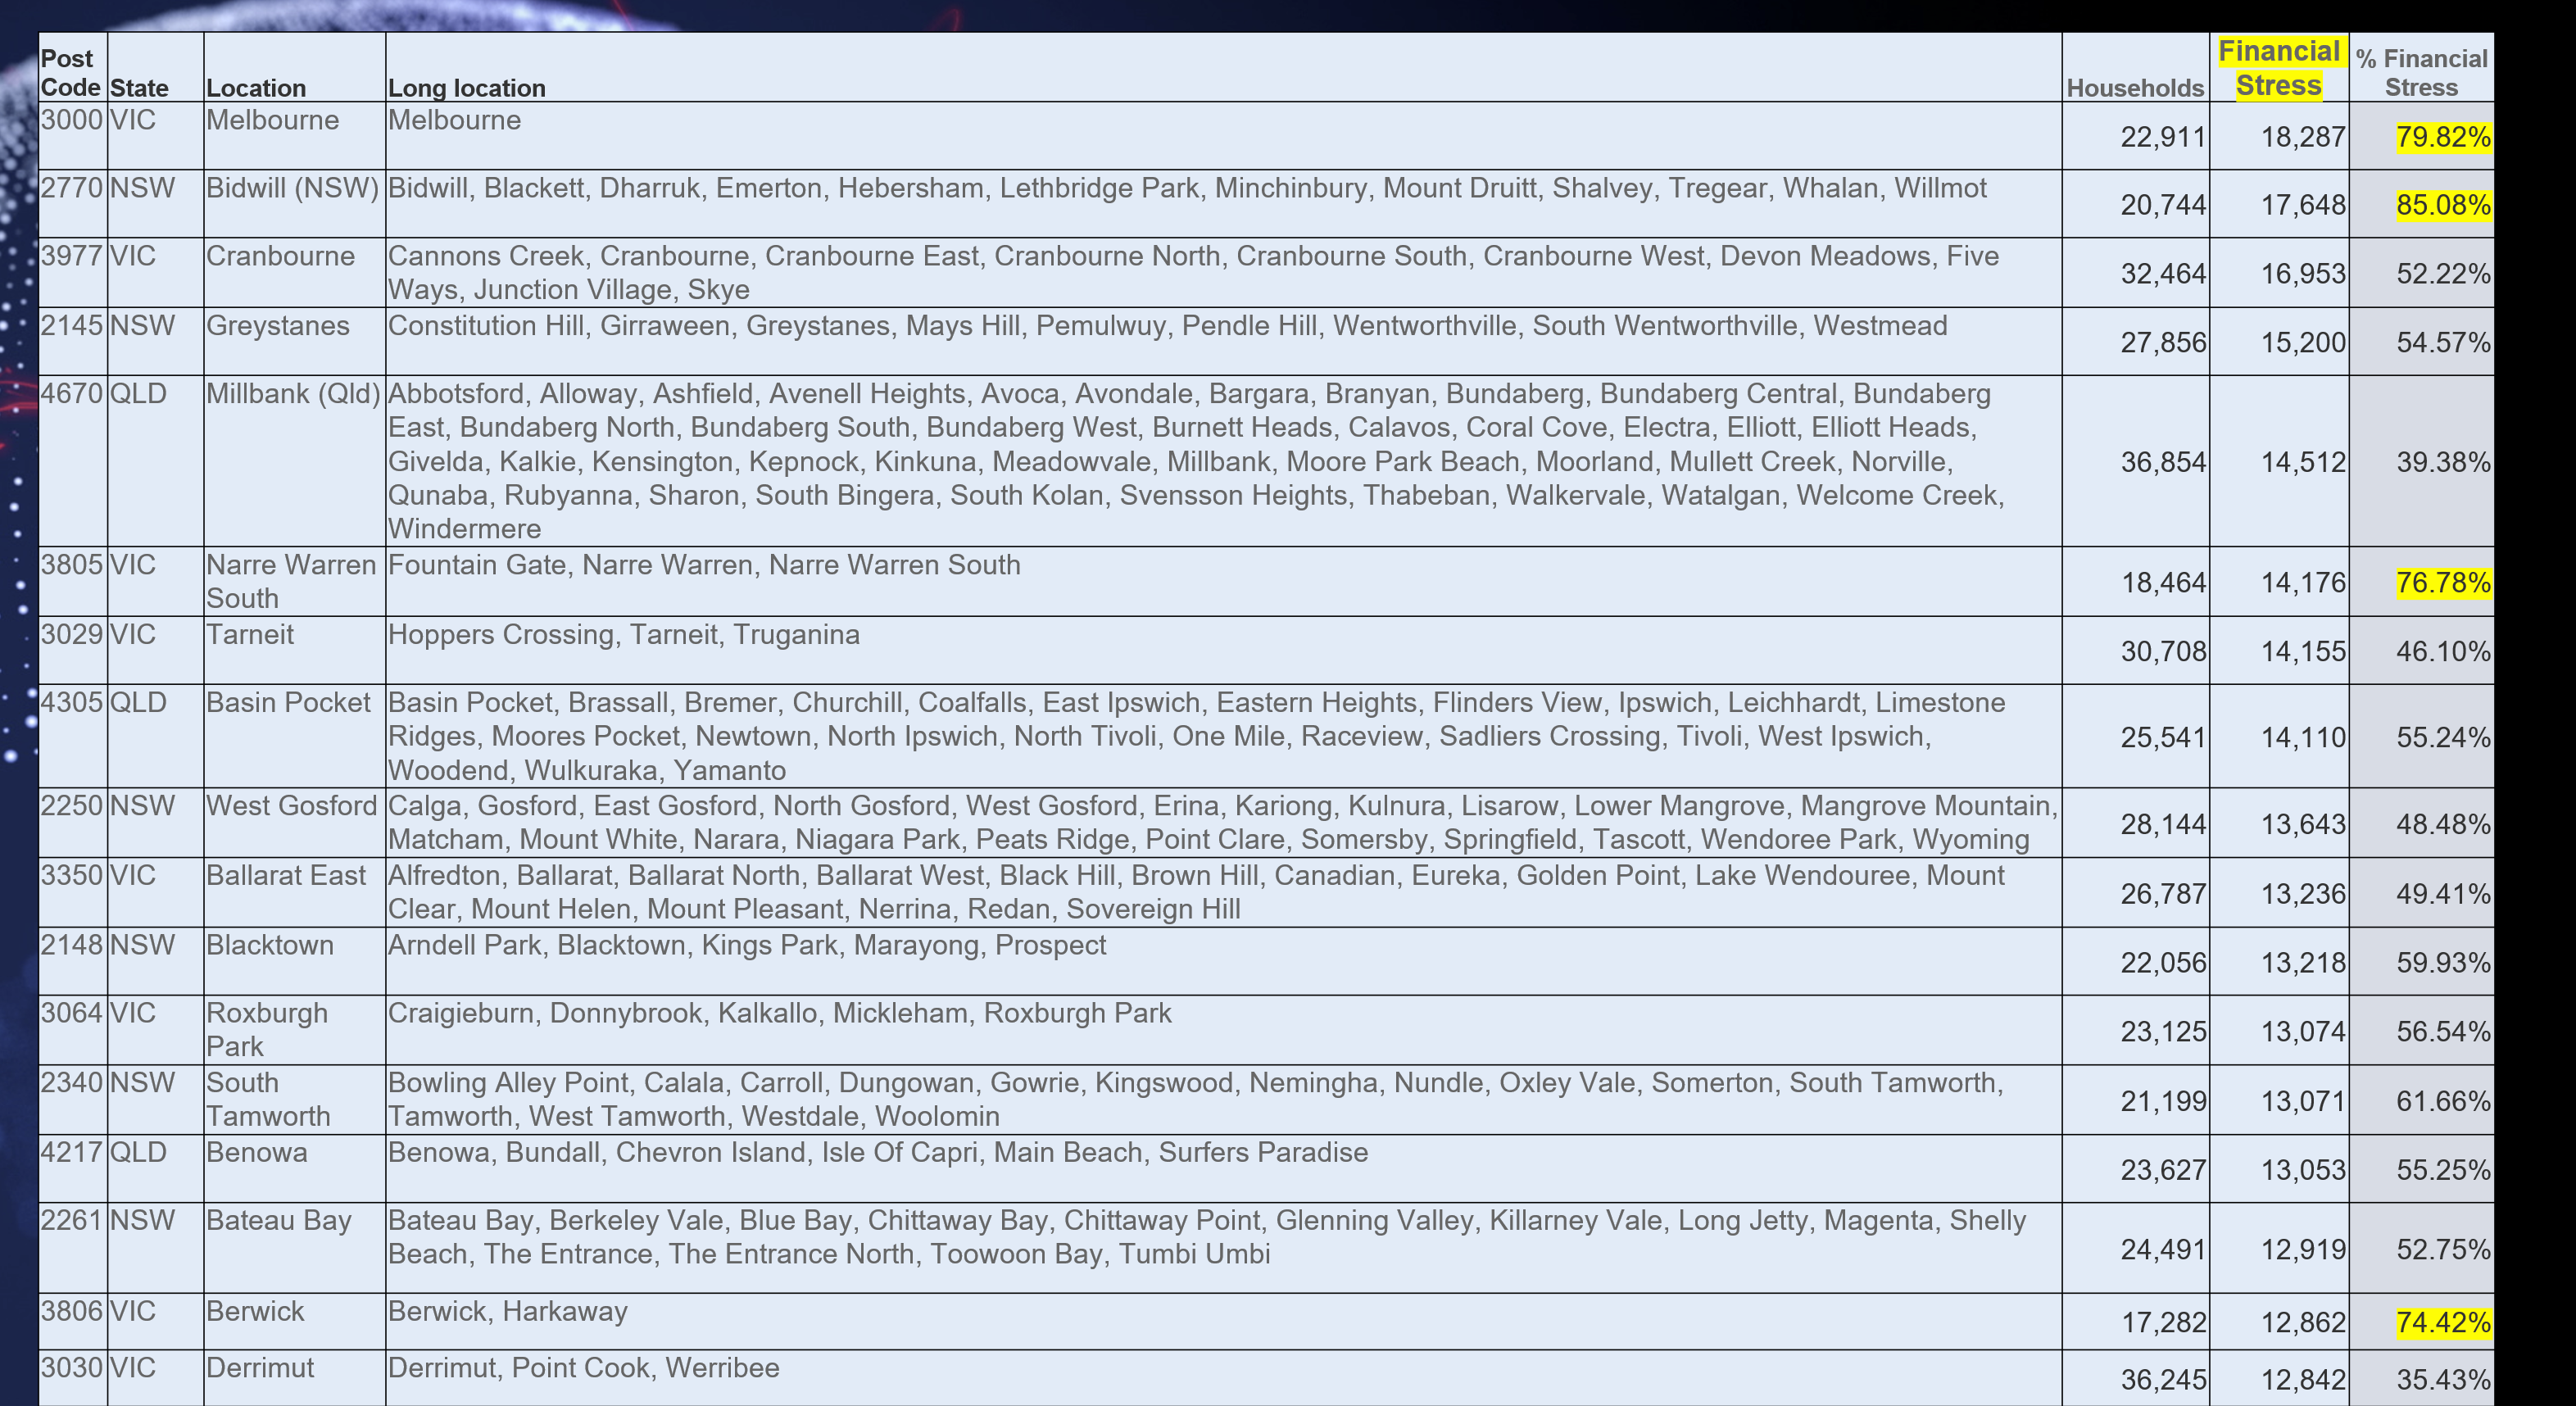
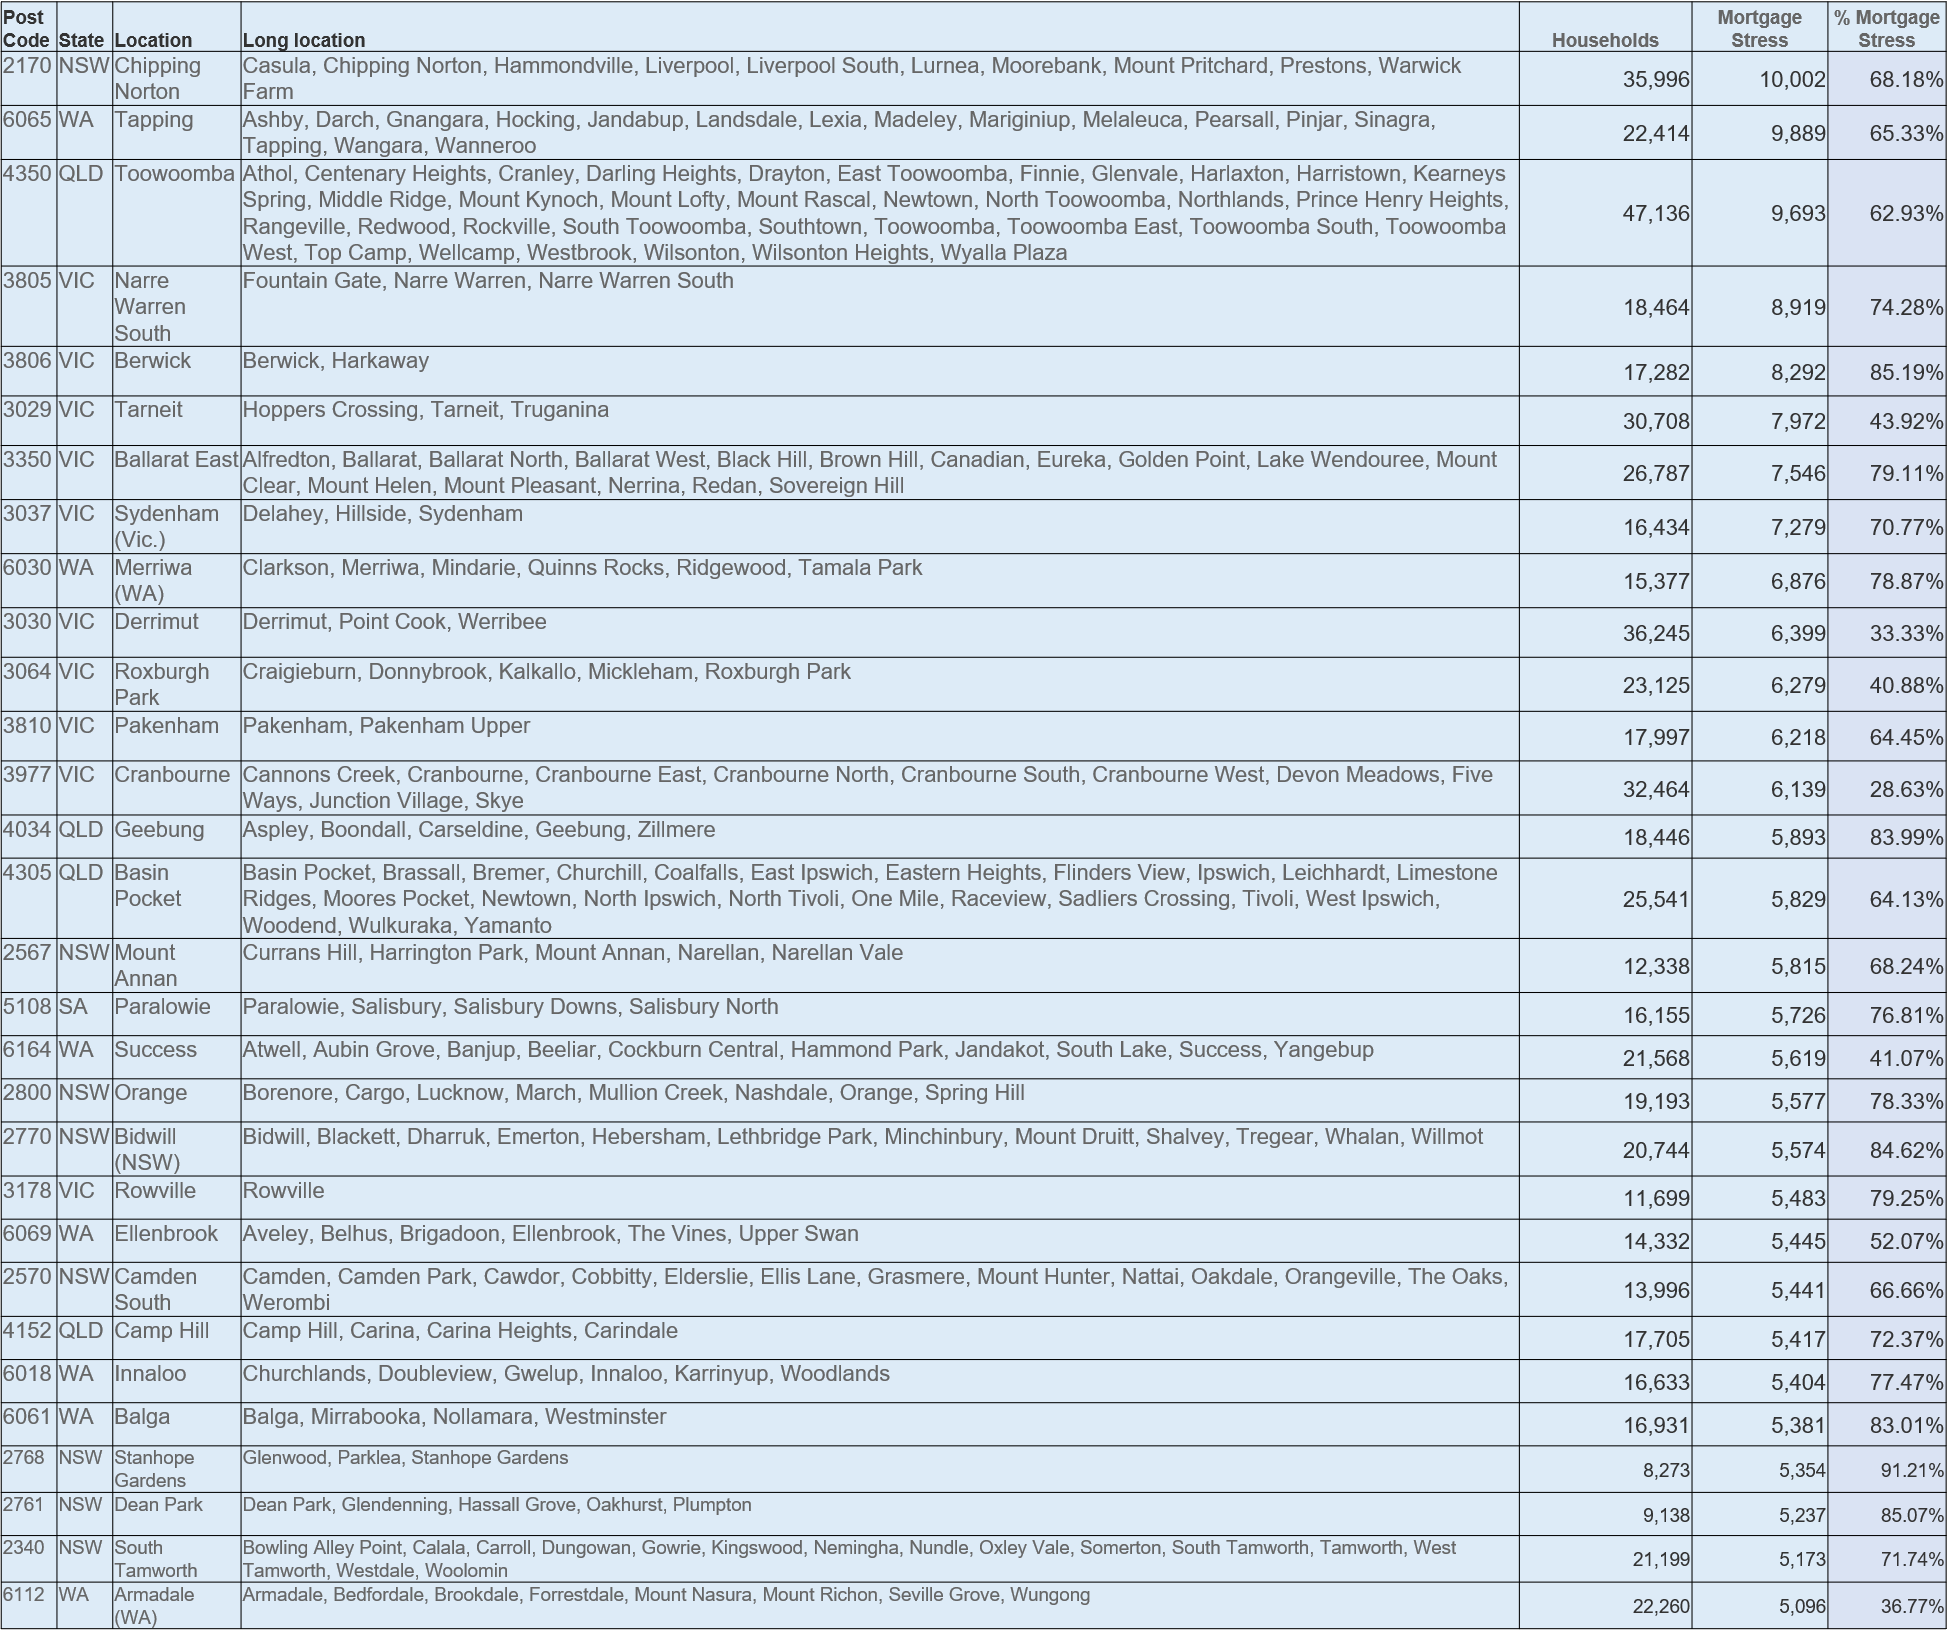
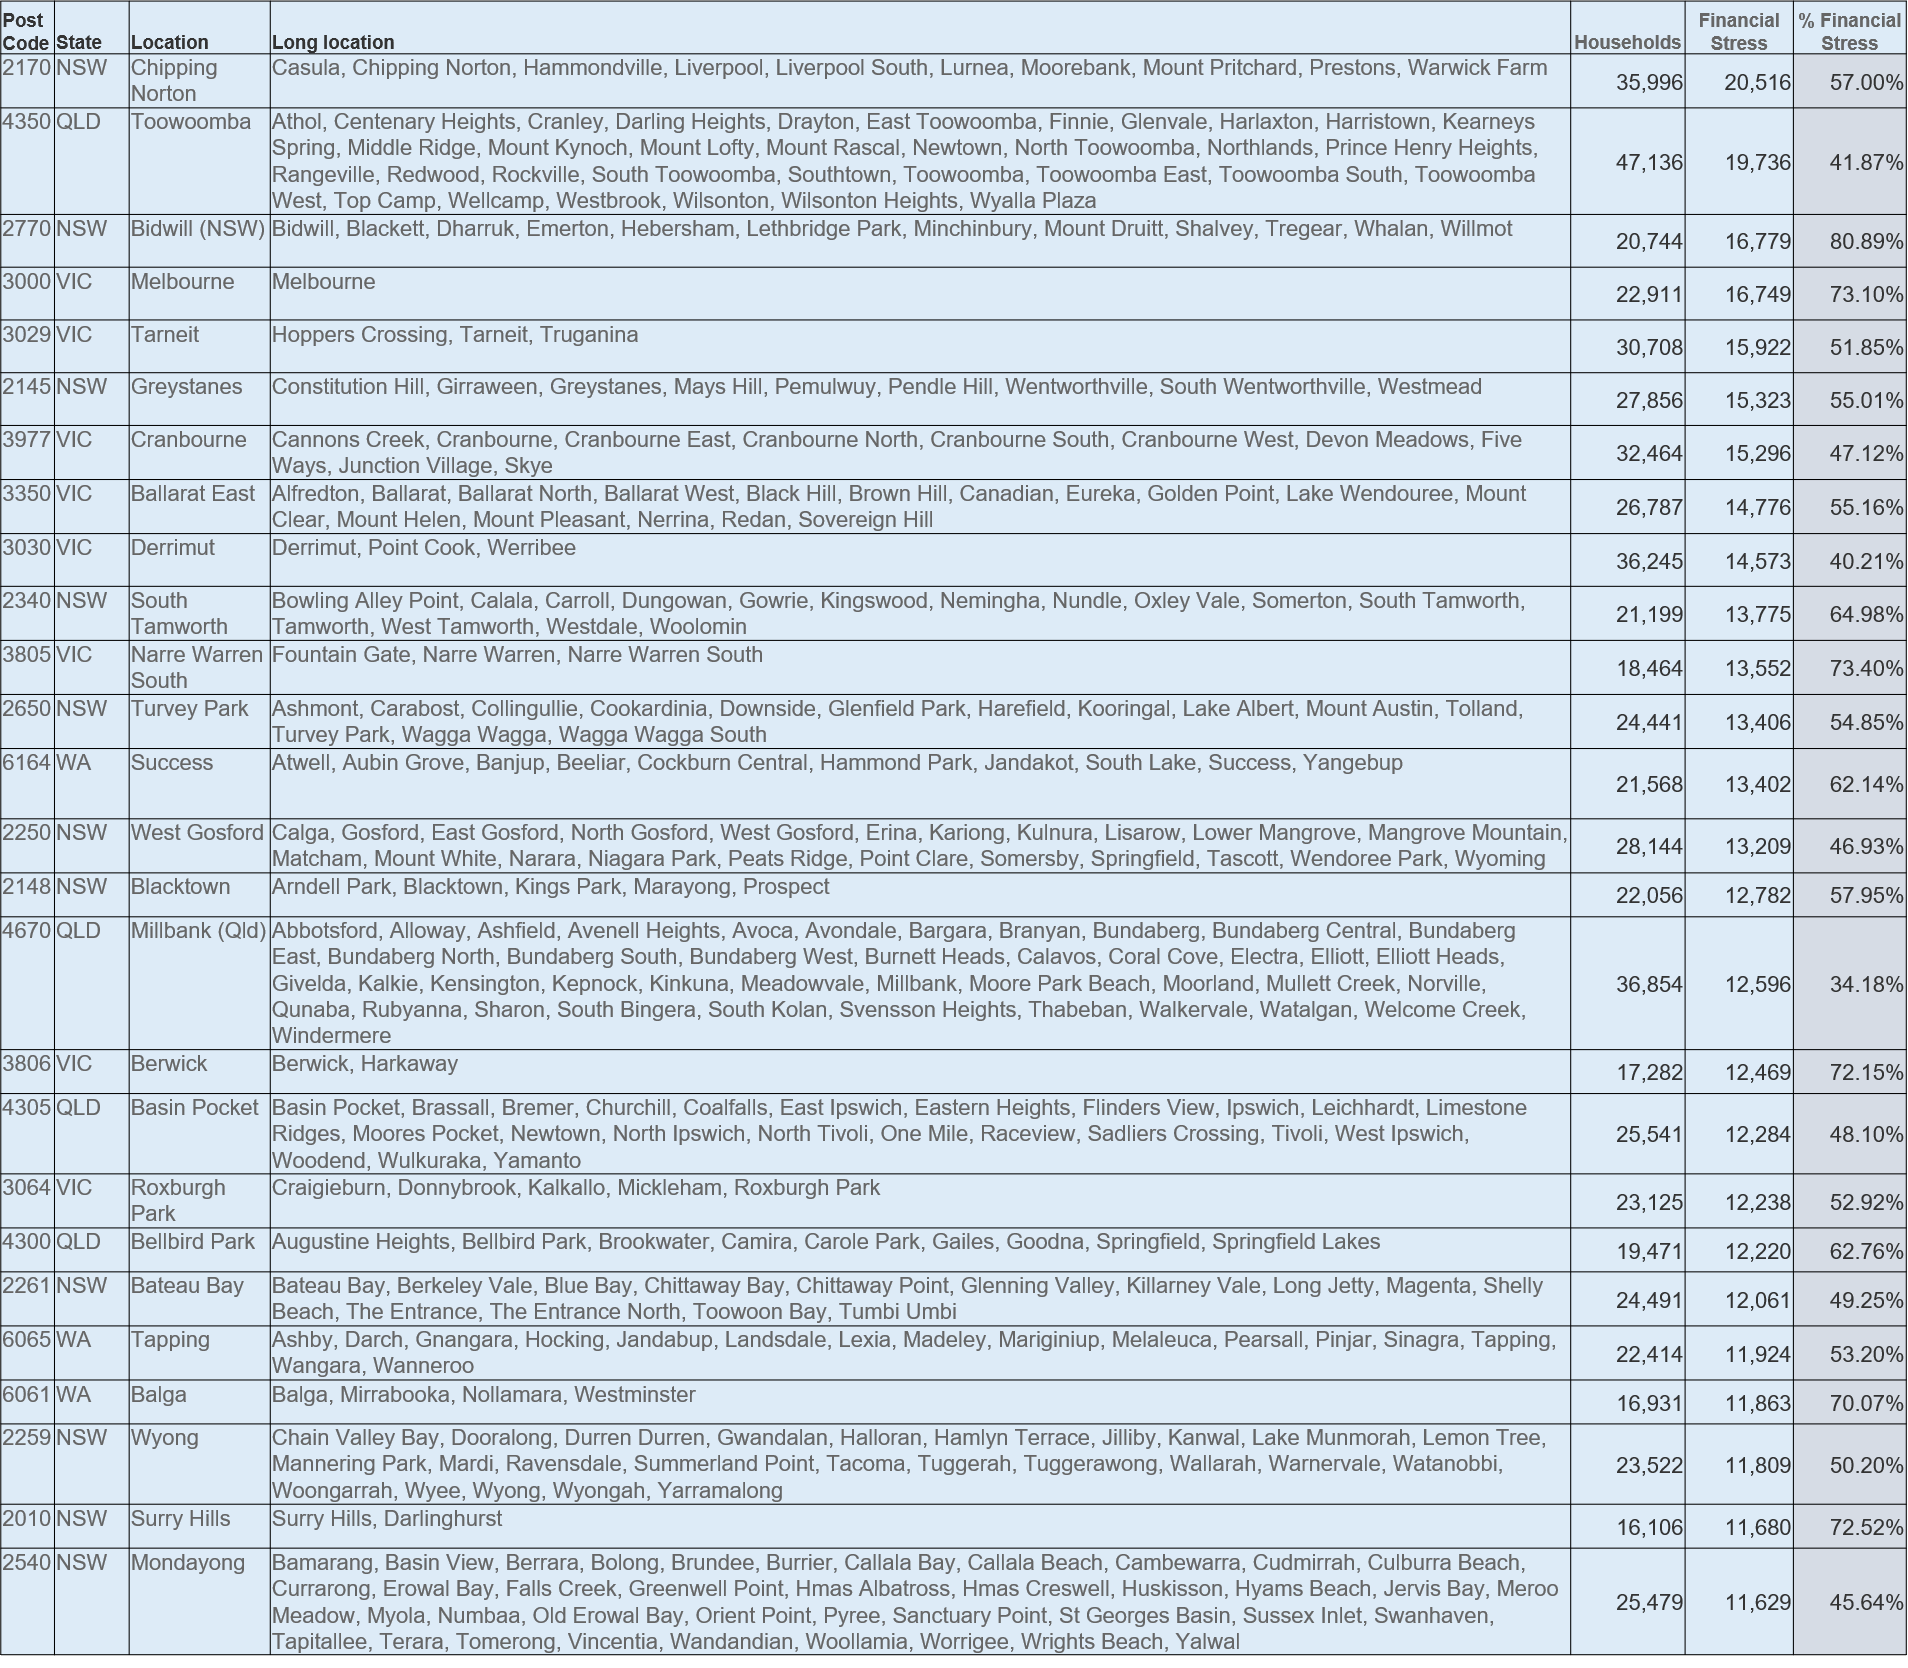
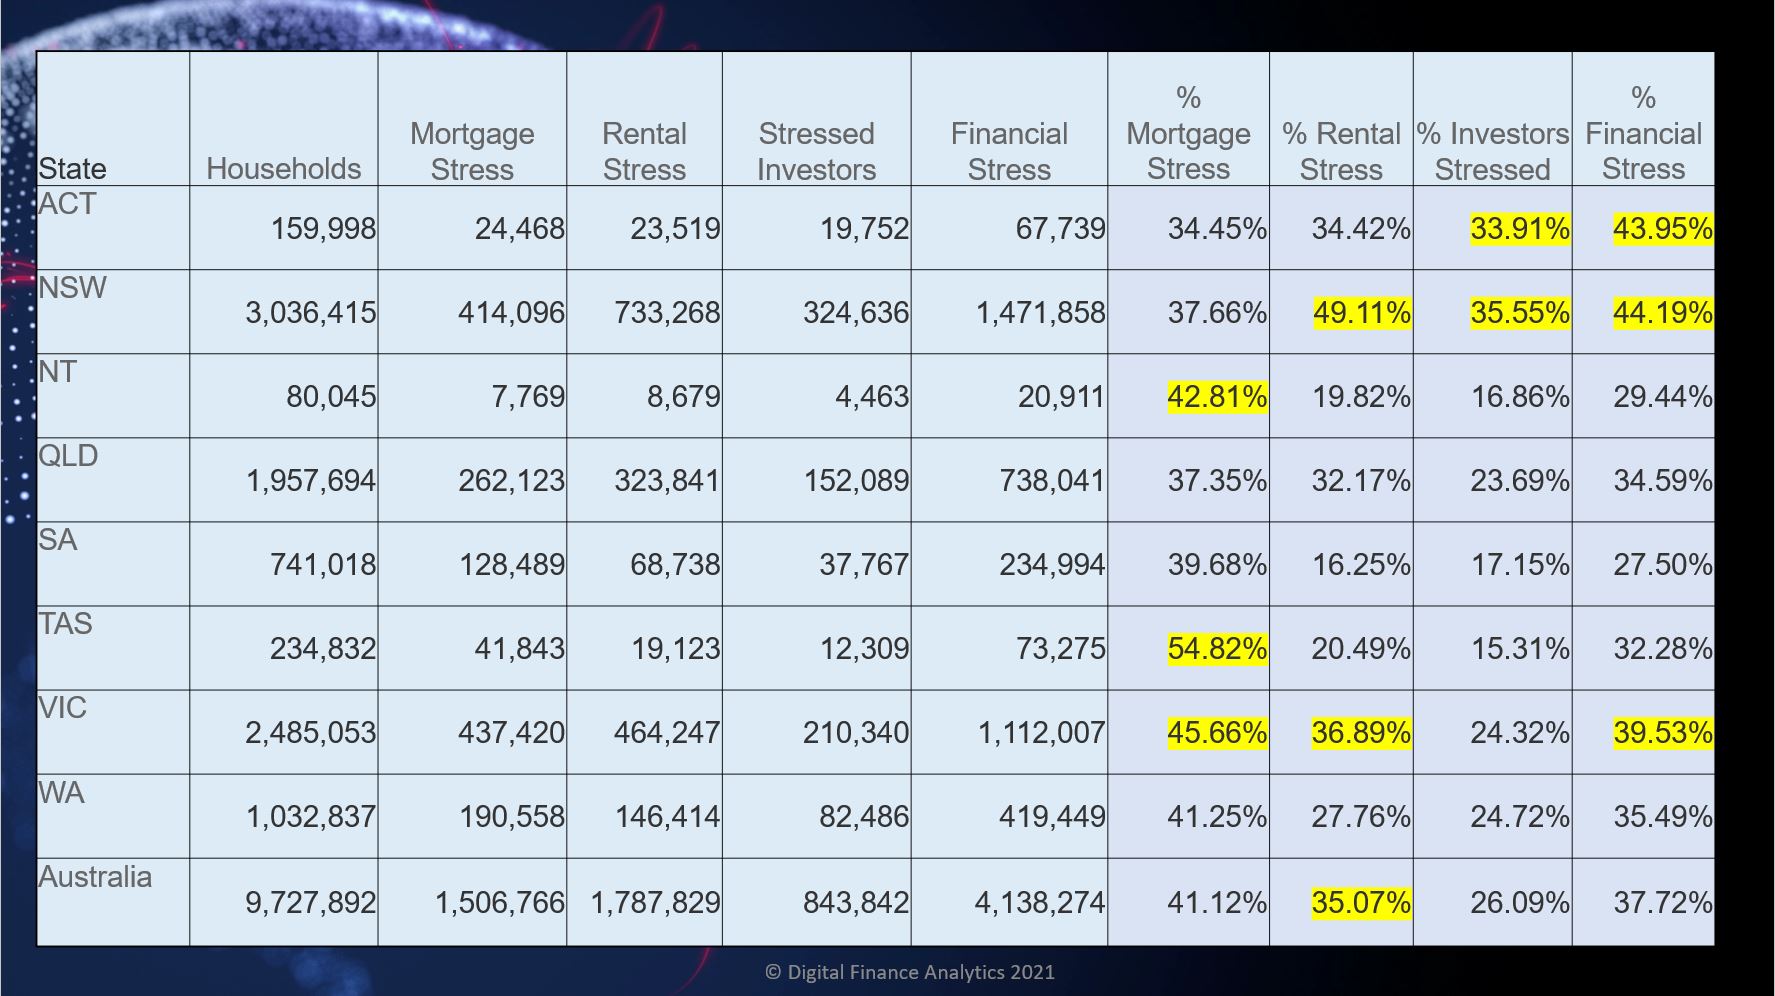
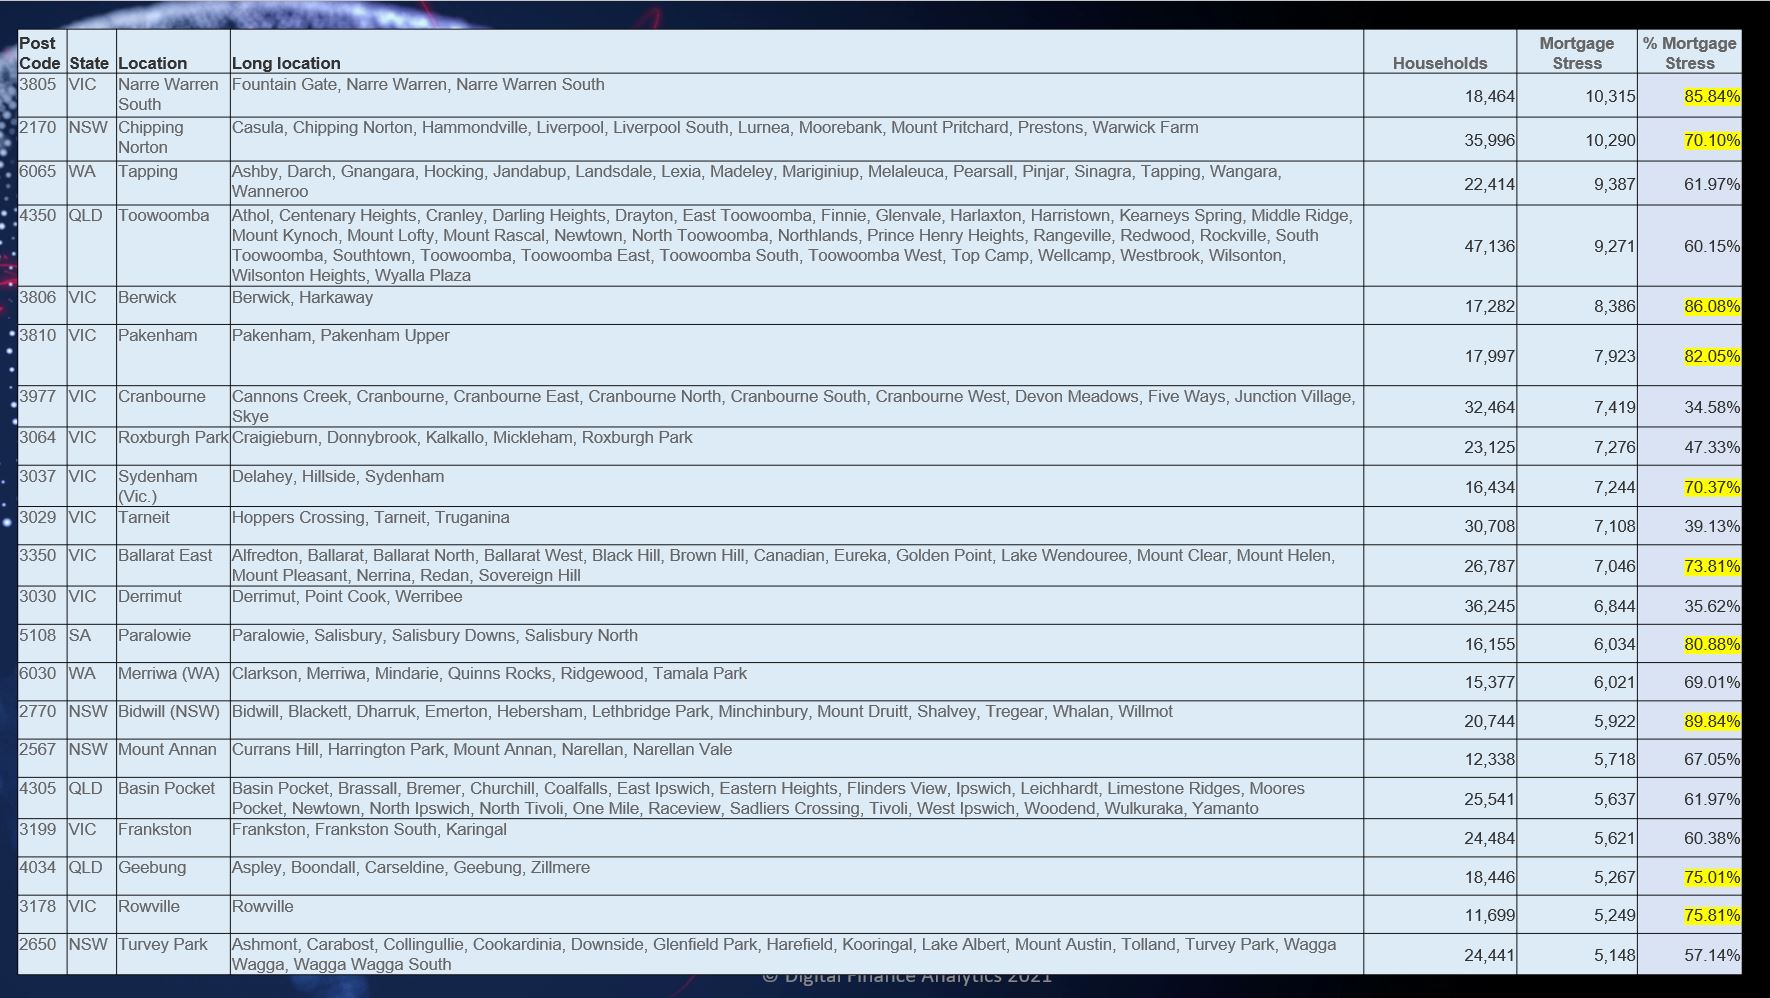
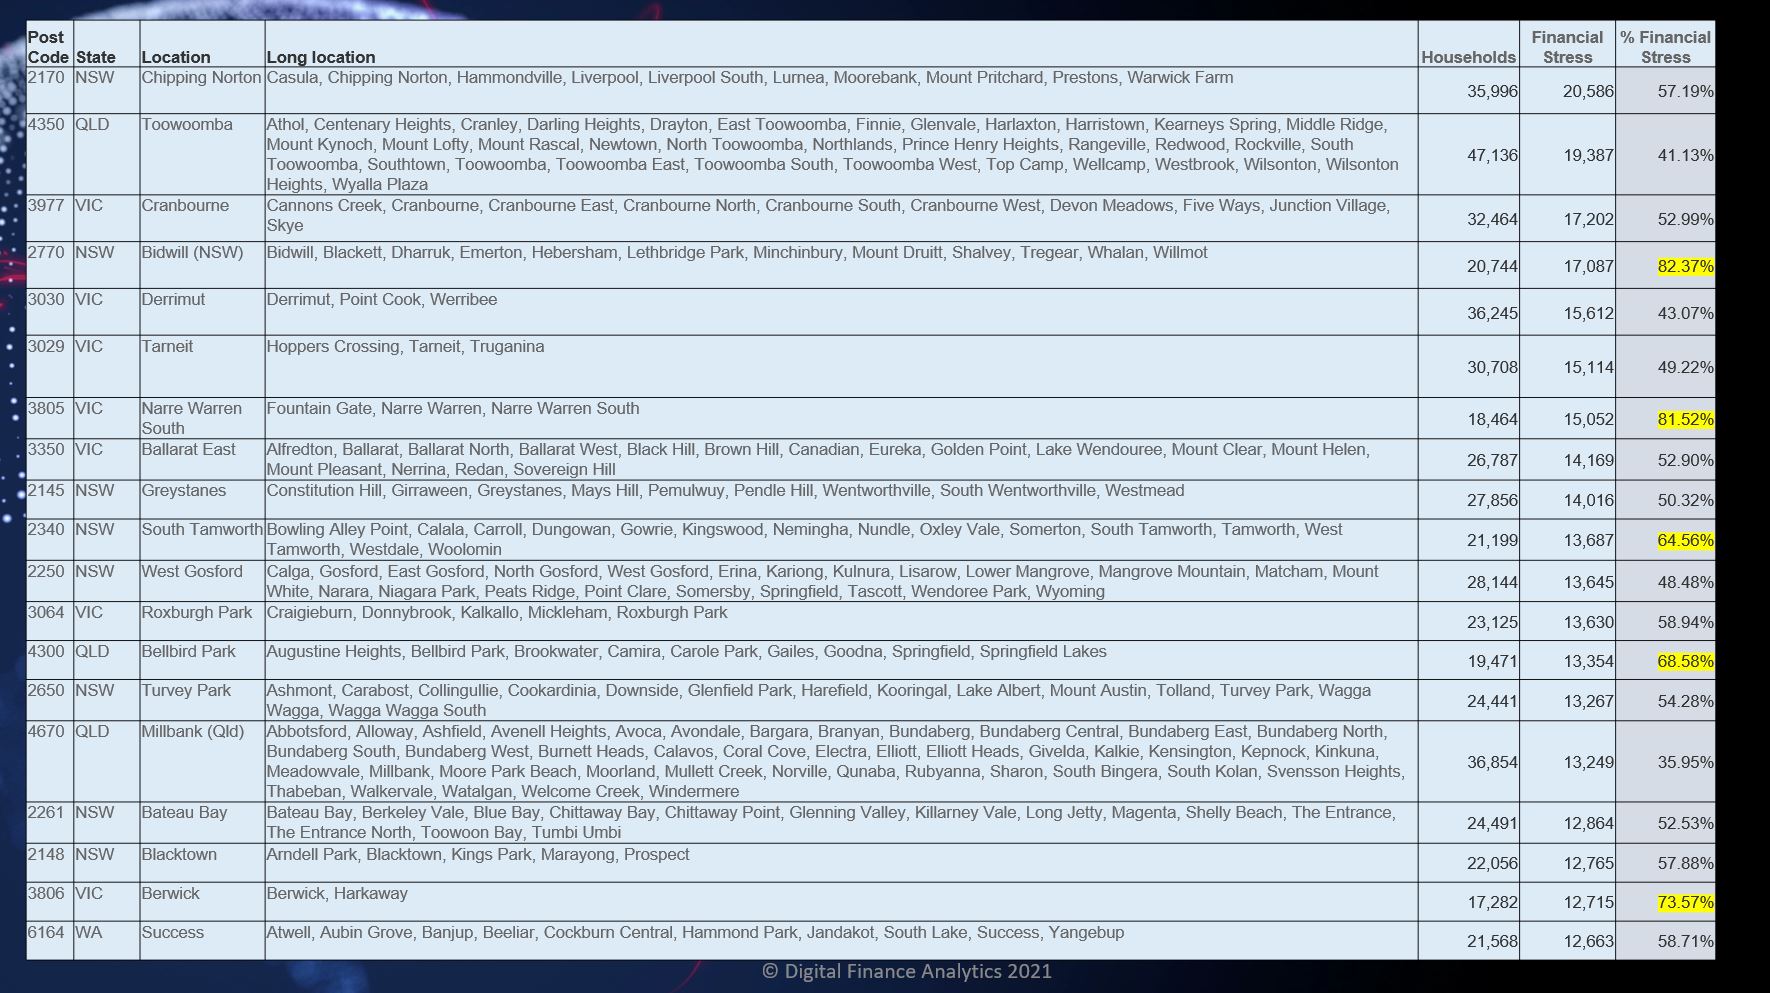
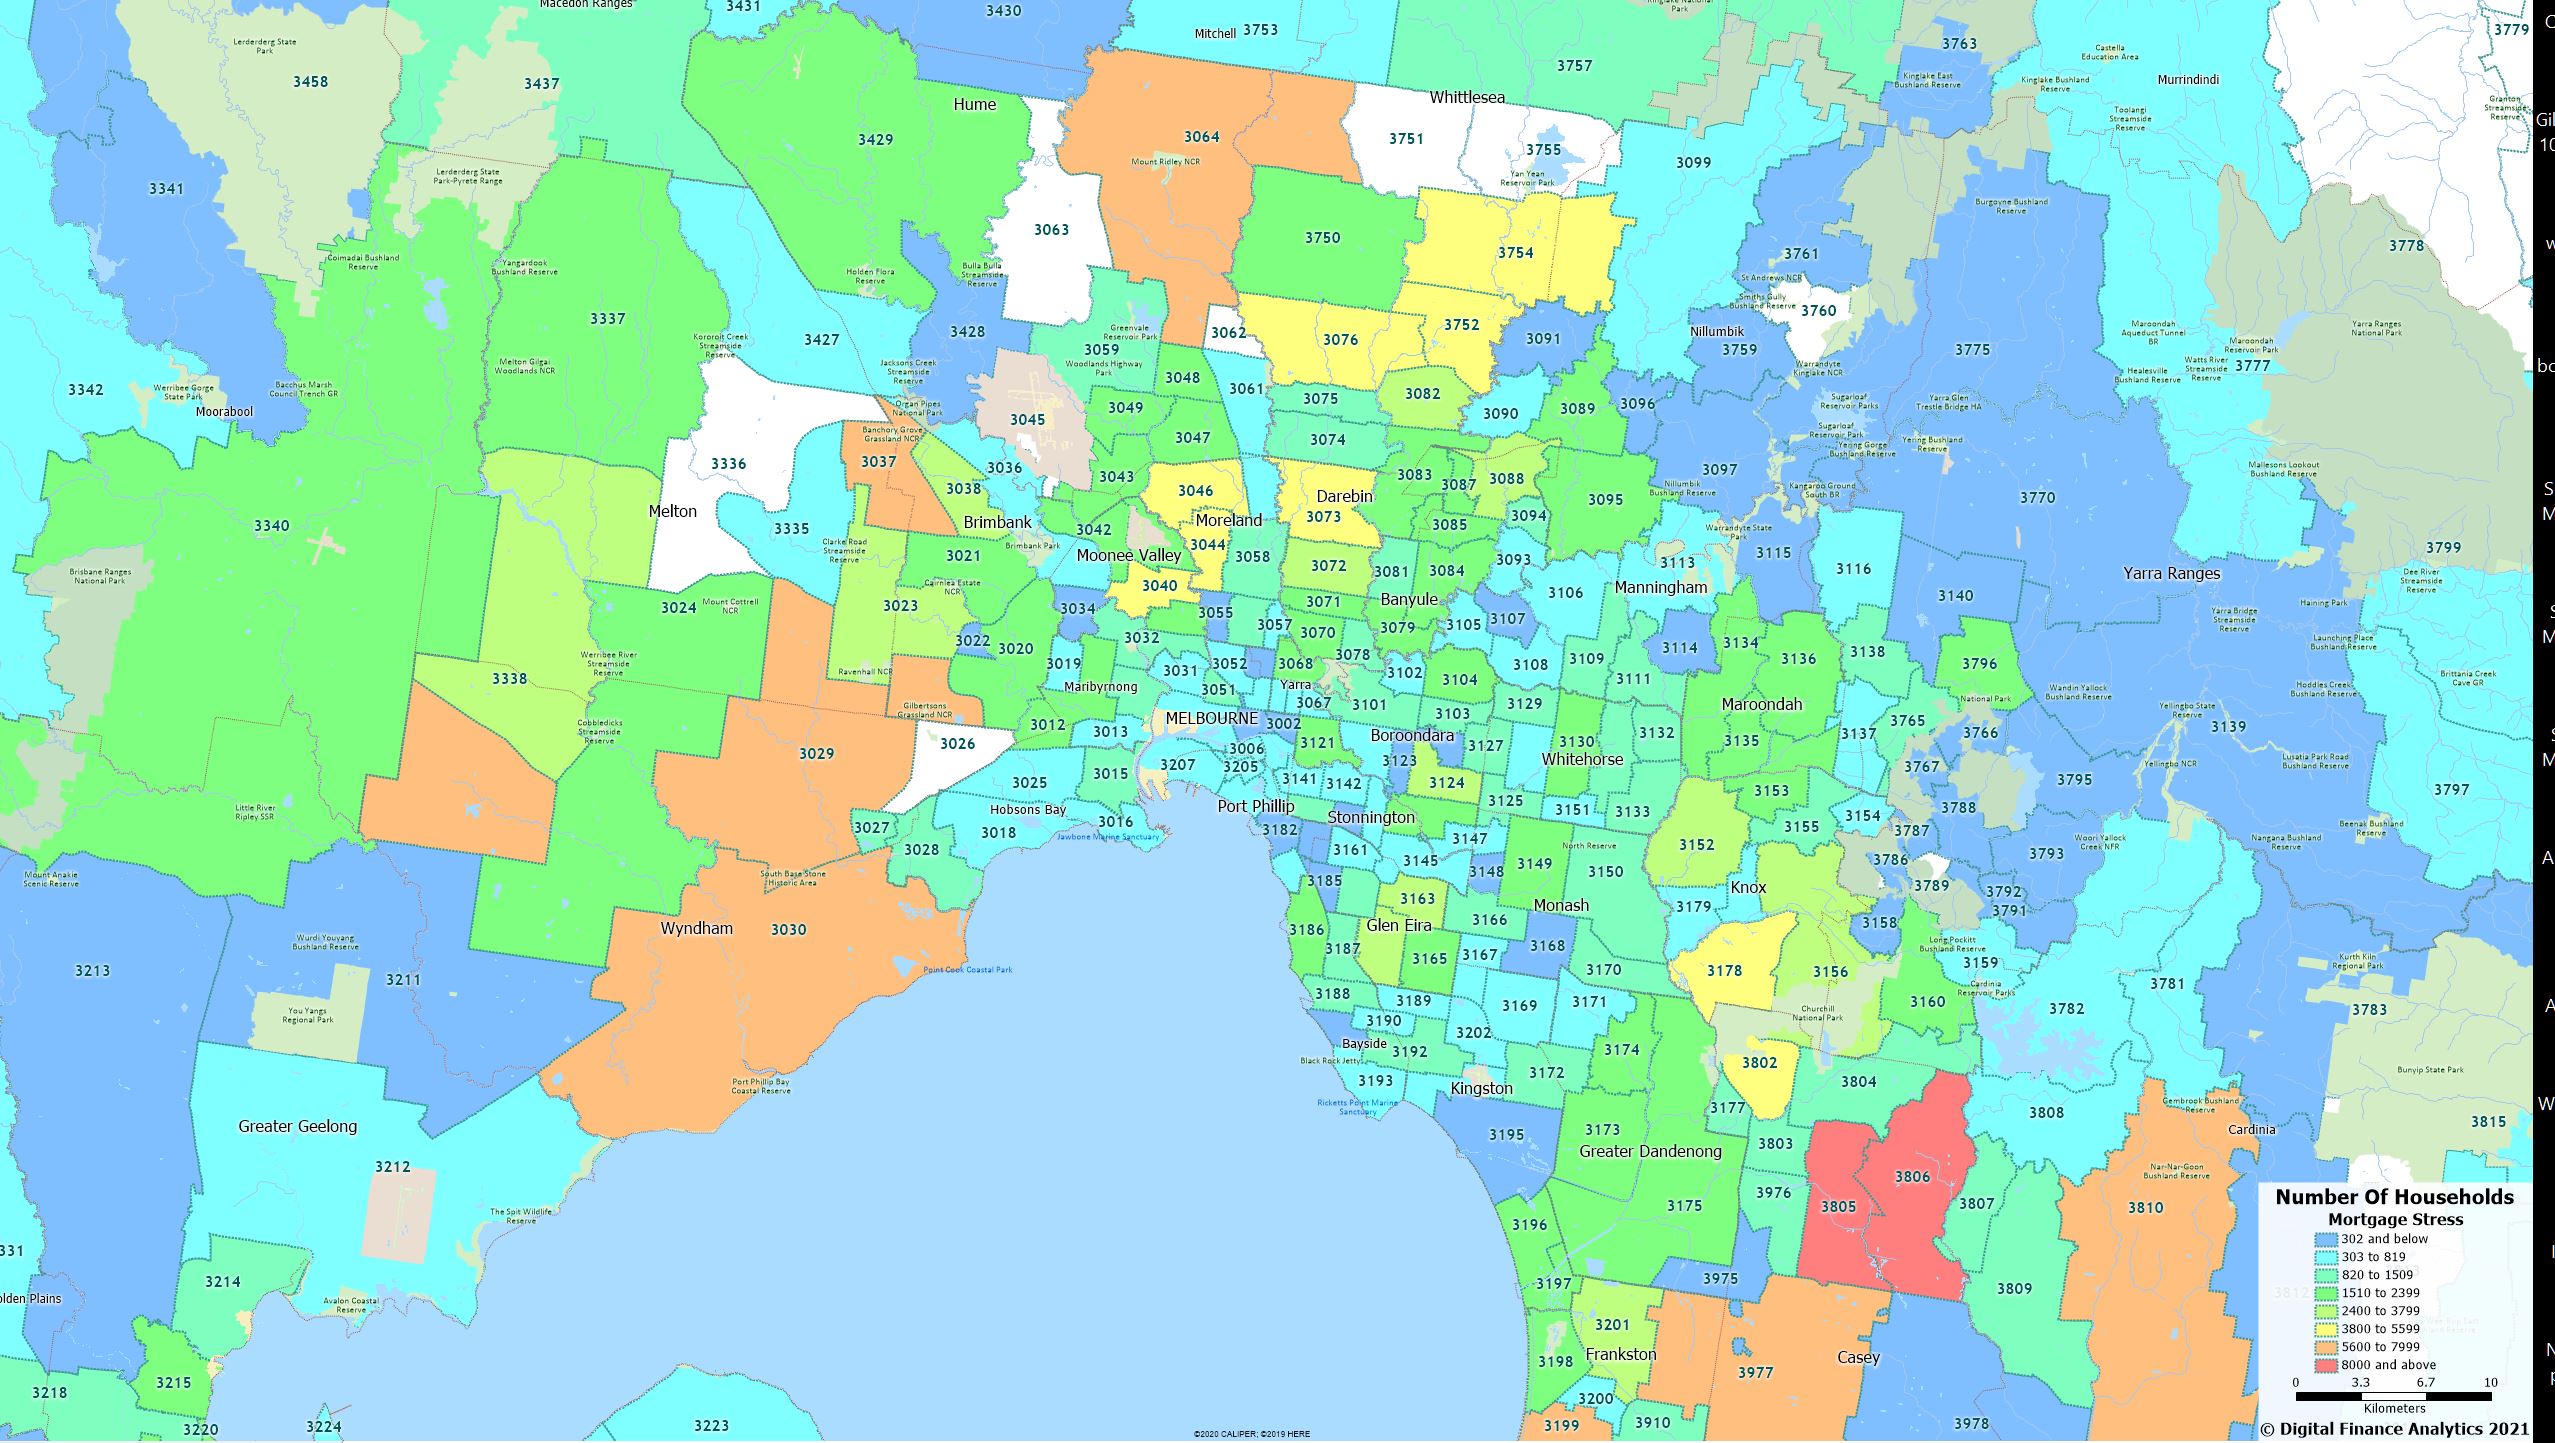
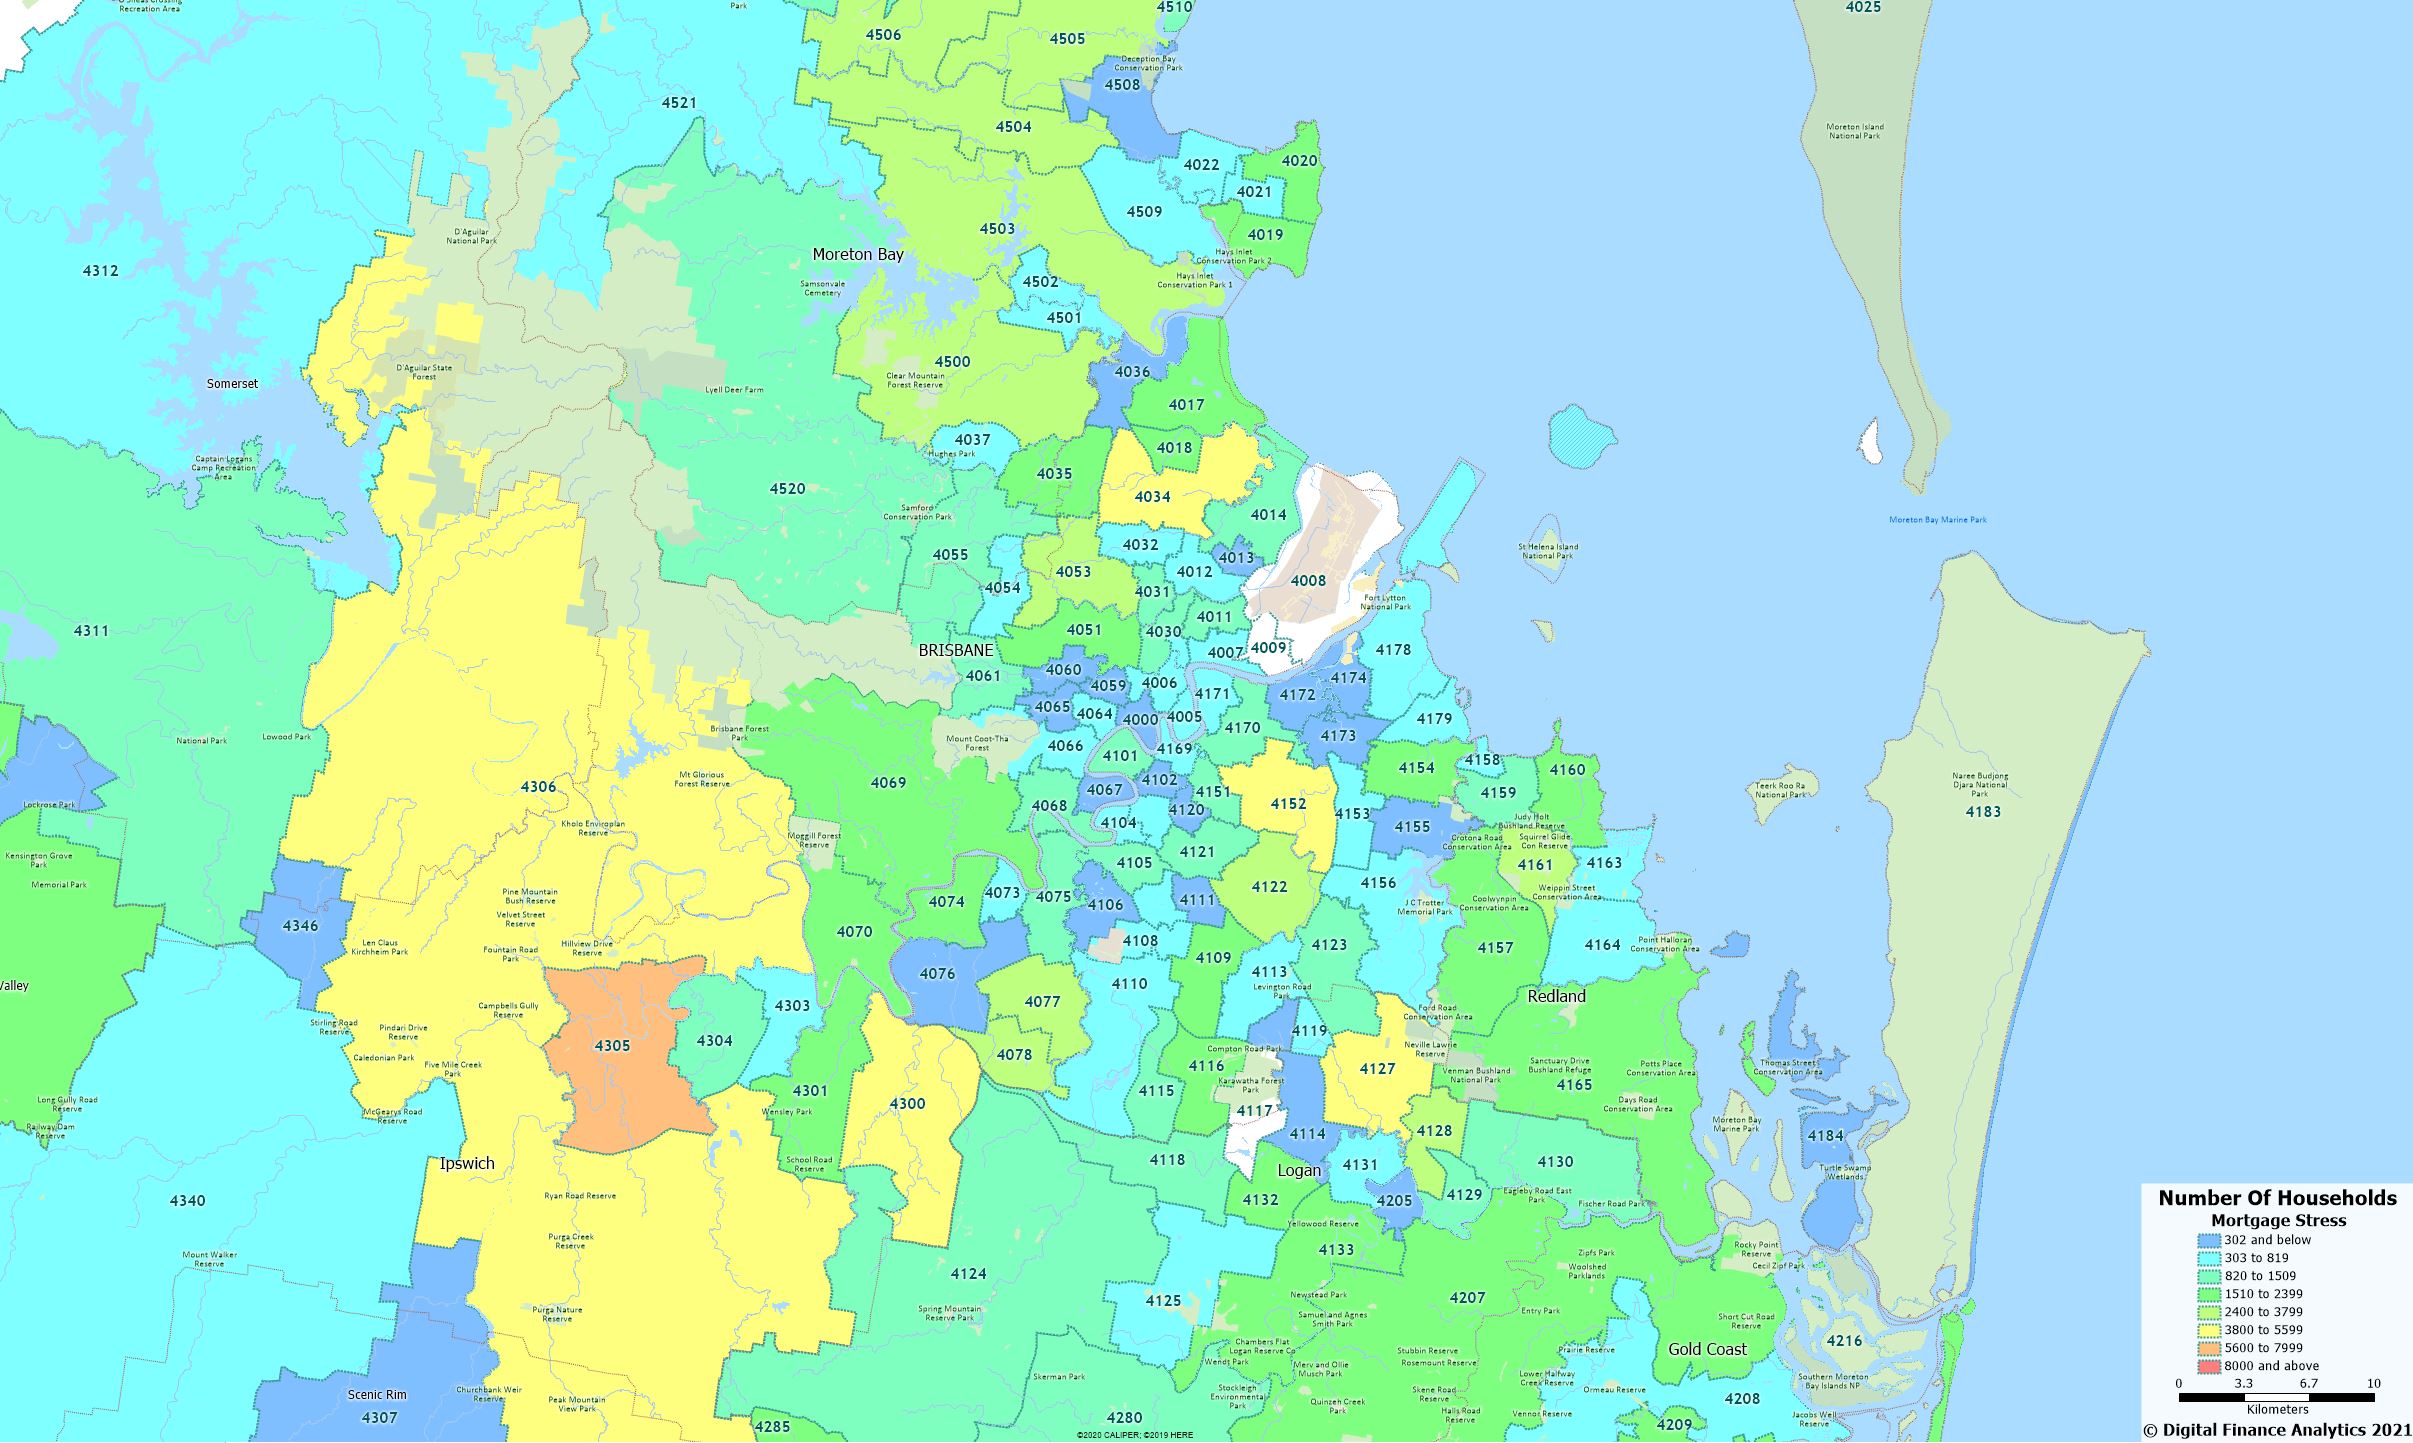
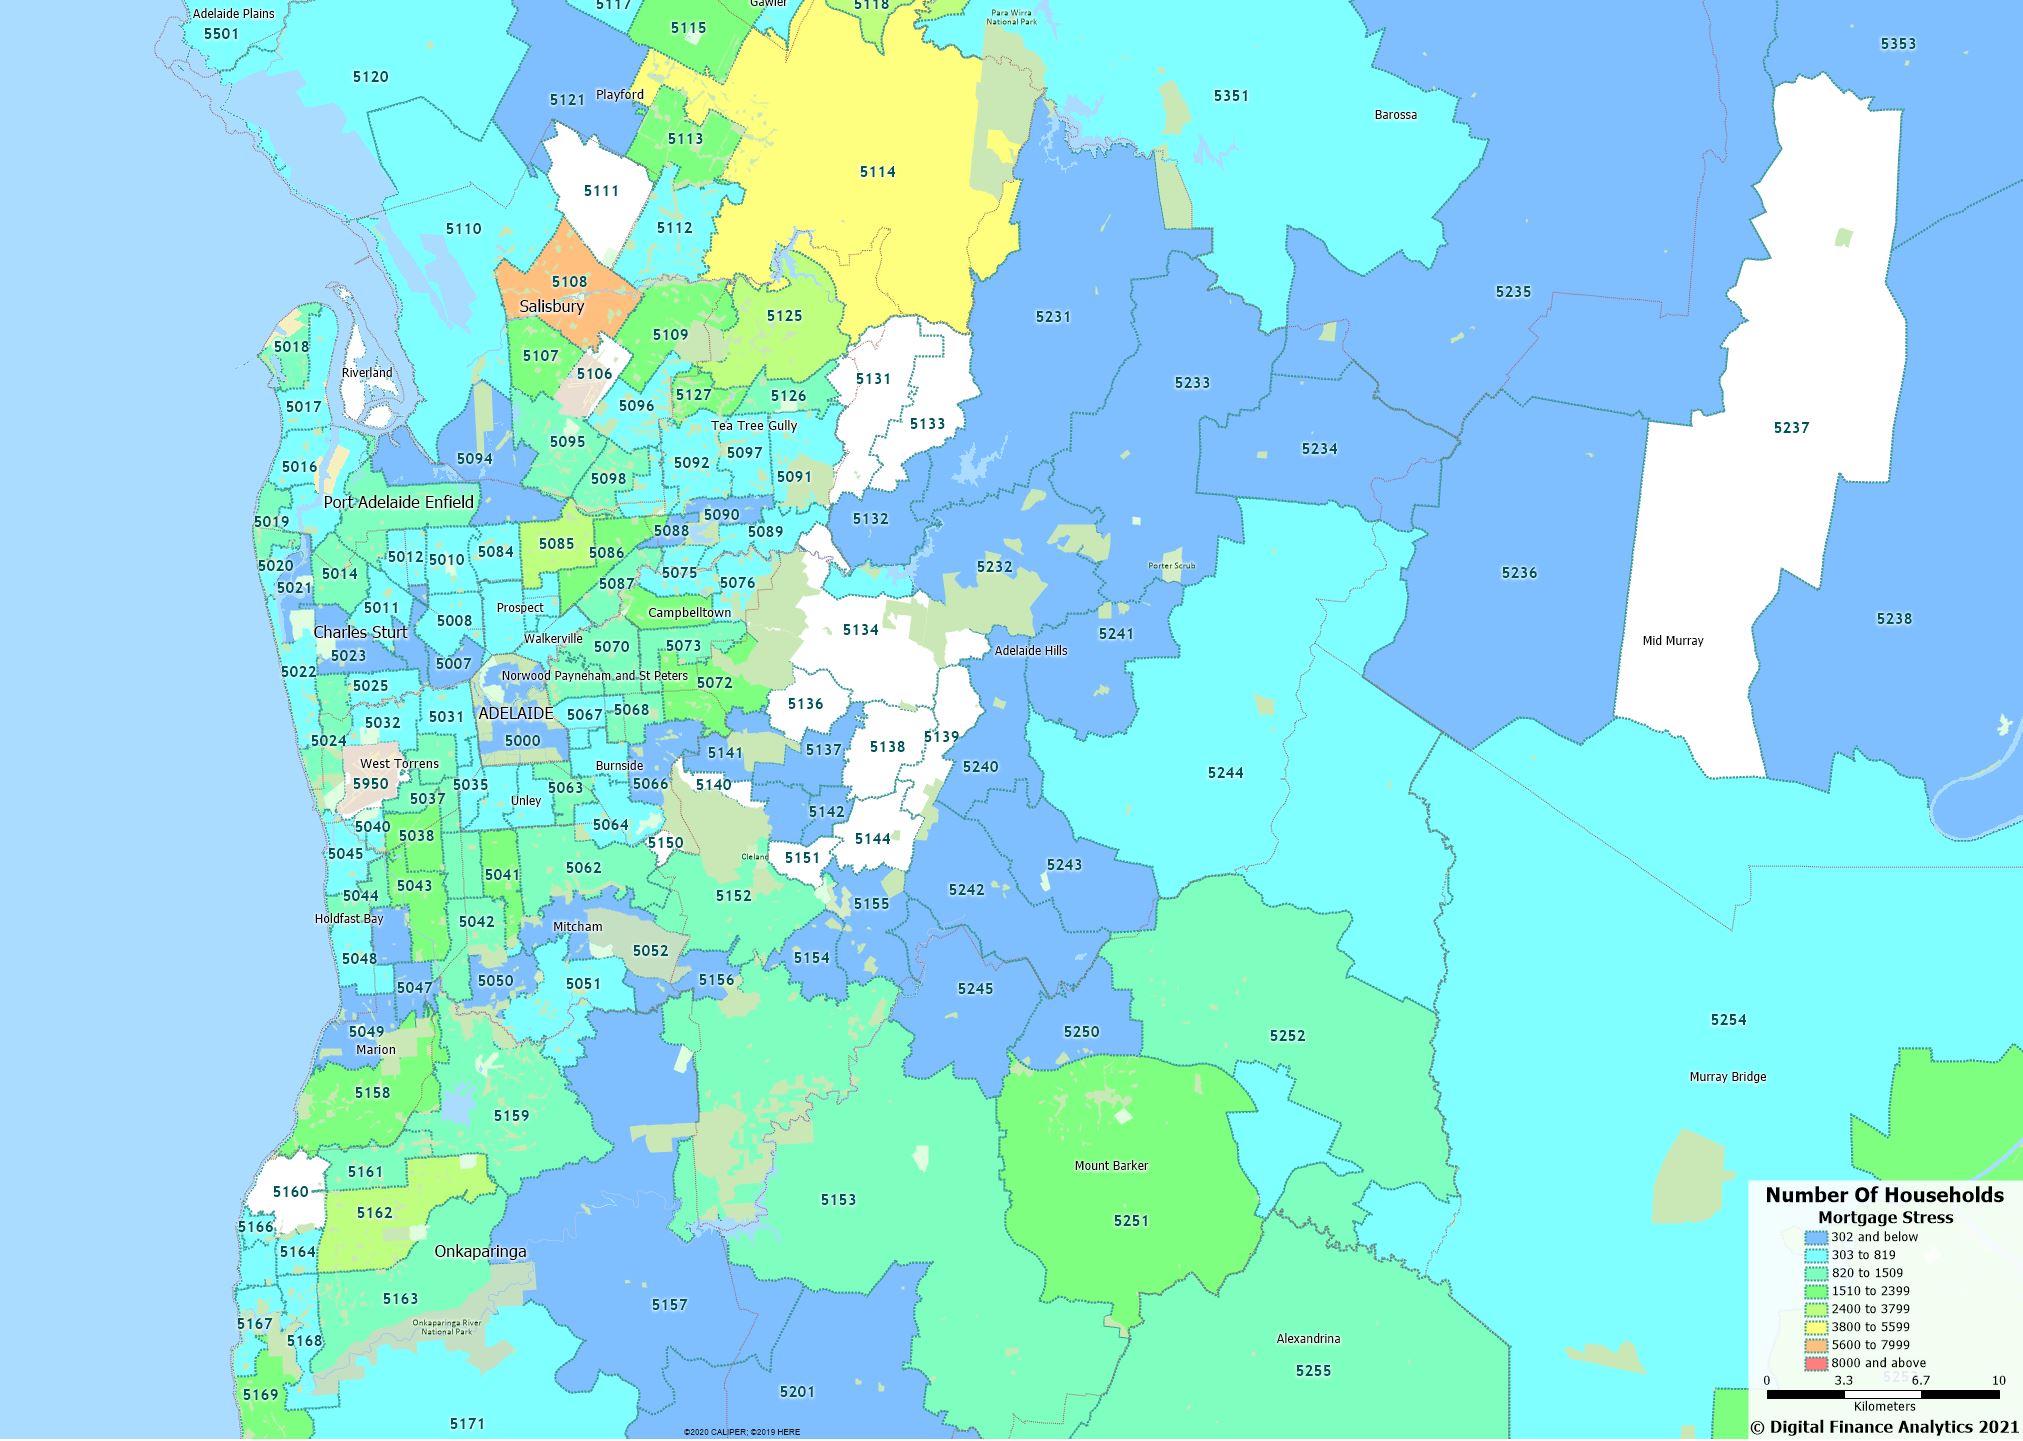
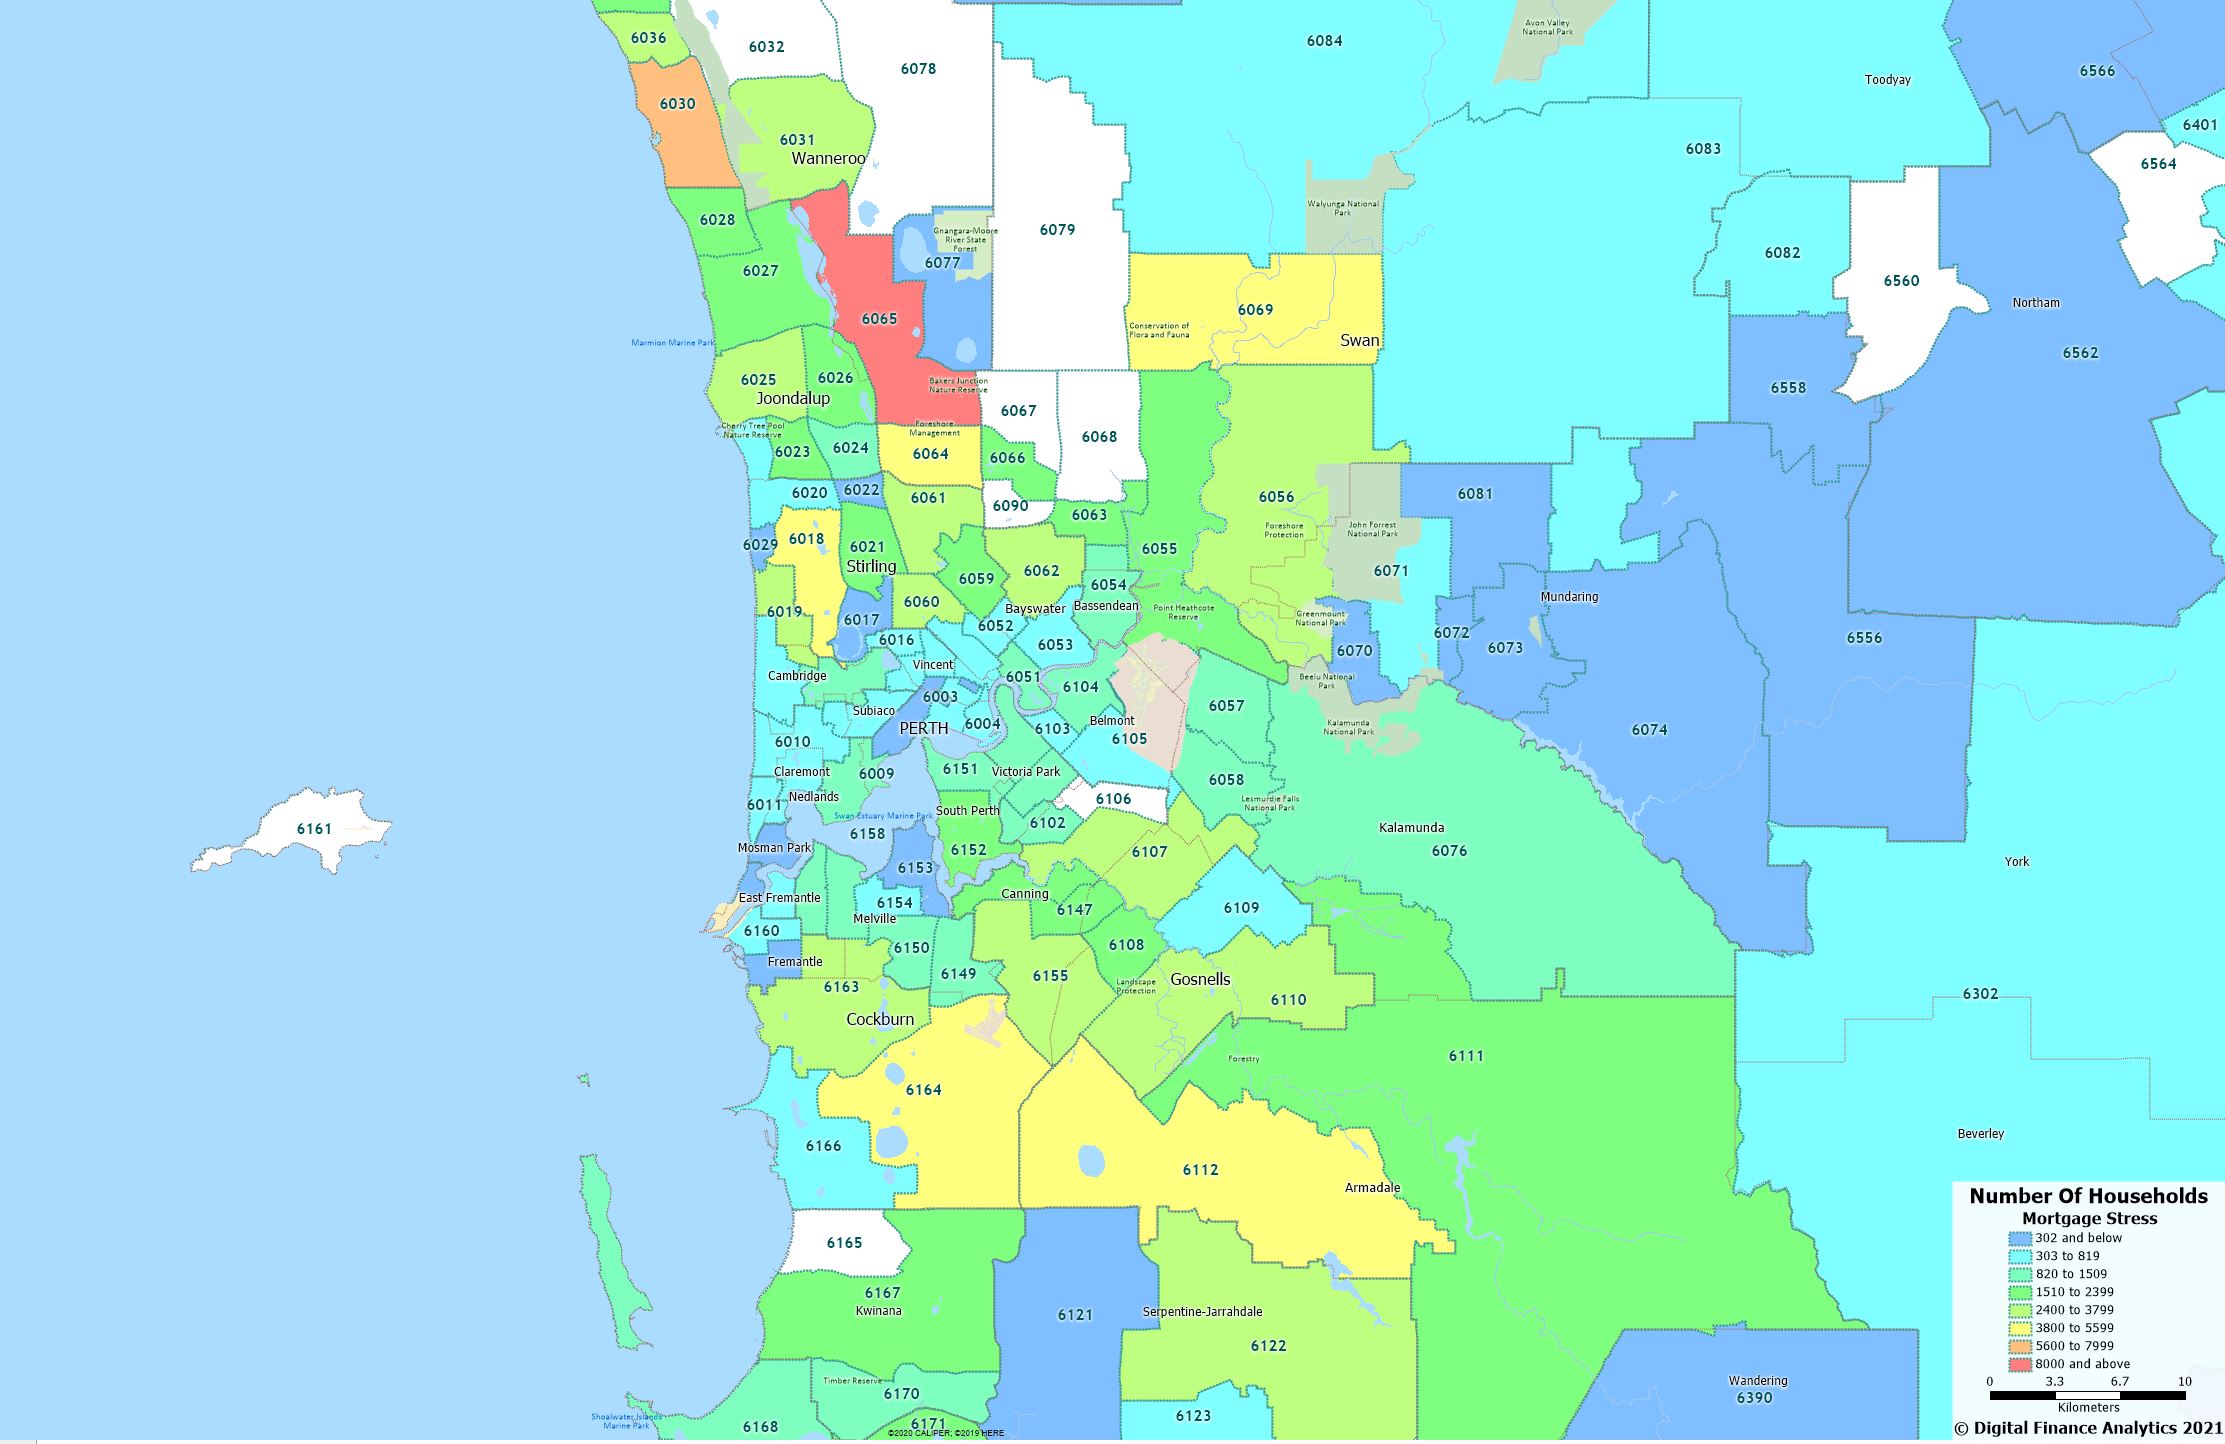
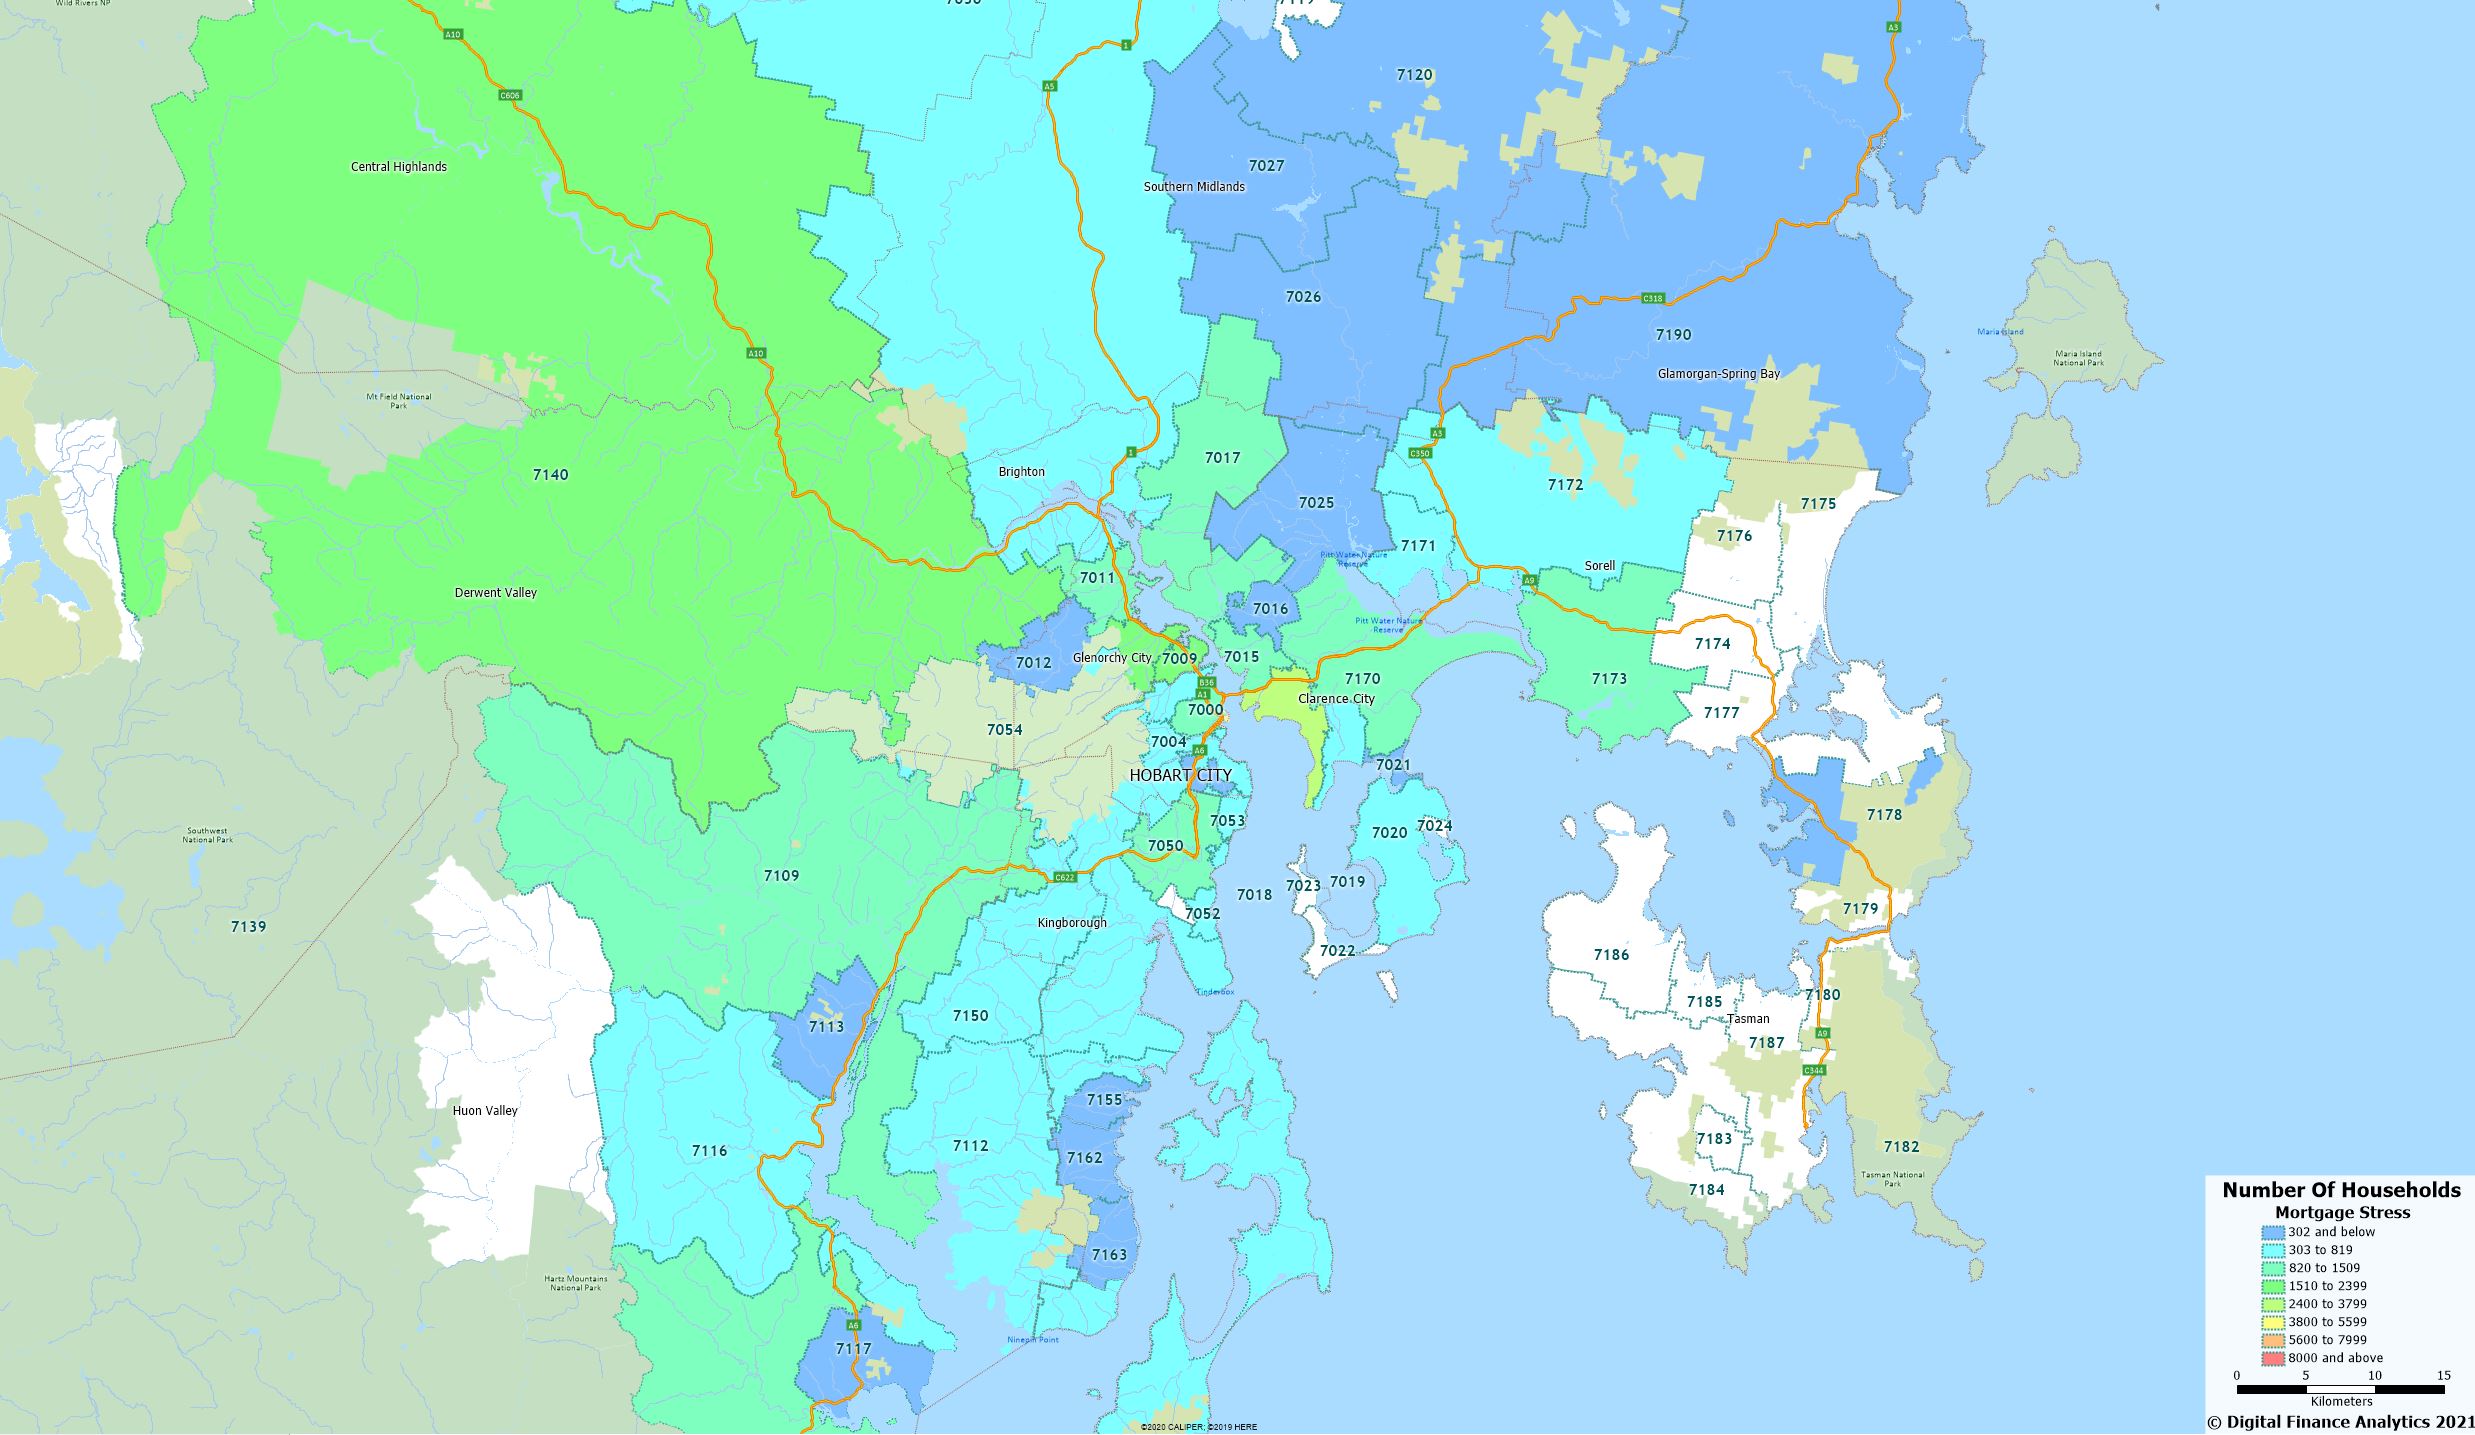
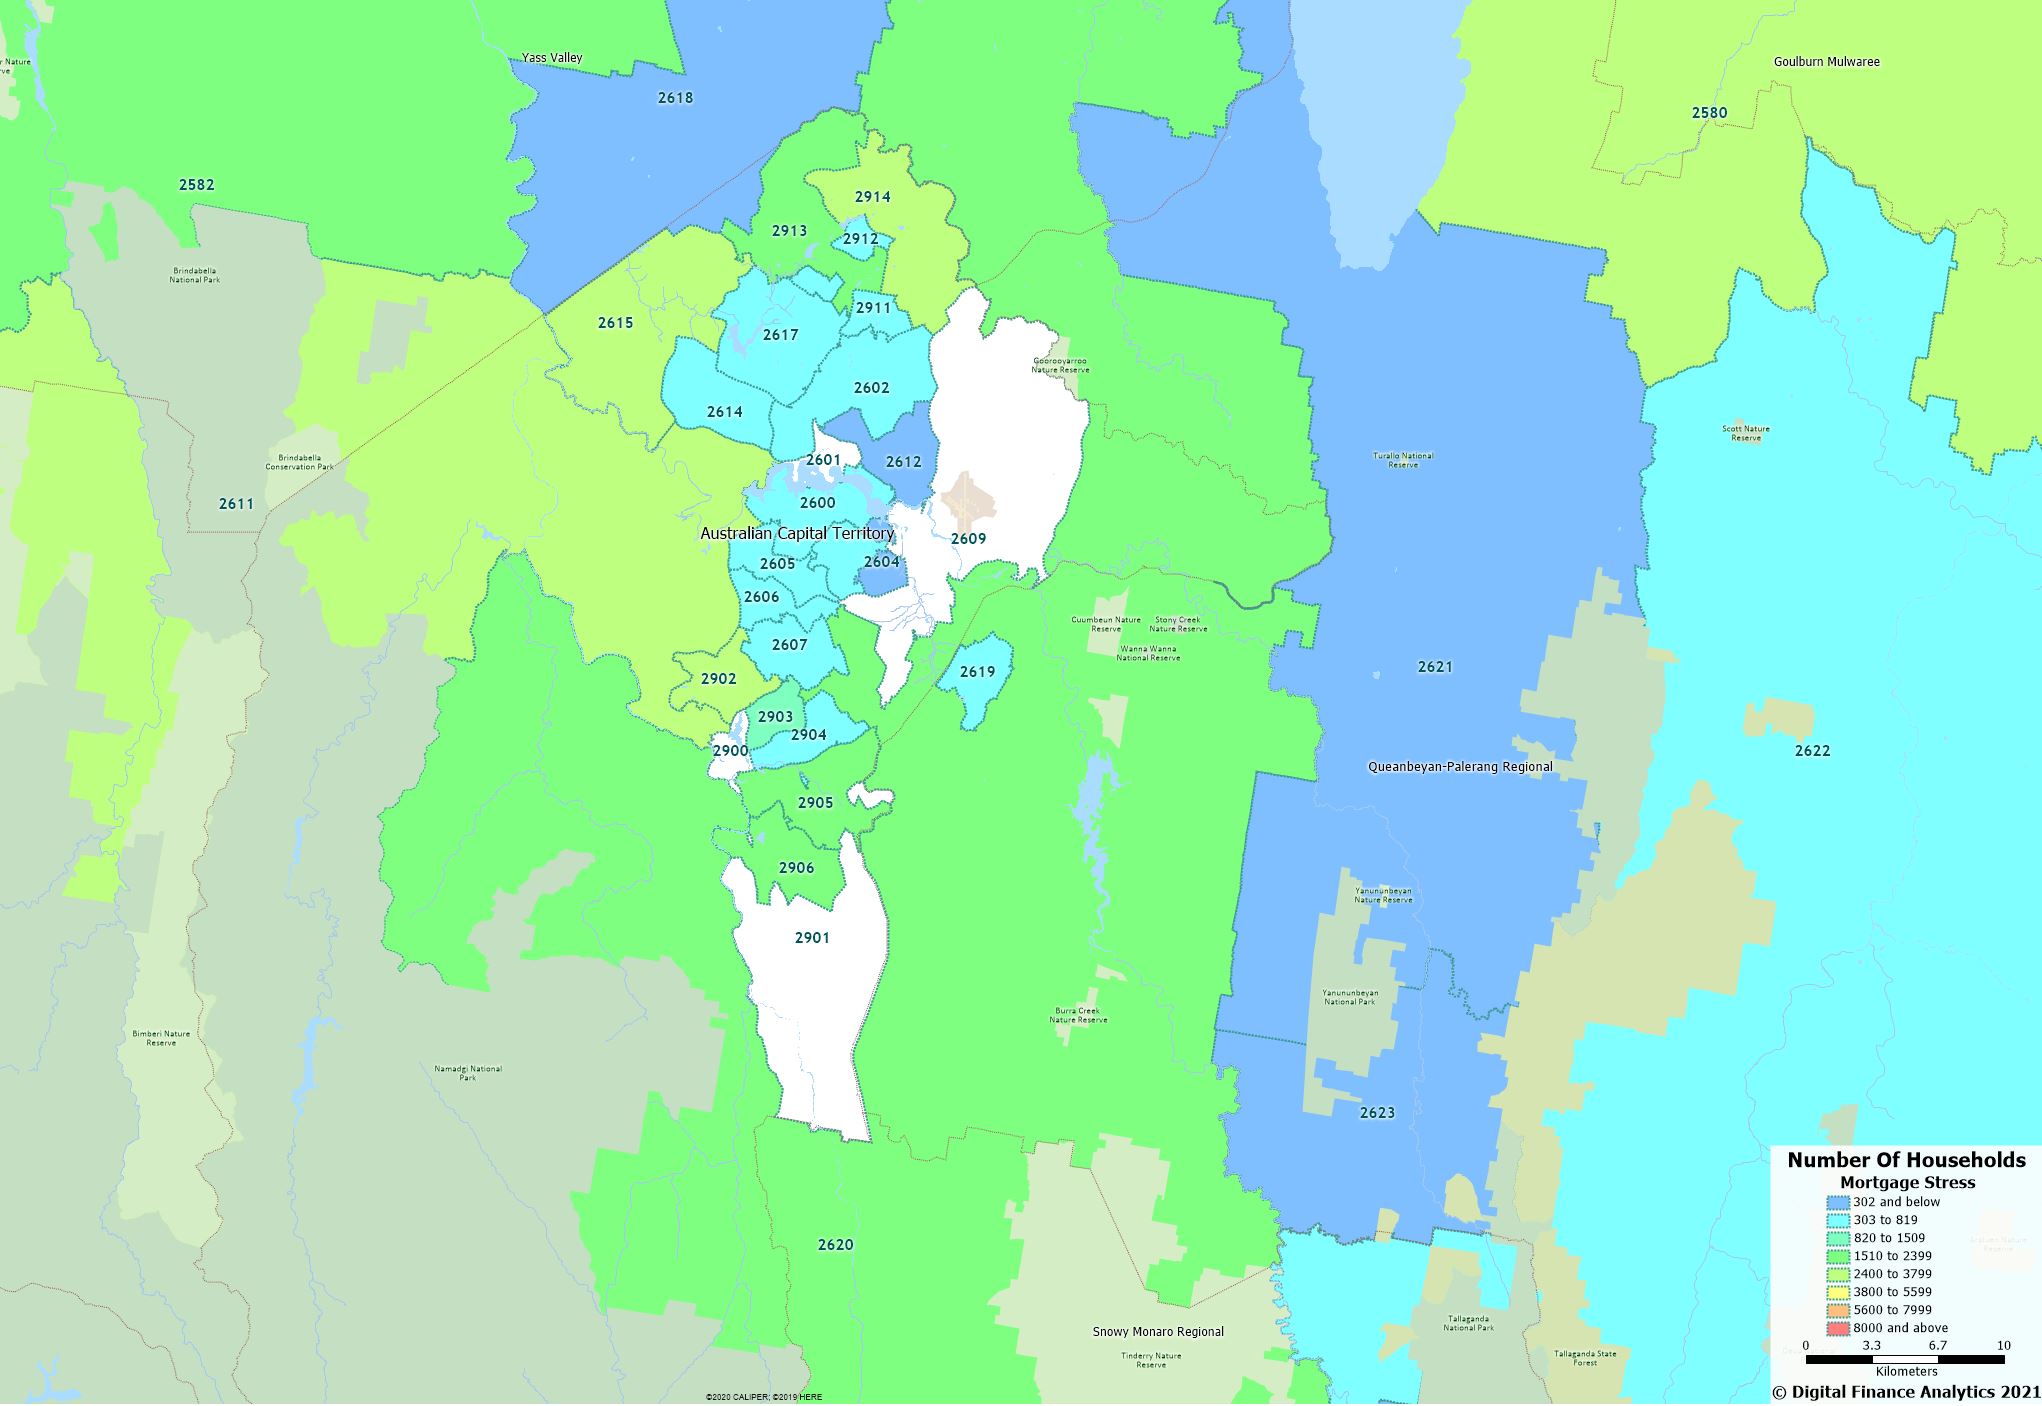
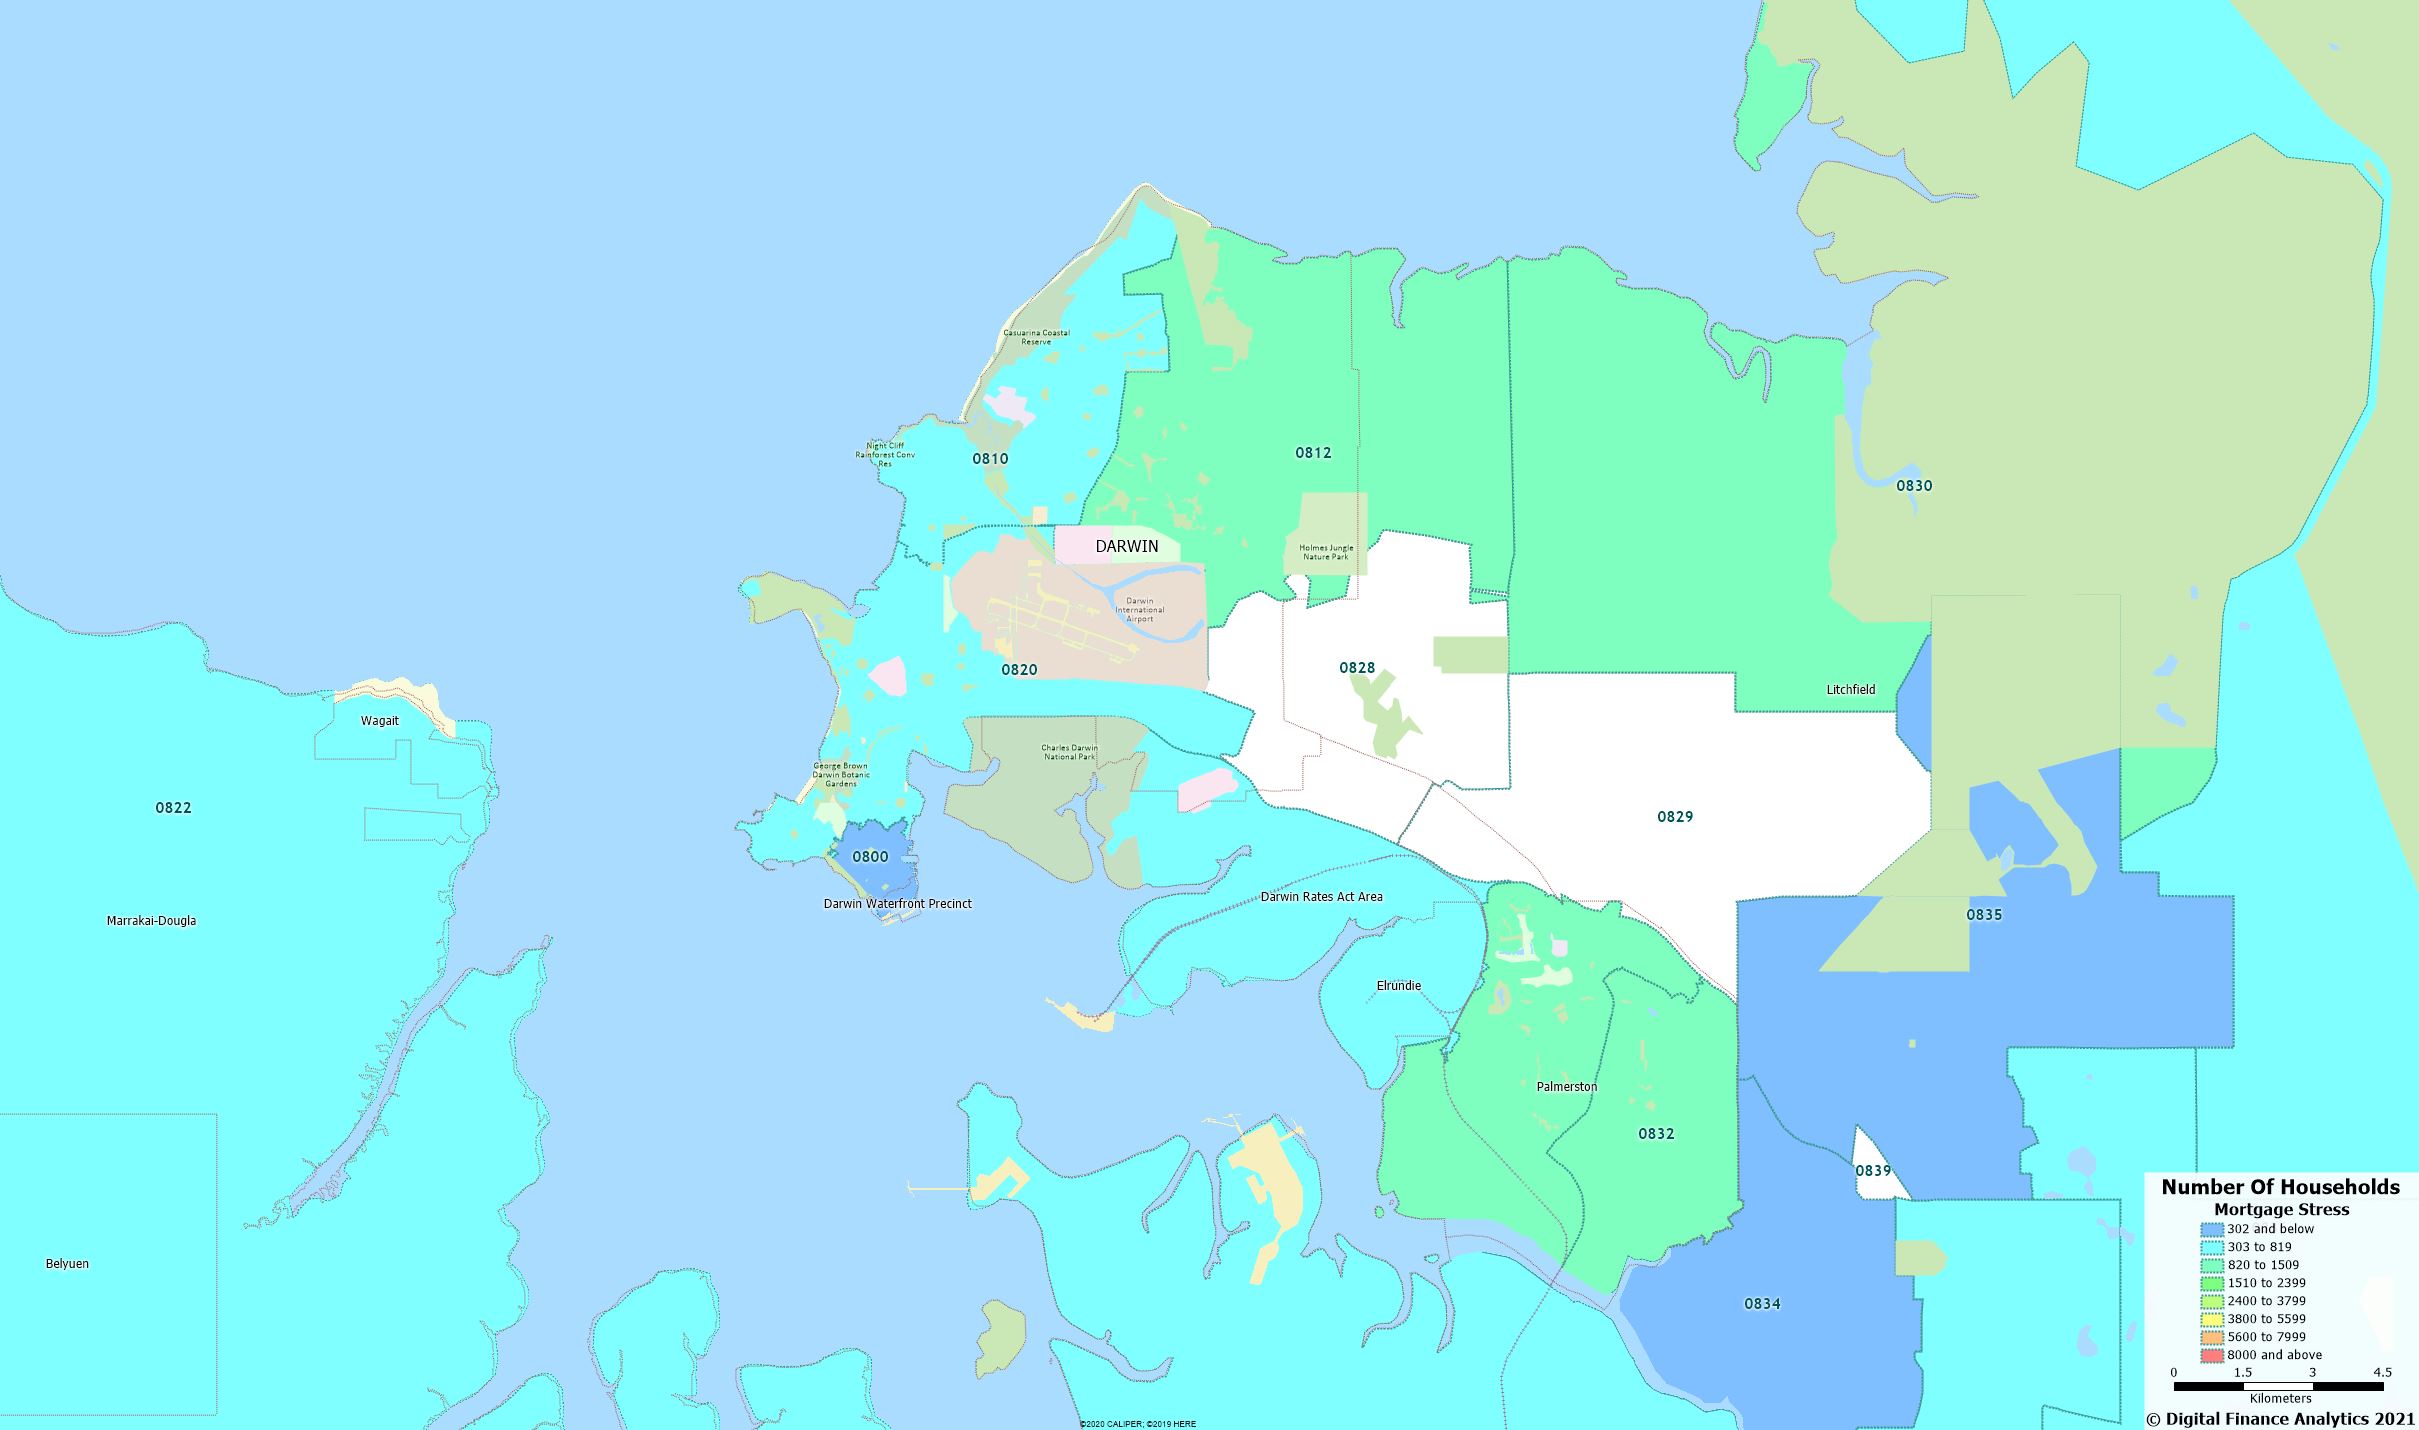
The mortgage stress counts are highest in high growth corridors in WA and VIC – where in some cases more than 80% of households in the area have cash flow issues.

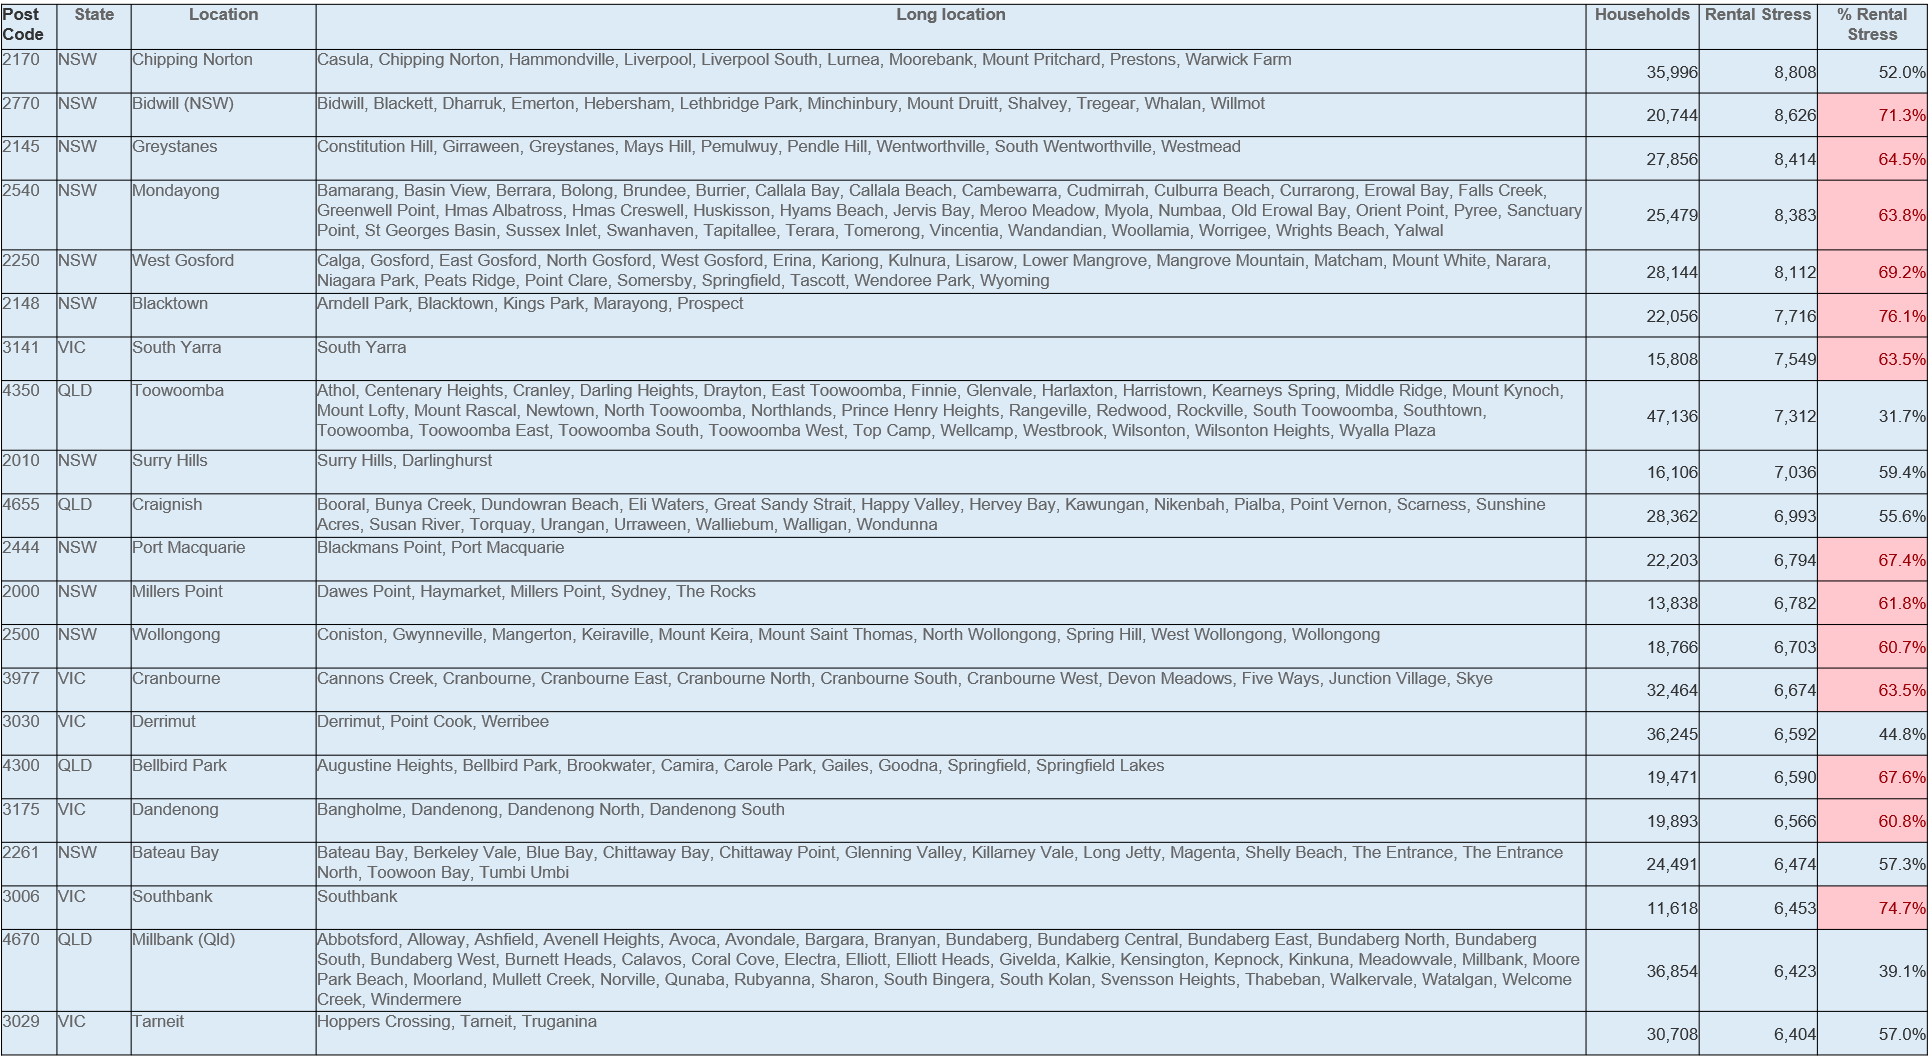
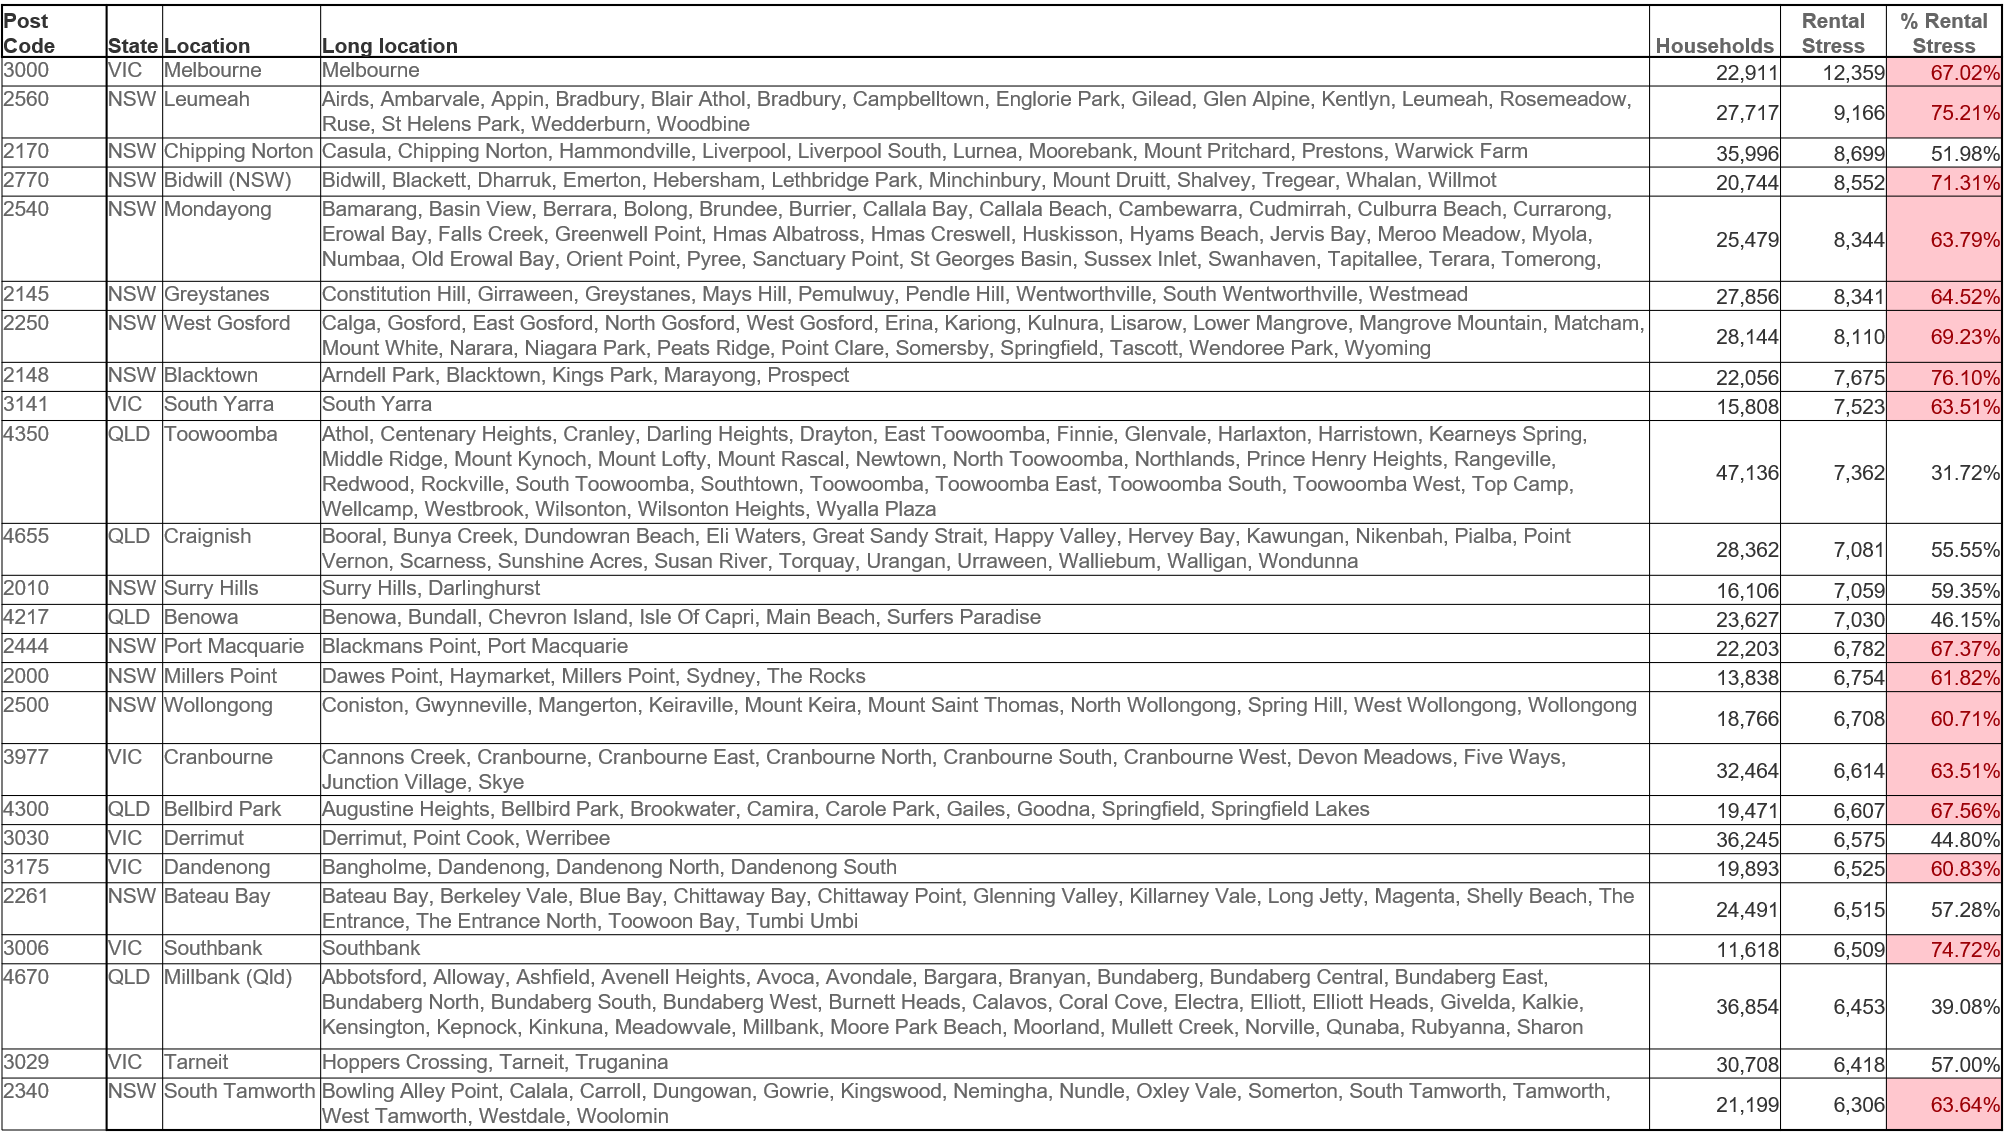
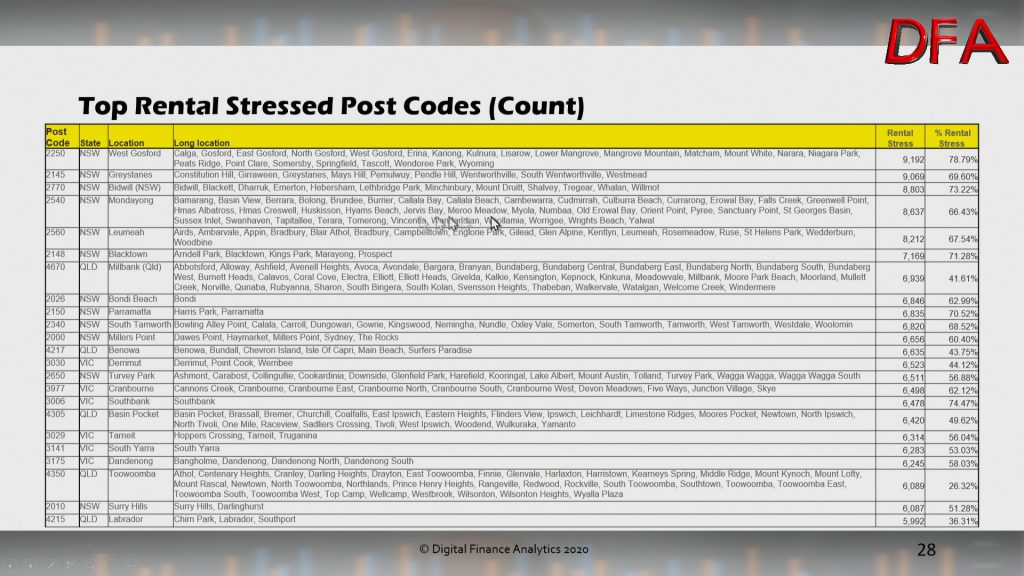
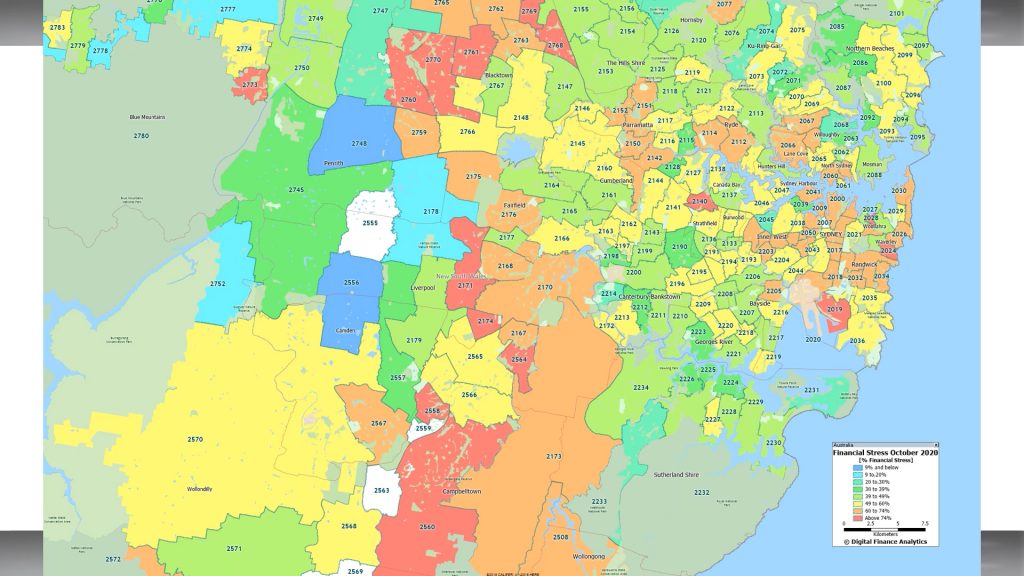
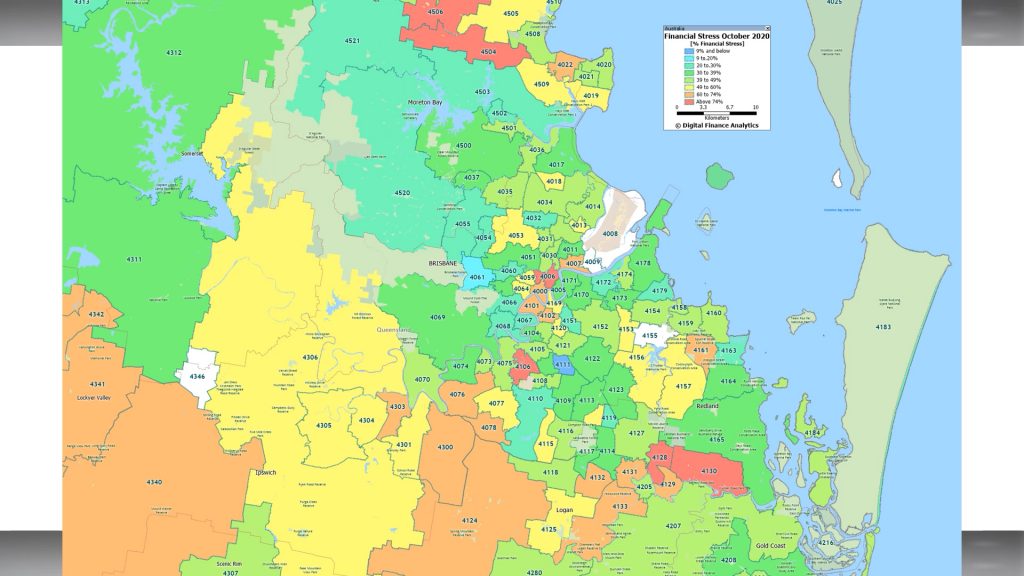
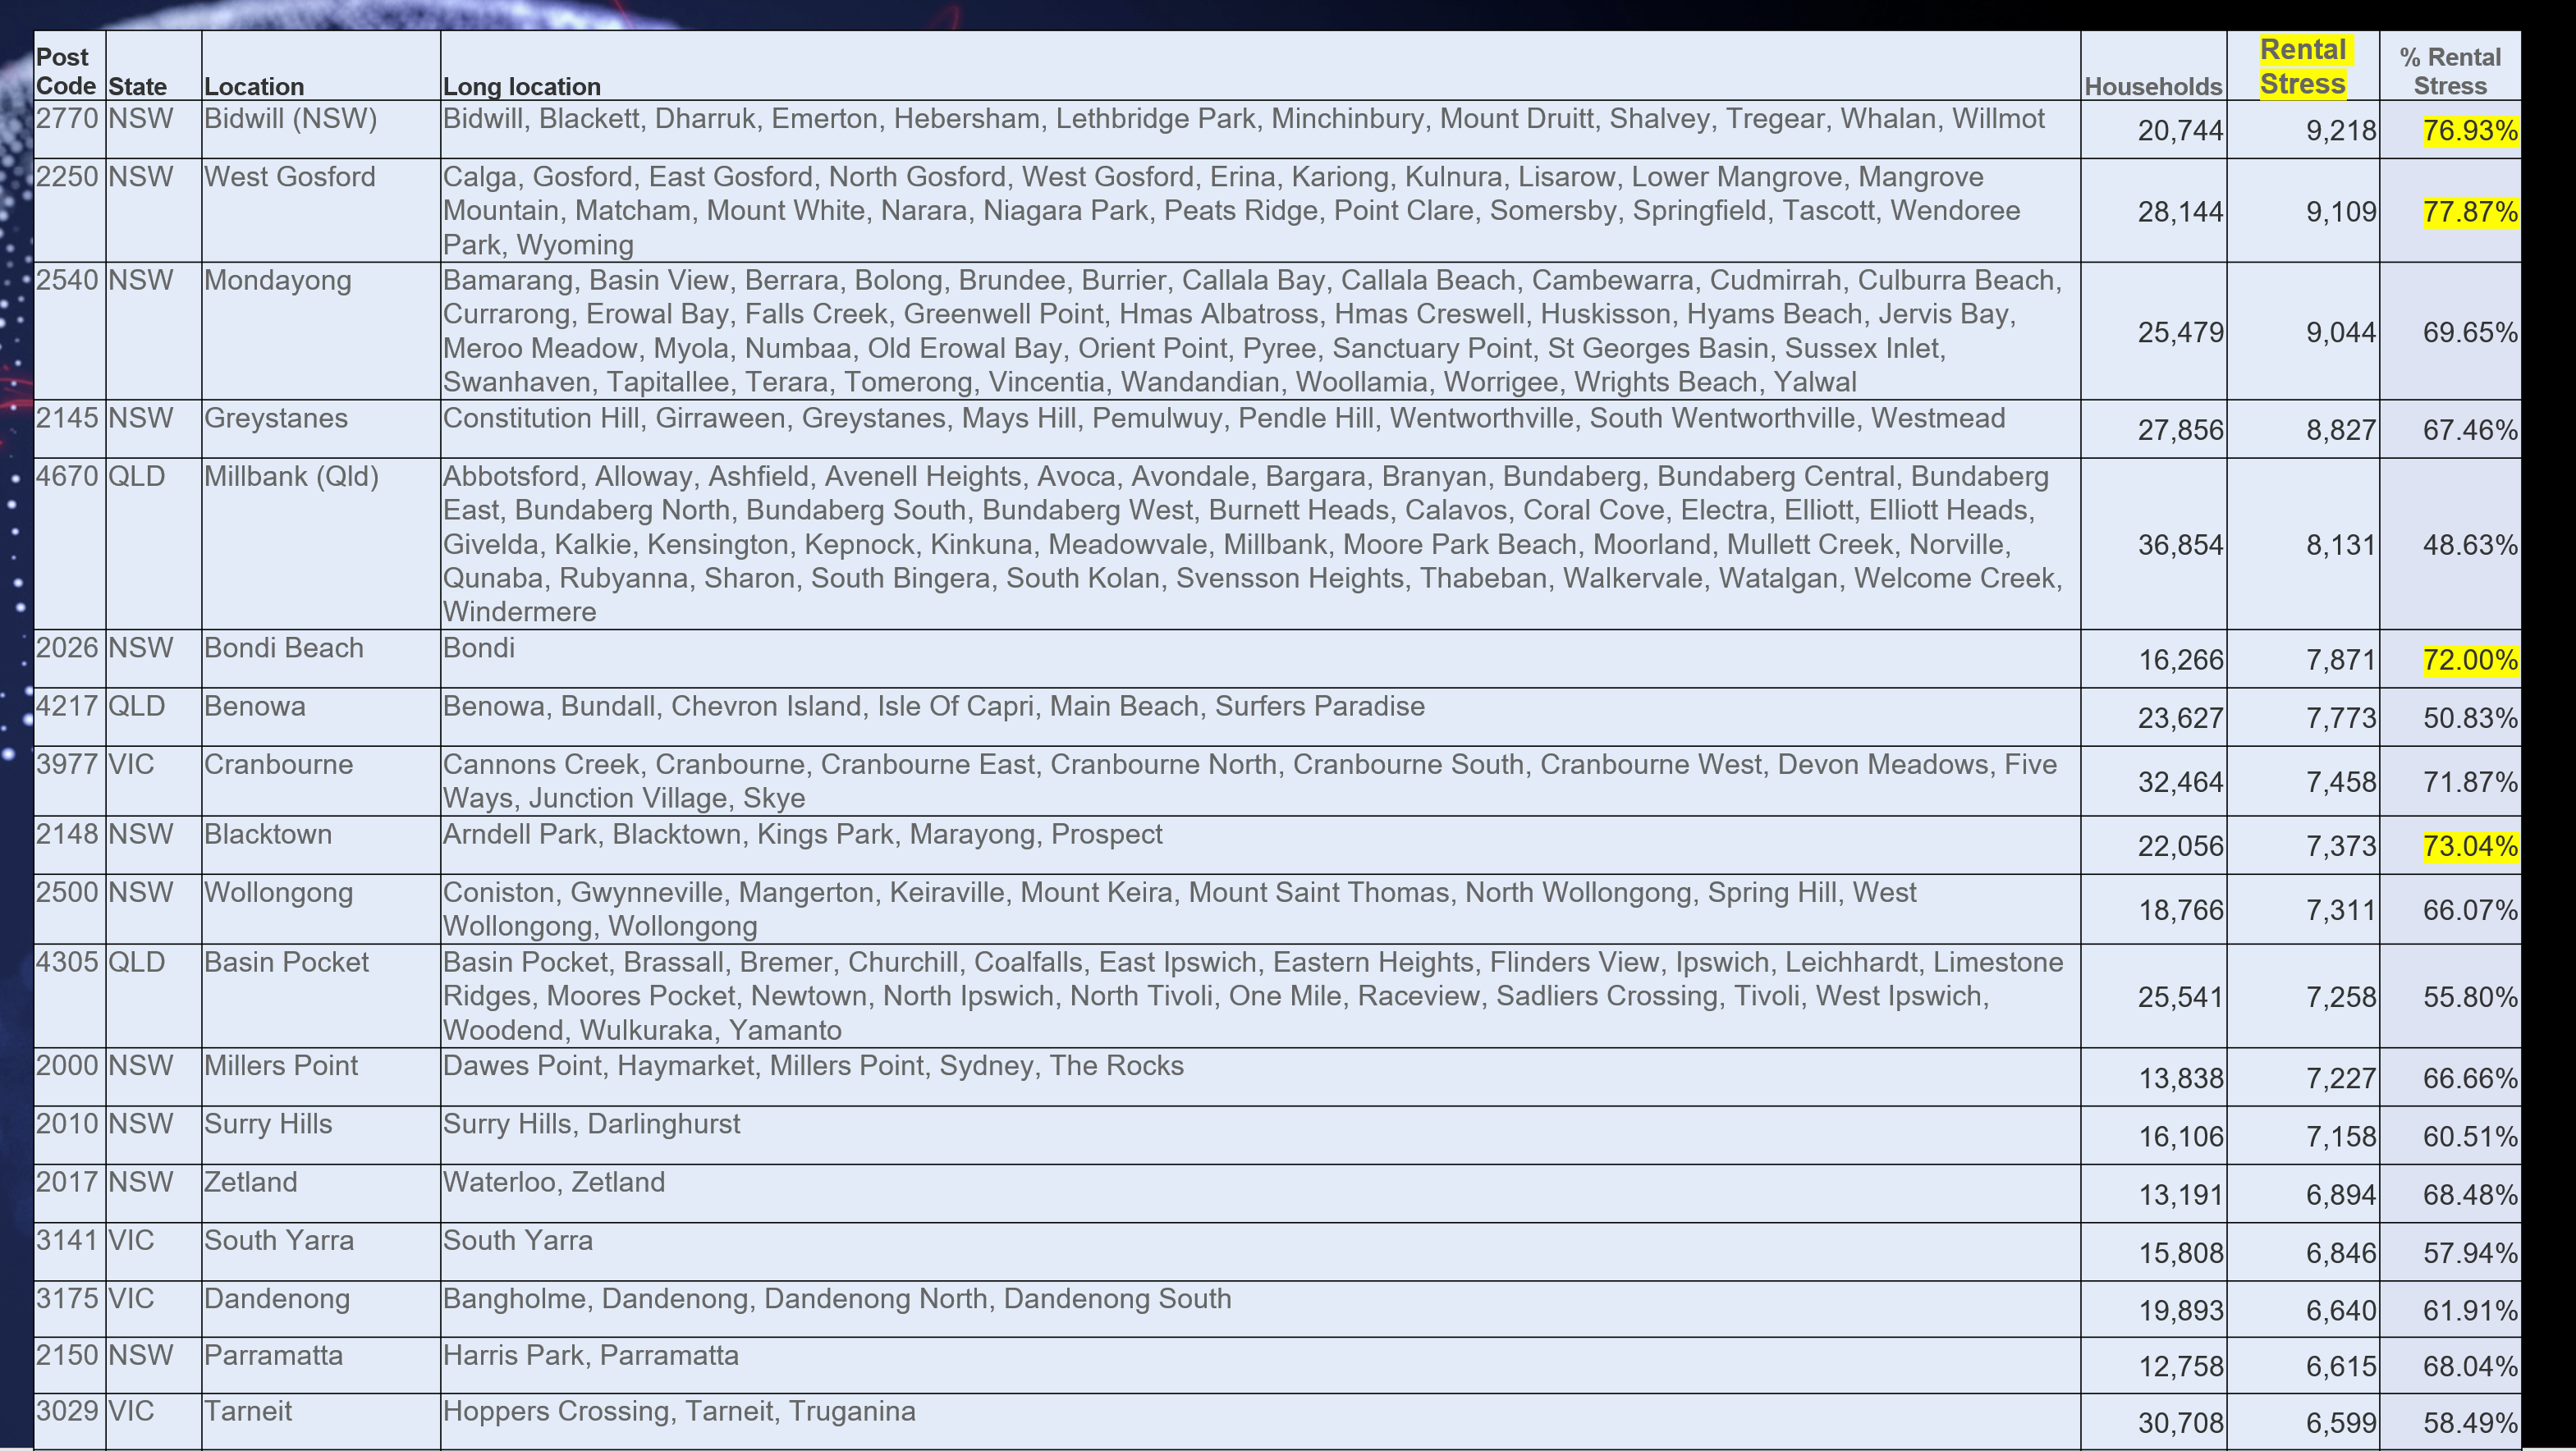
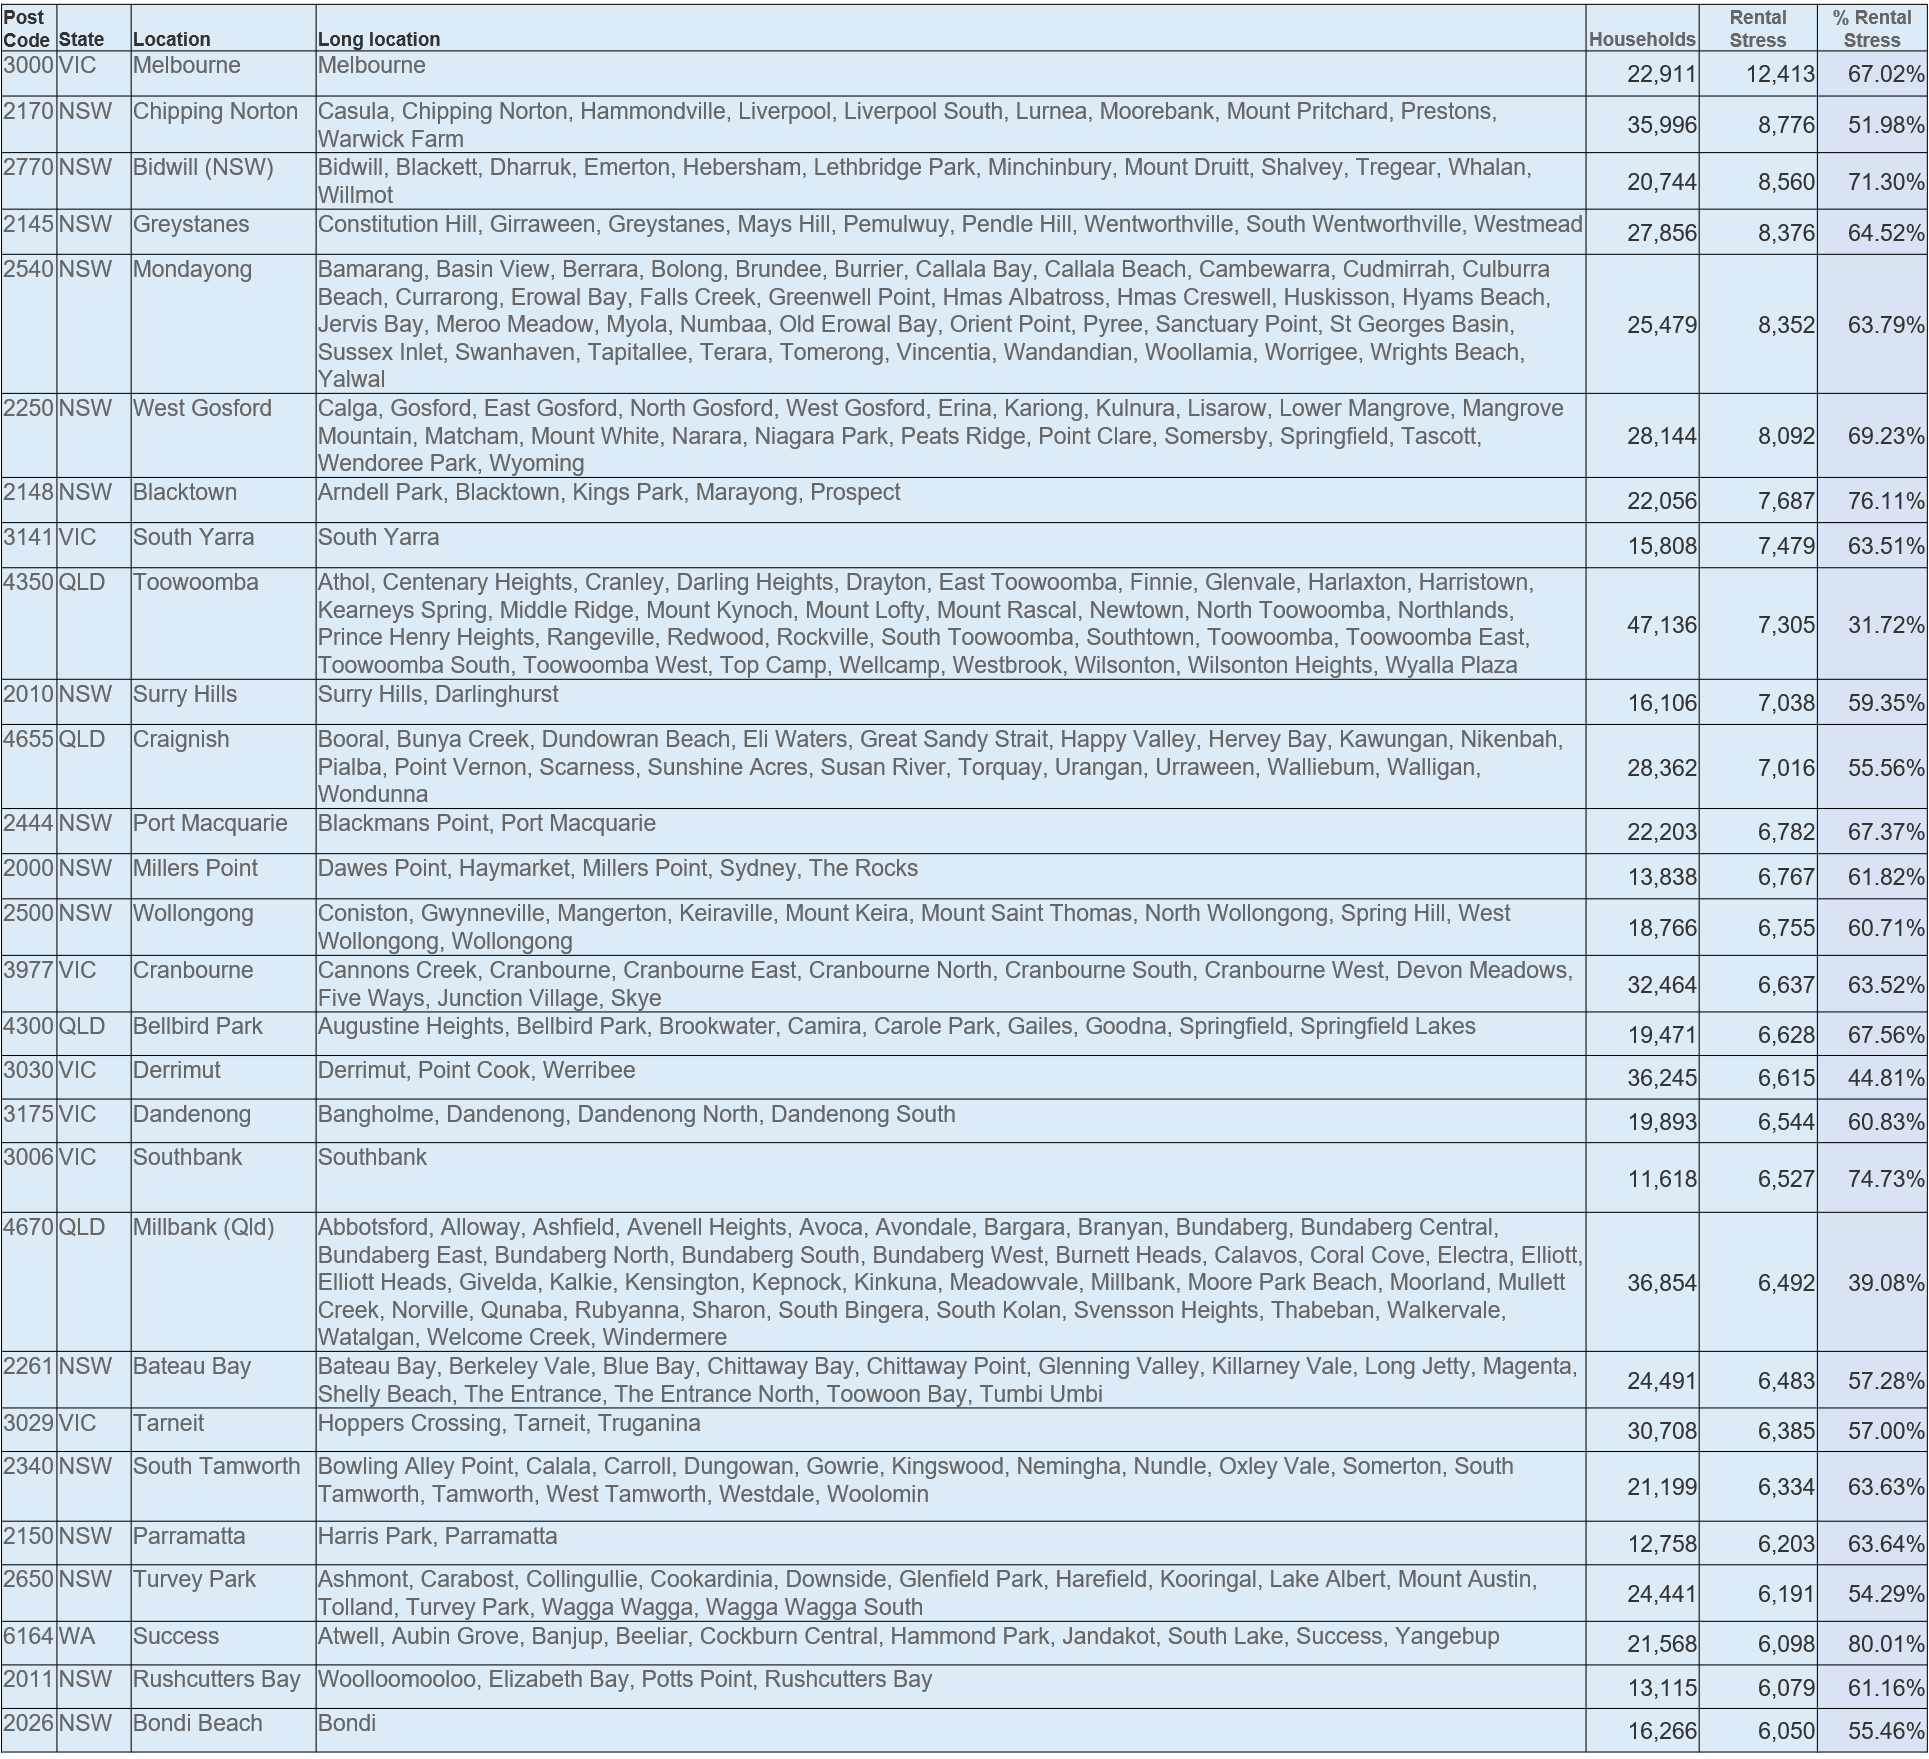
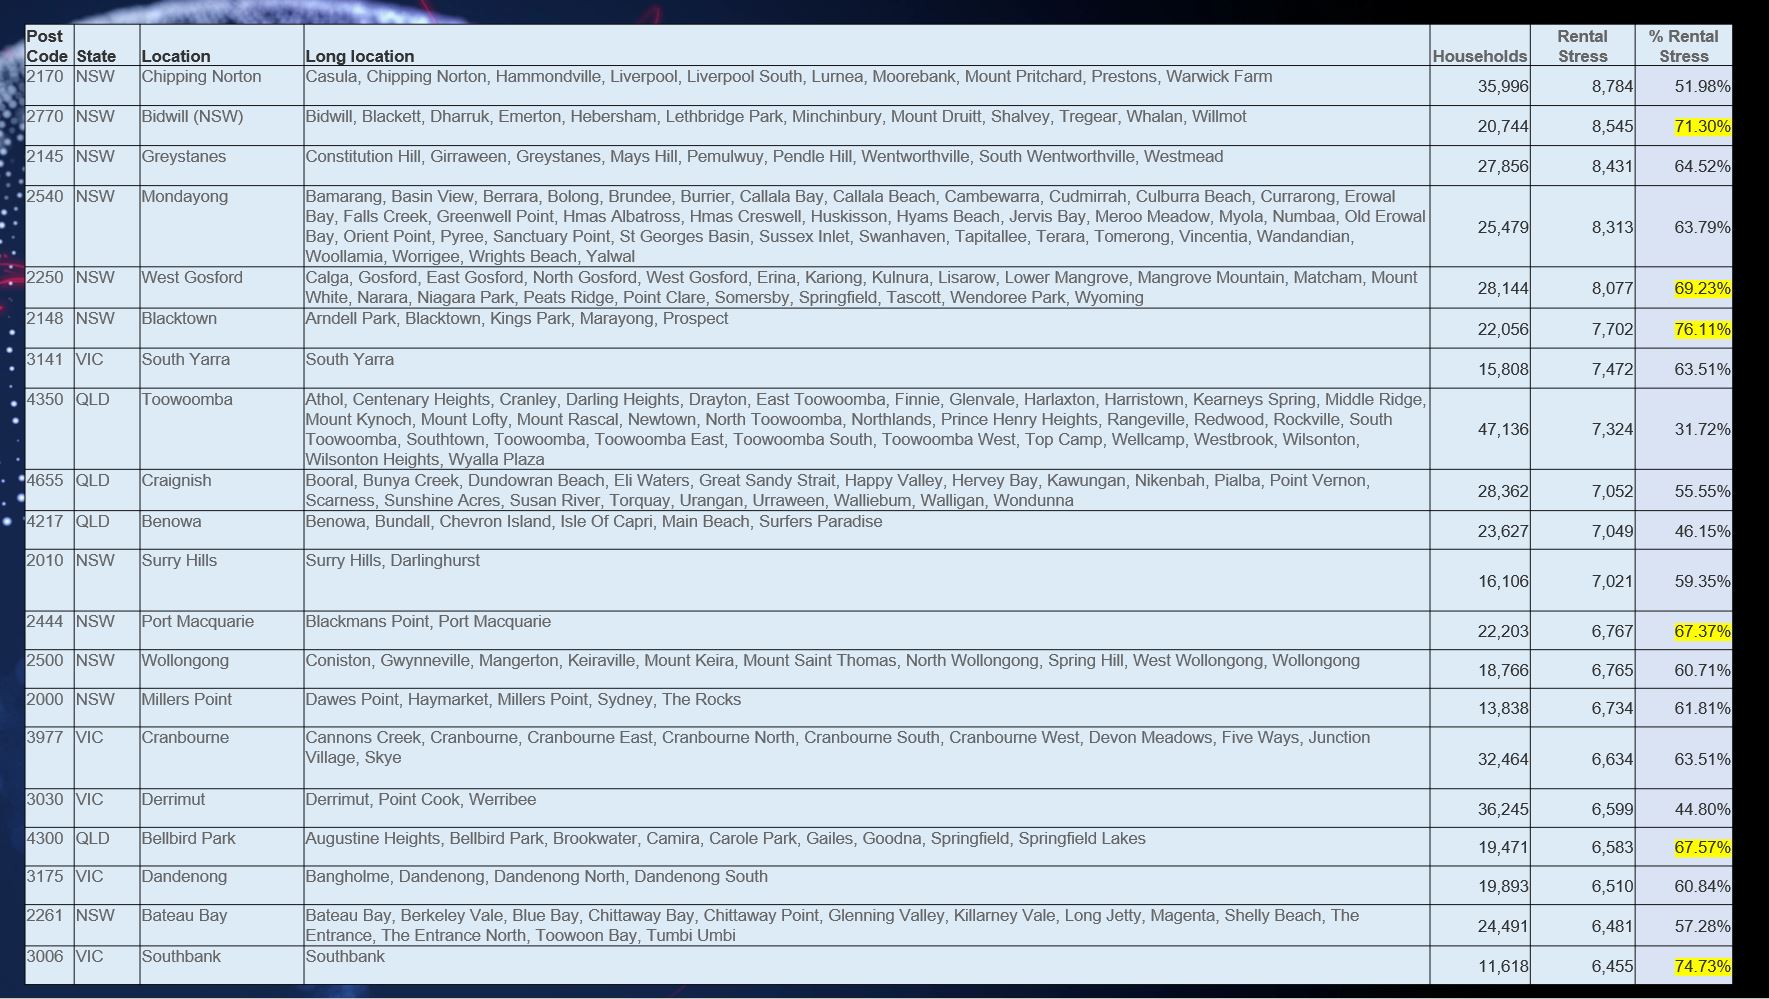
Rental stress is more strongly registered in NSW and QLD, with Western Sydney and the Central Coast and Bundaberg in the top 10.

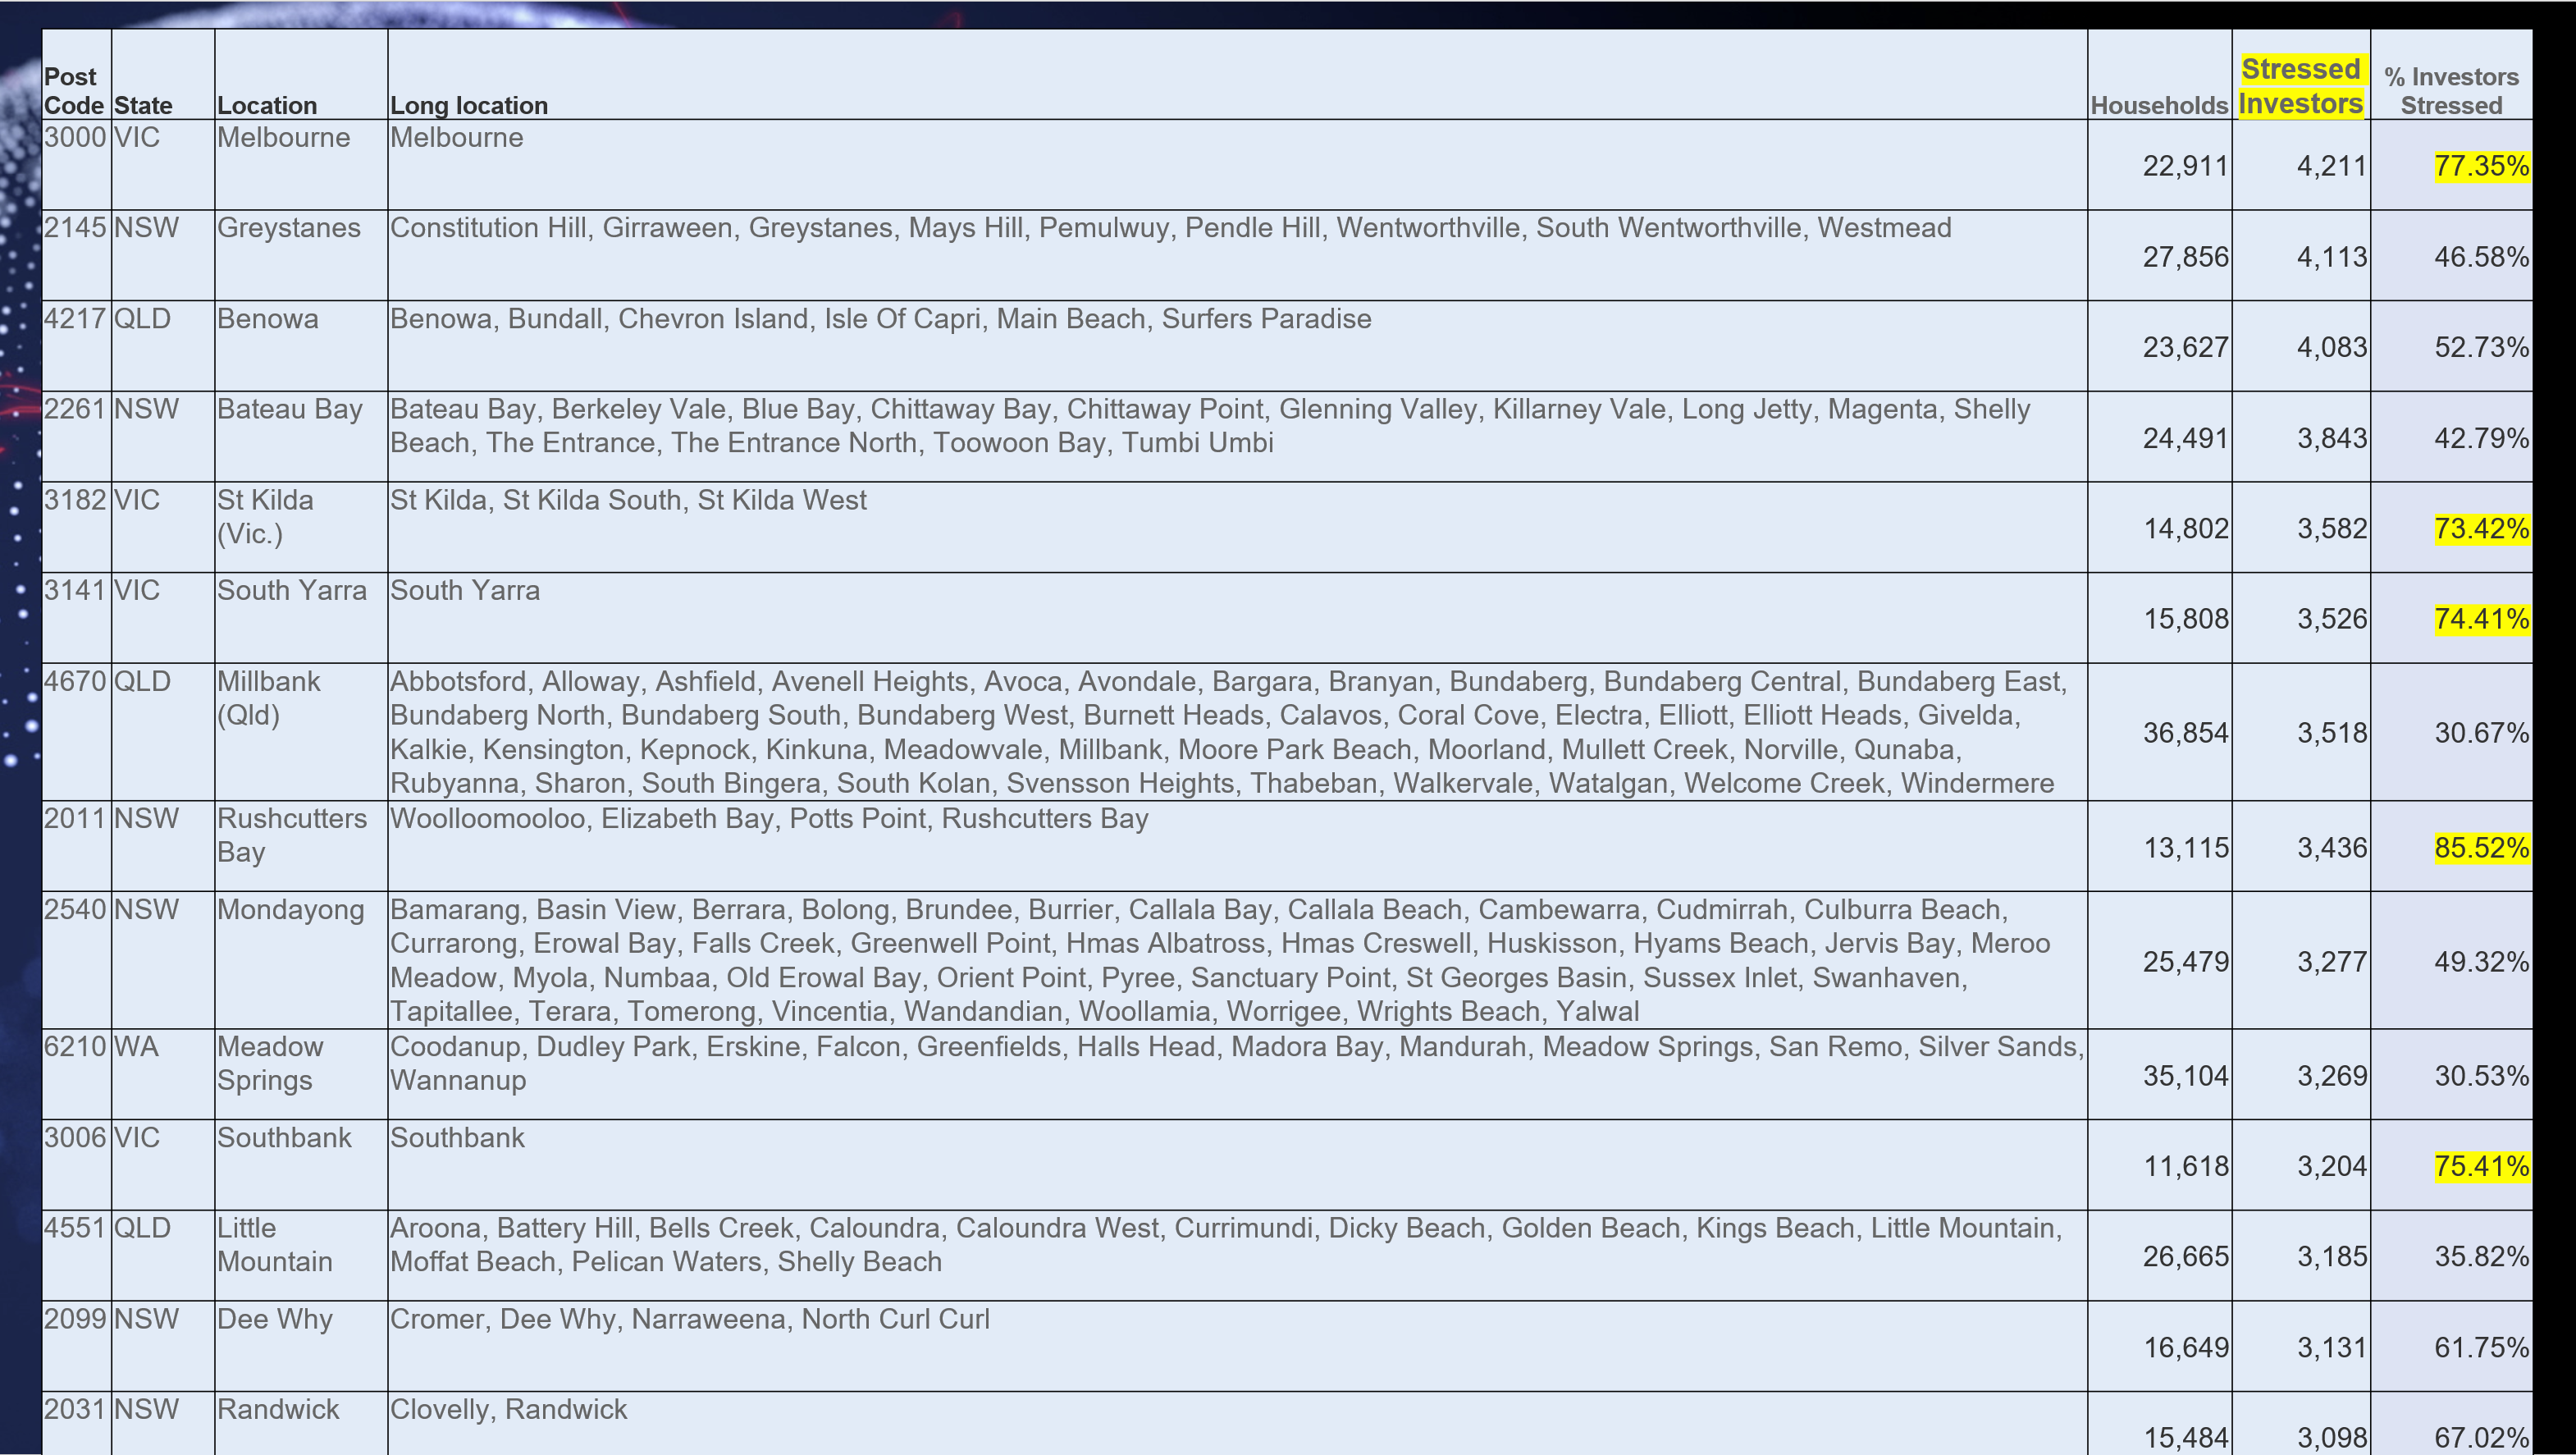
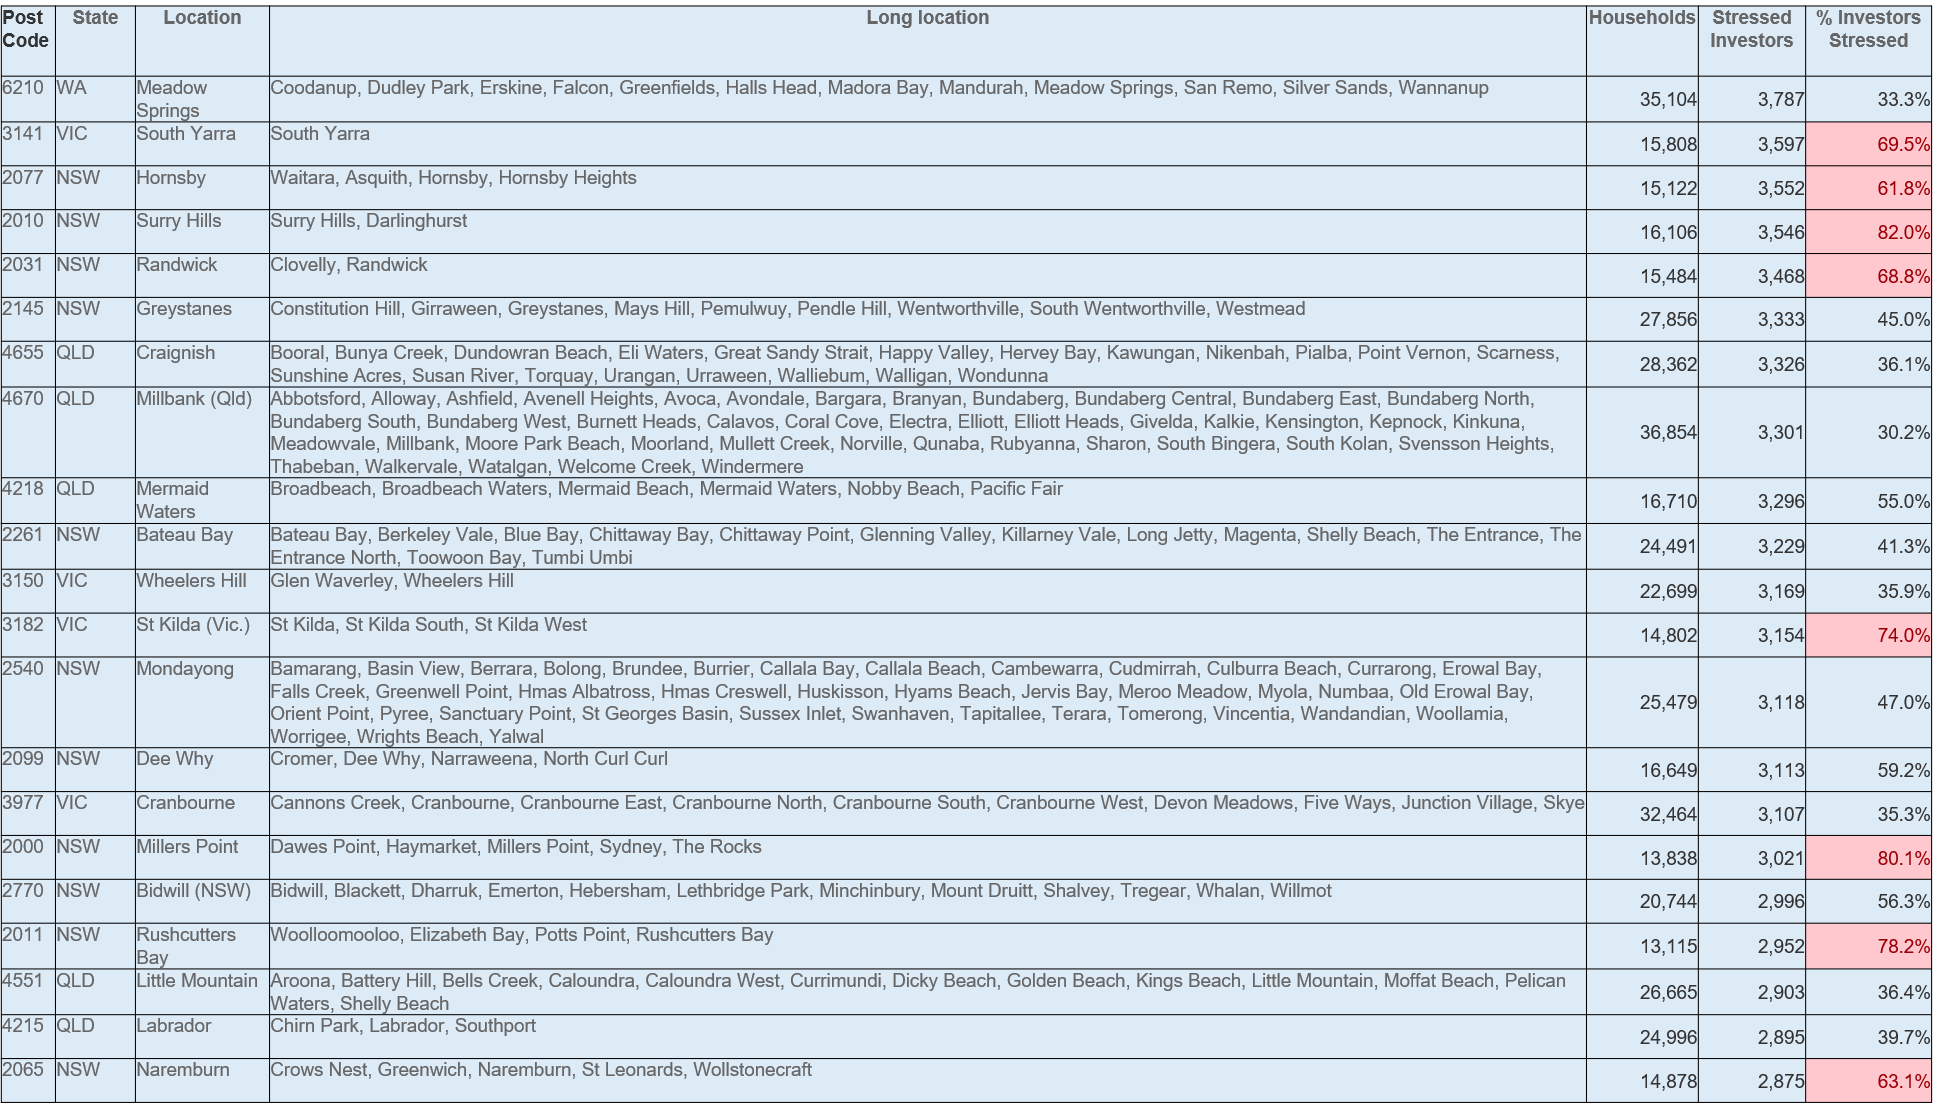
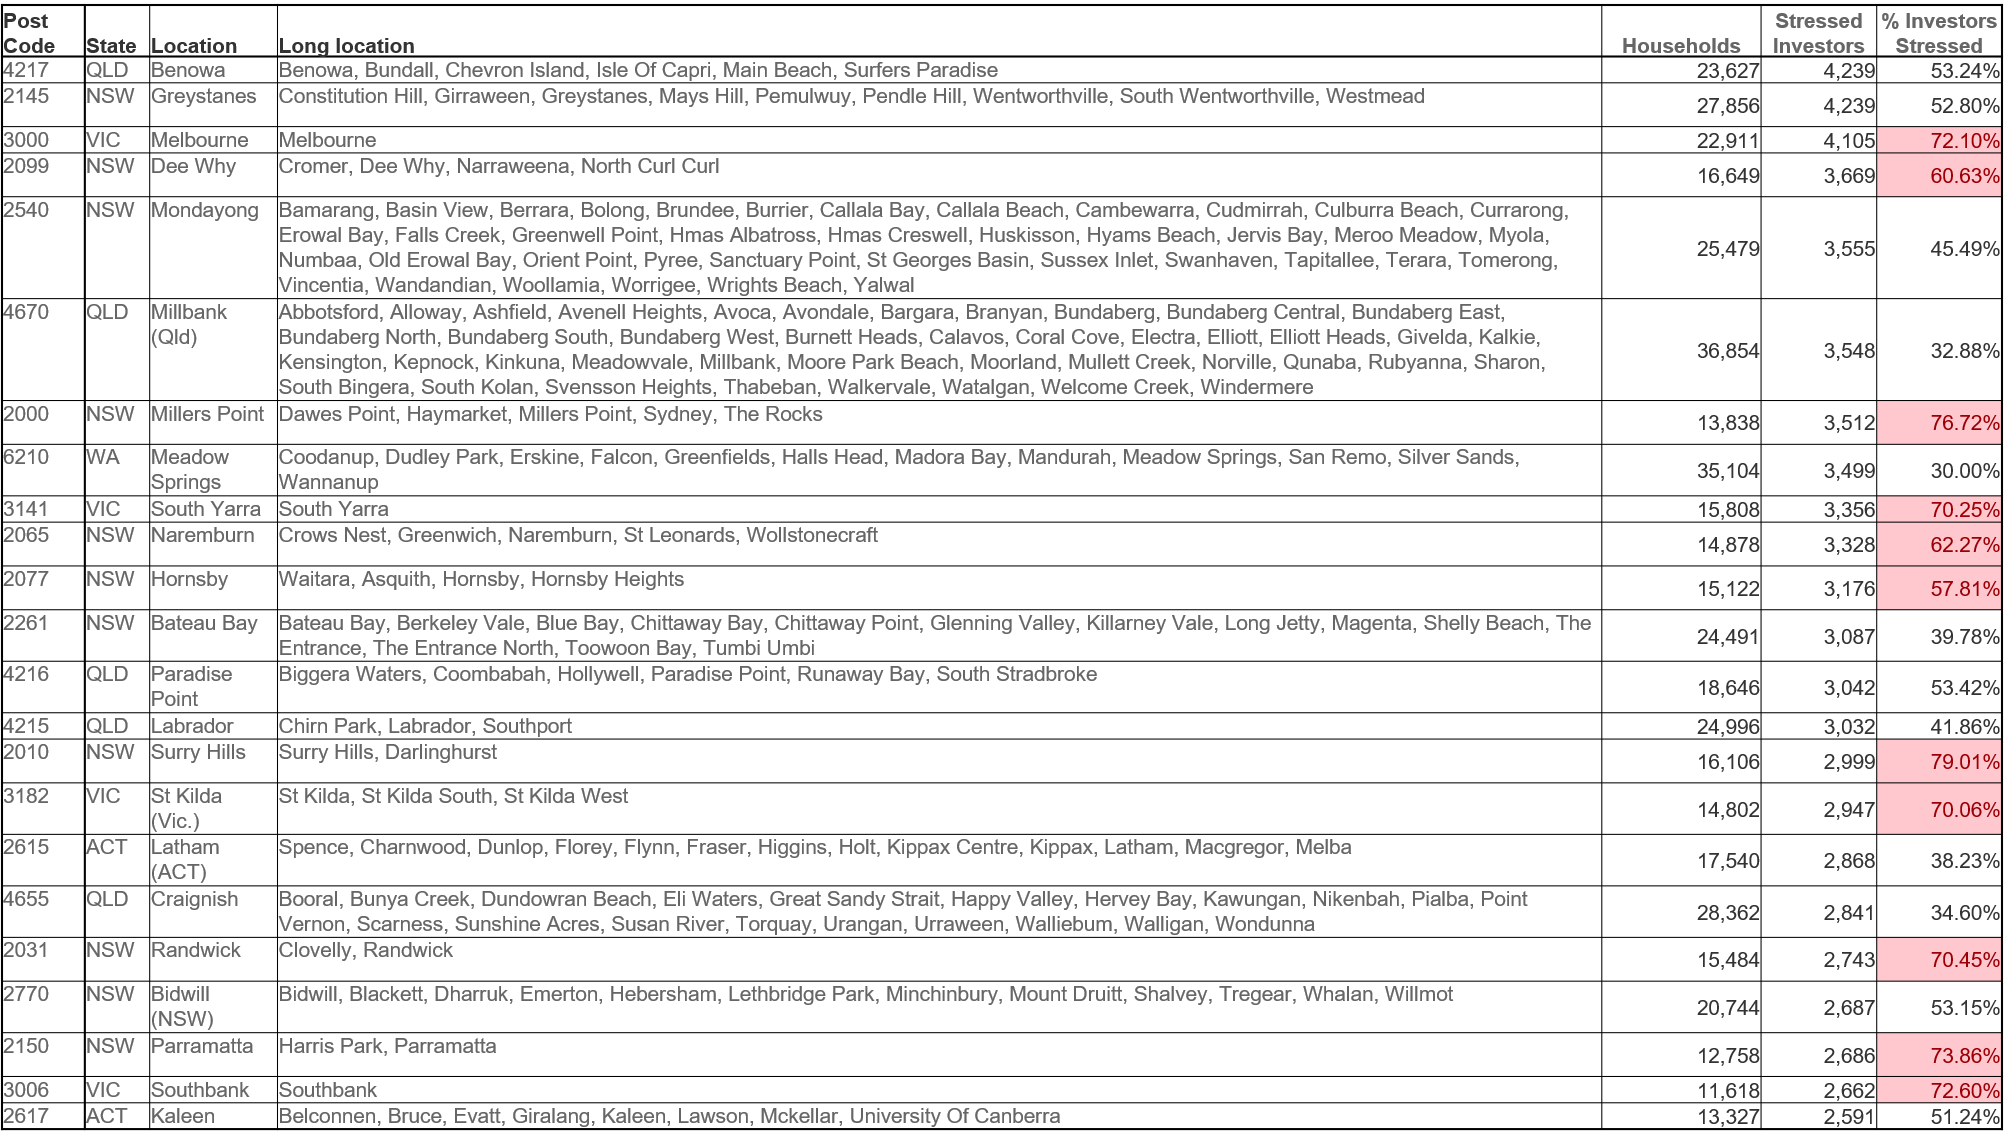
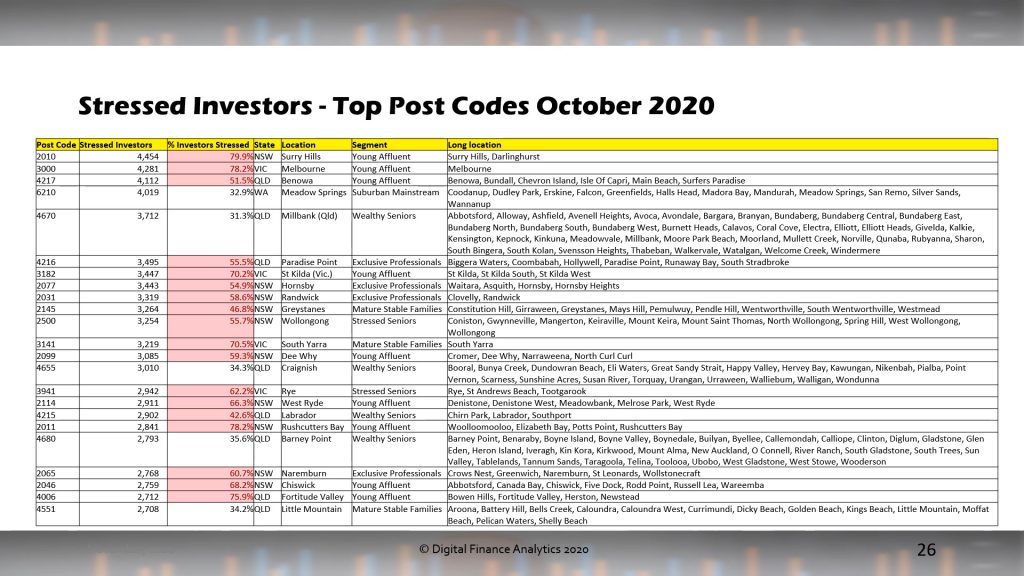
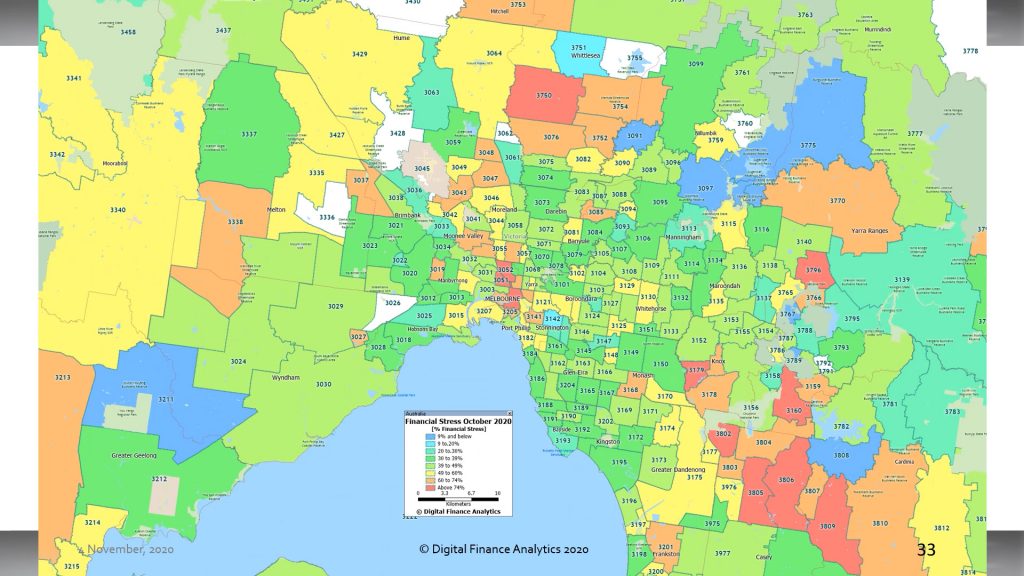
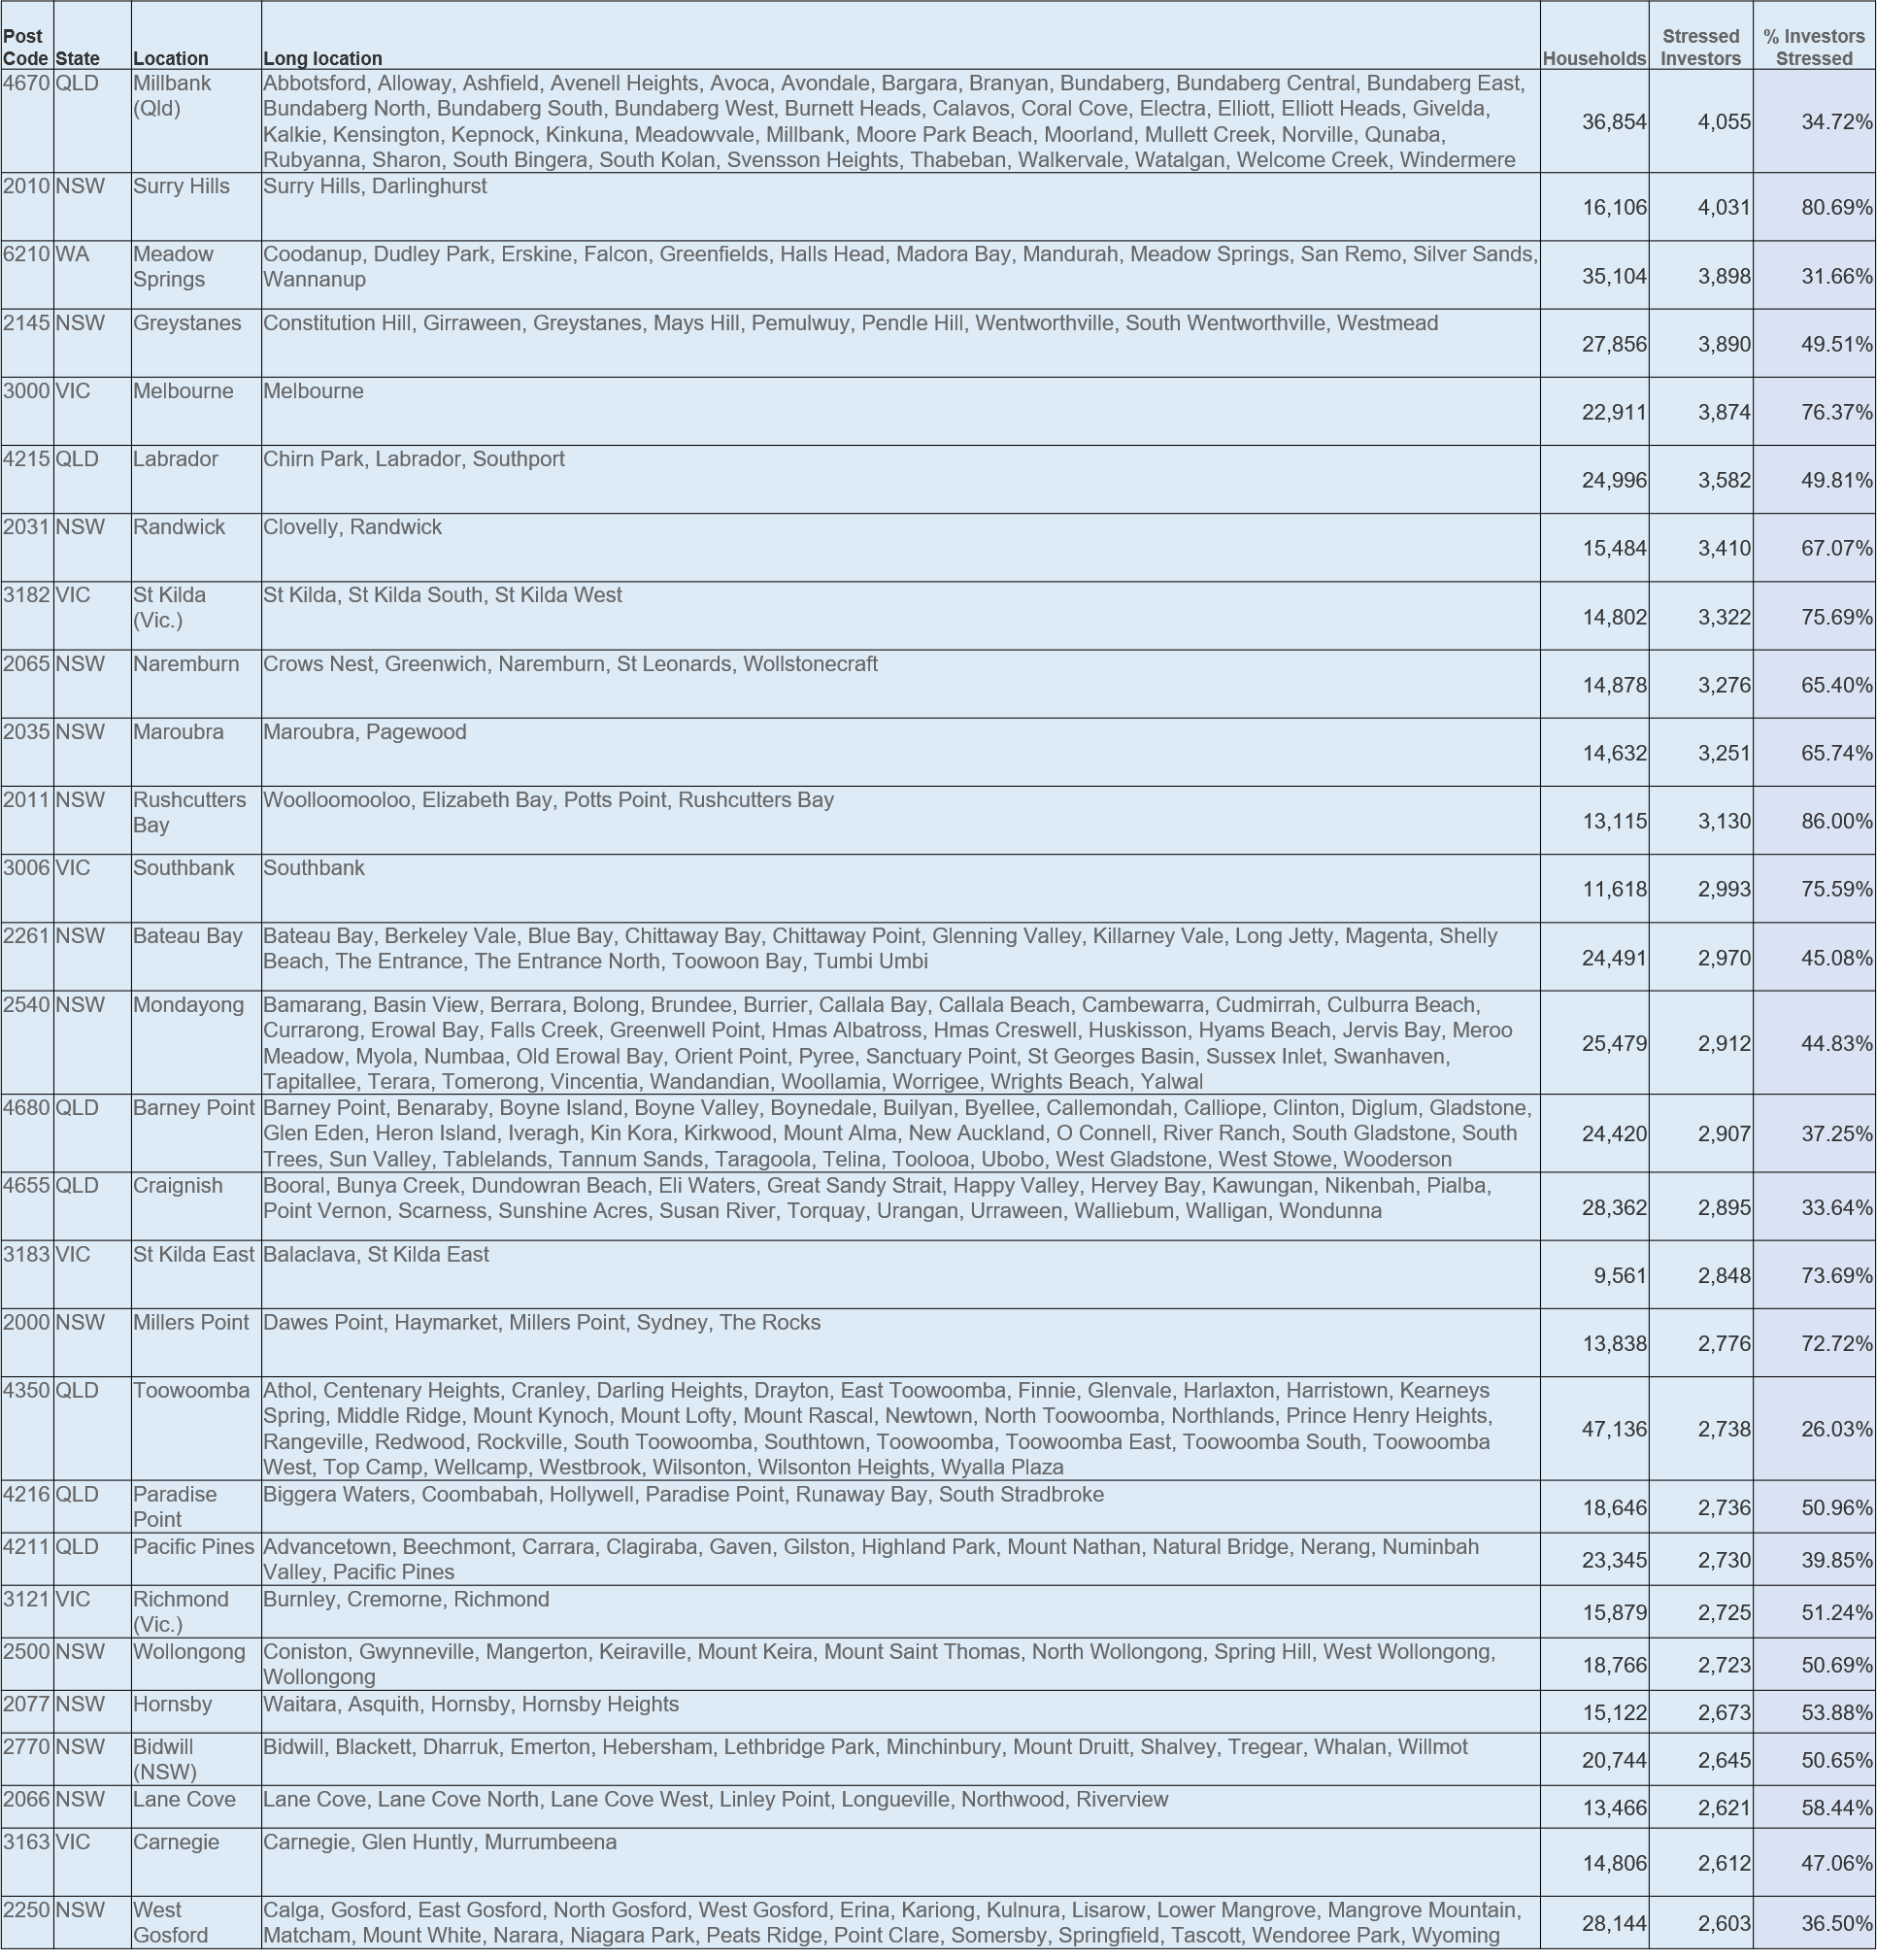
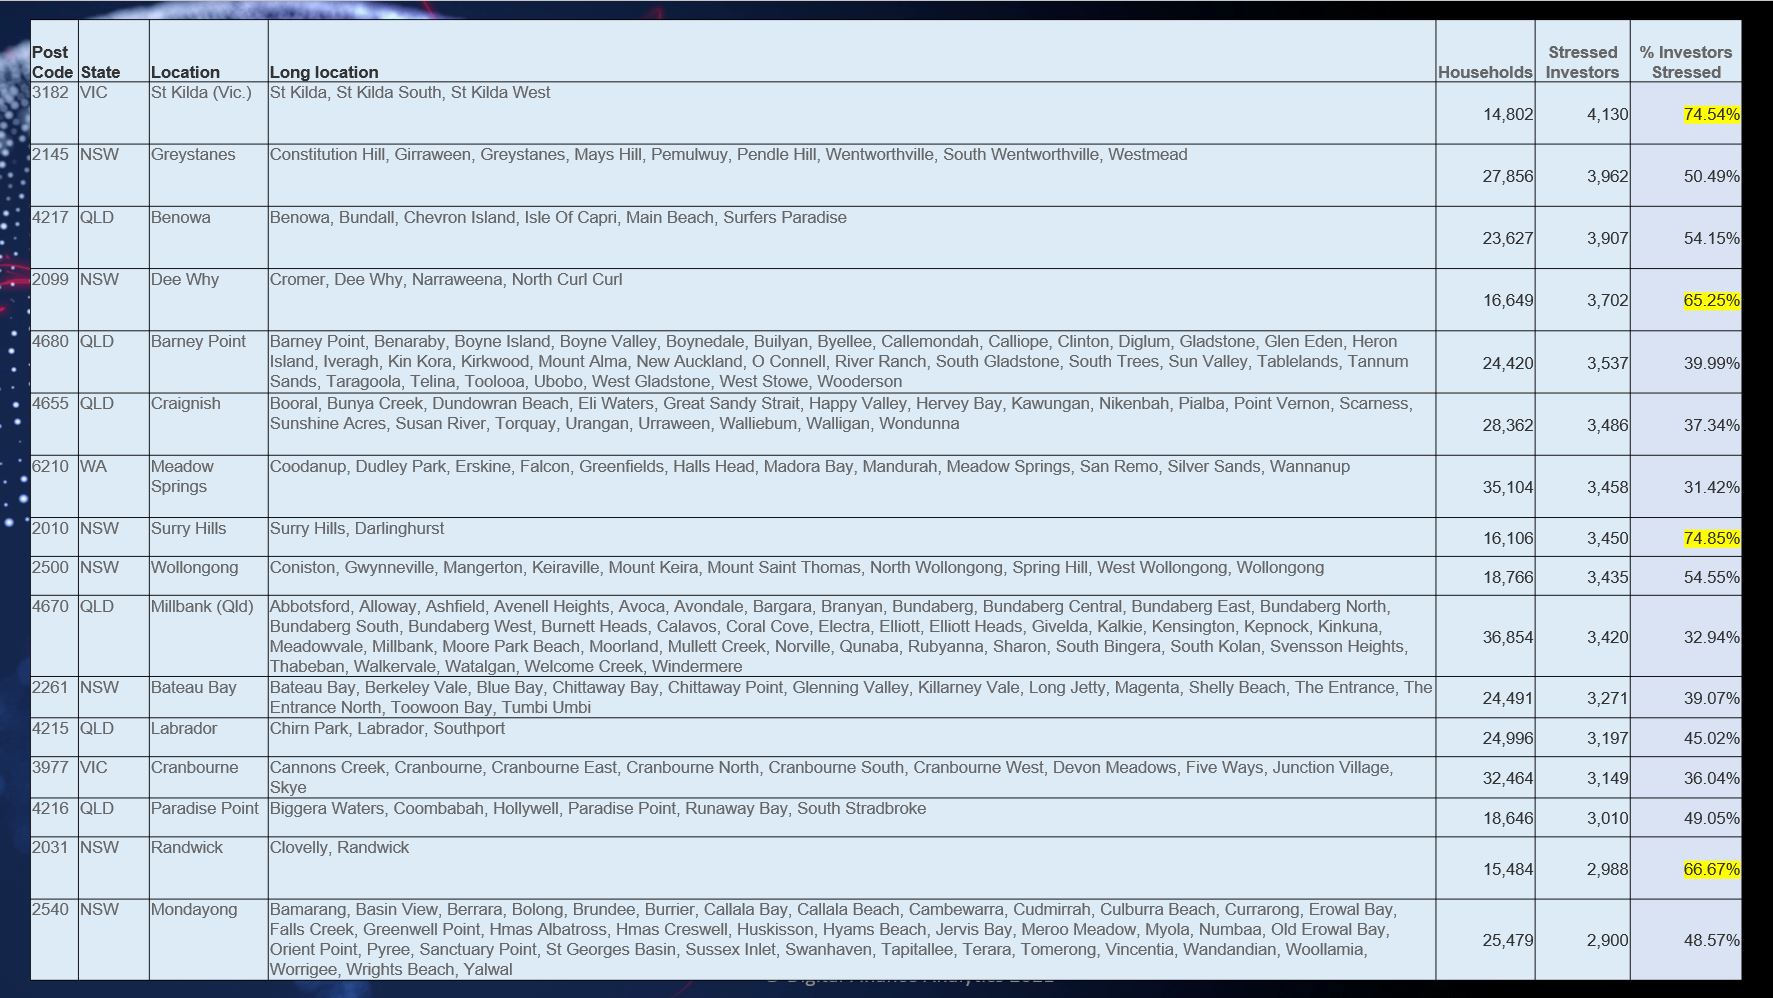
Property investors are having difficulty in Melbourne 3000, thanks to the lack of students and ongoing lock-downs. A number of VIC suburbs are impacted thanks to high vacancy rates, negative net yields and falling apartment values.

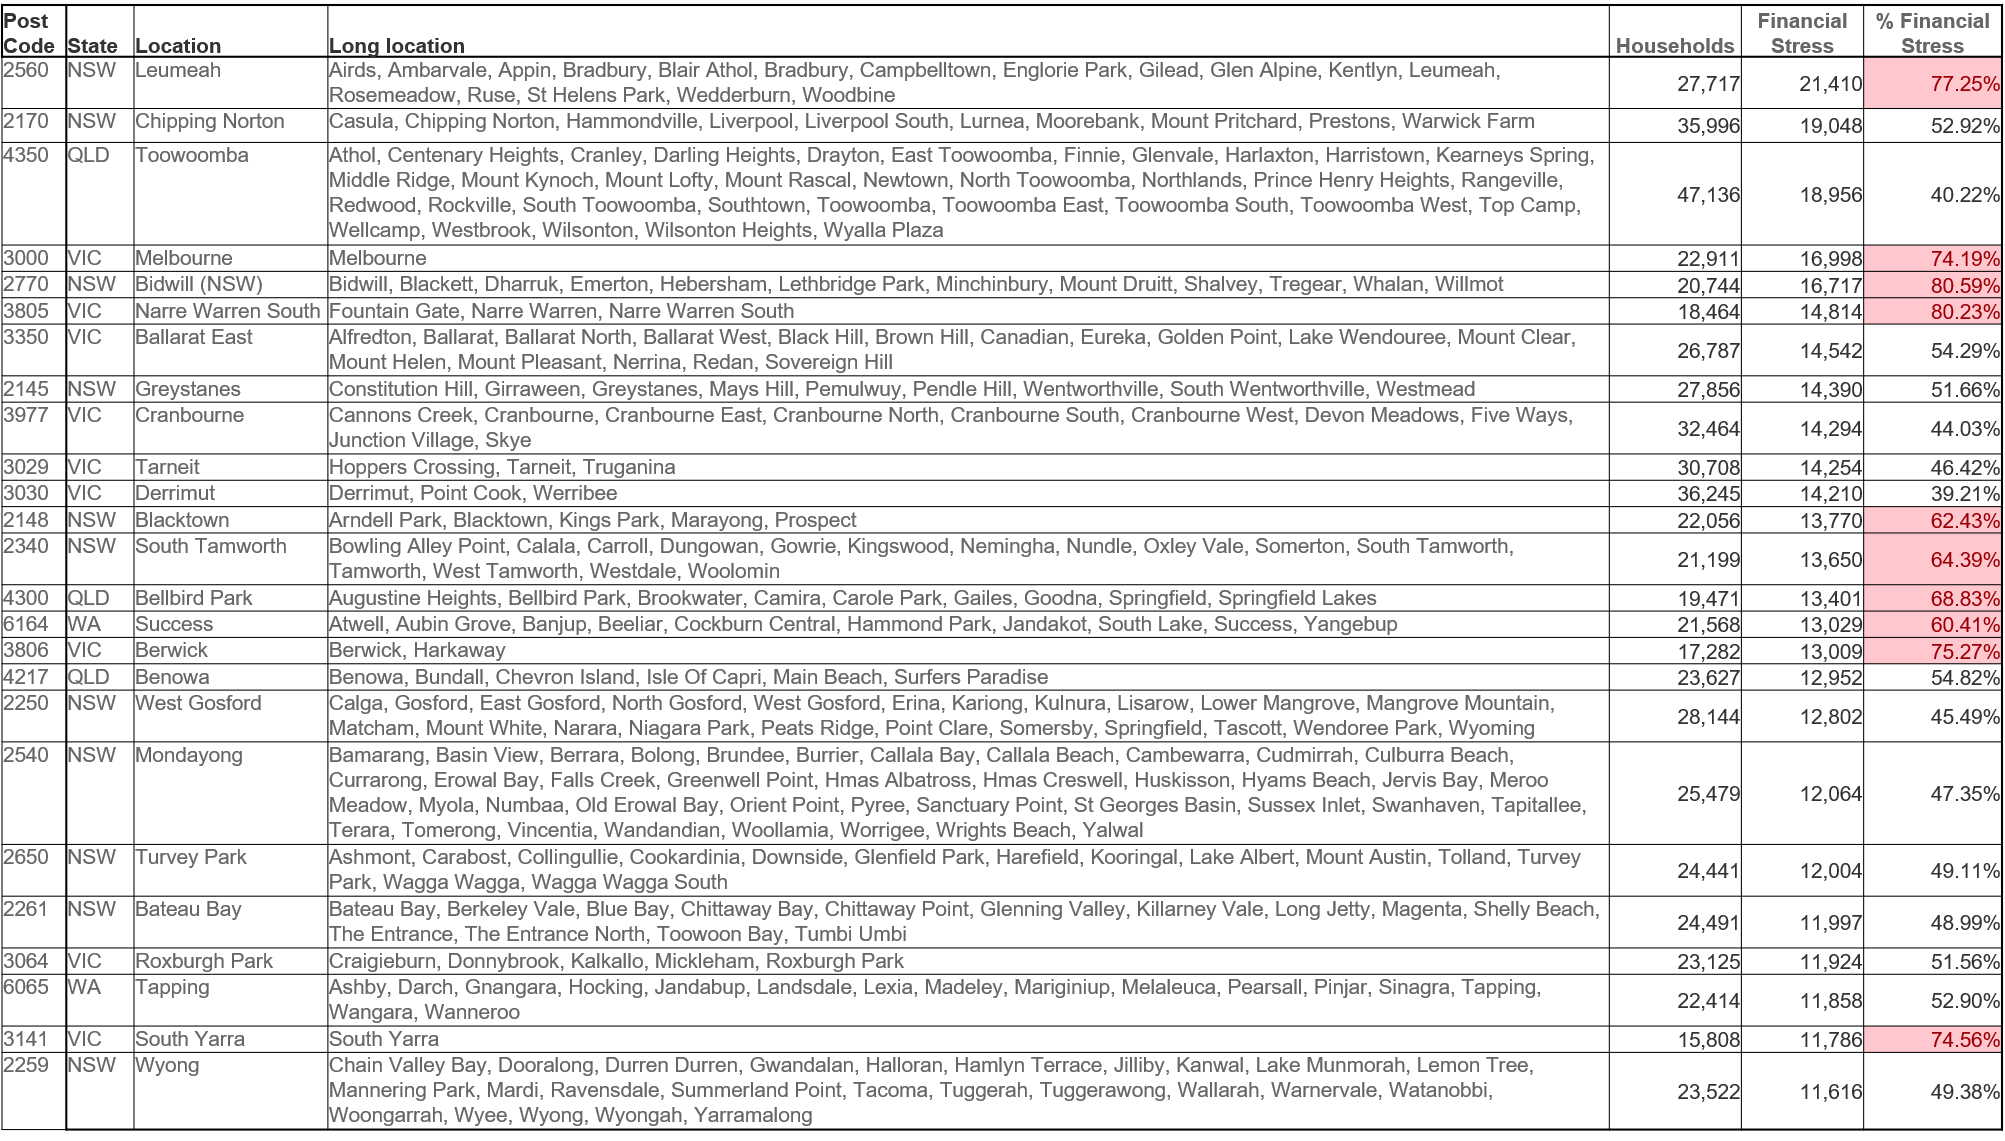
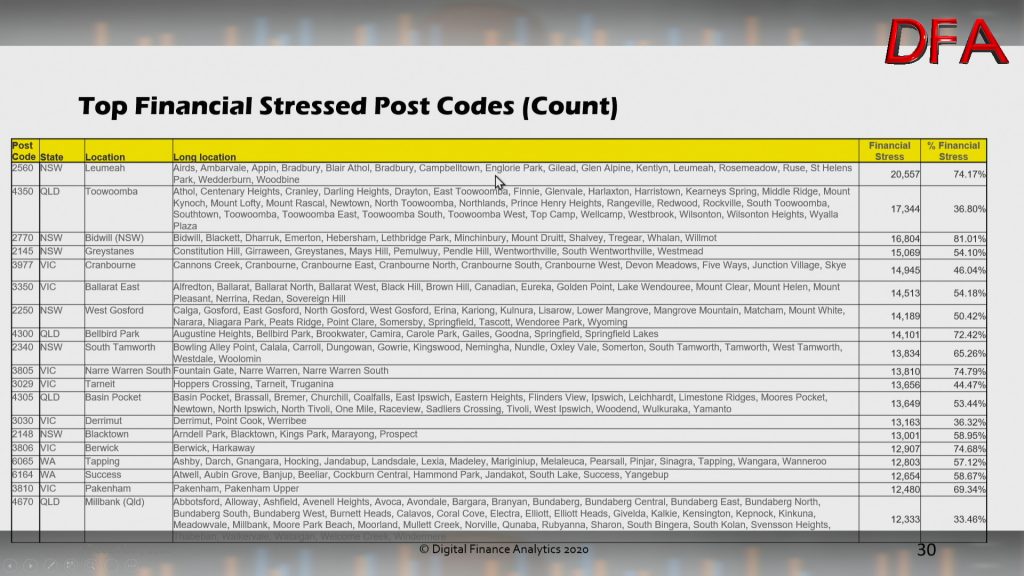
Overall financial stress, our aggregate measure reveals that Melbourne 3000 has the highest stress levels. That is followed by a number of the high growth corridors.

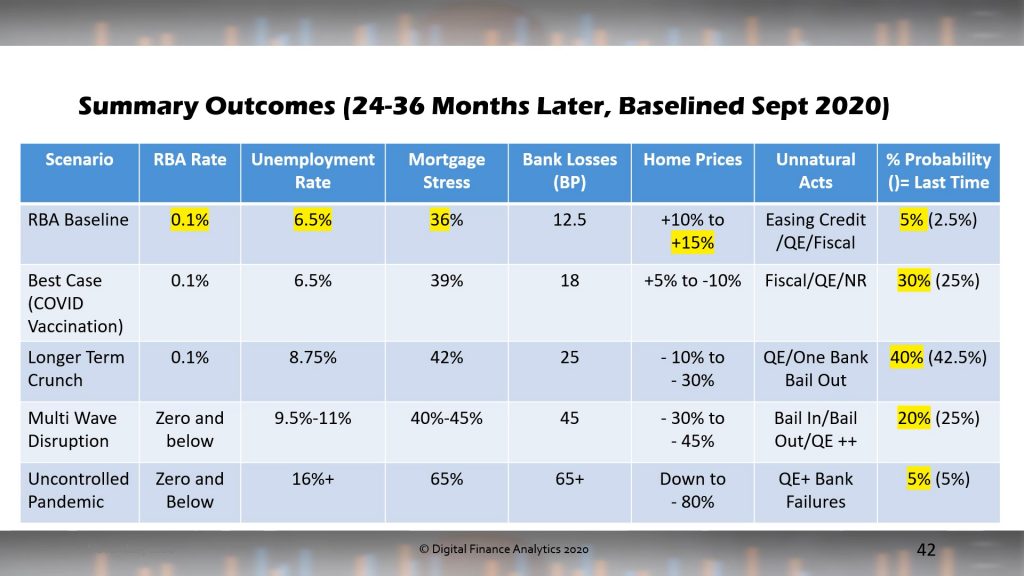
The continued pressure on households from low income growth, and rising living costs will persist, while the risks of interest rate rises grow with the competition of the Term Funding Facility at the end of June.

Households continue to wait for a magic bullet to solve their financial flow issues, and while some can draw on savings and equity, or reach for more credit, unless spending patterns are understood (half have no budgets), we think these trends will continue to bubble away.

Of course, financial stress is not the same a mortgage default, but those with cash flow issues are more likely later to end up having to sell their home, unless remedial action is taken.

Households in financial stress should certainly speak to their lender, prioritise spending, and be cautious about further loan commitments. There is no income growth “get out of jail card” for now.

April Household Financial Stress Rises

The latest data from our rolling household surveys reveals that the pressure on many households continues to build, despite the headline news of a booming recovery and jobs growth. Of course the missing element remains underemployment, where we still see many households struggling to get the income they need to cover their ongoing commitments. This is how we define stress – when incoming cash flow is not sufficient to cover ongoing costs.

Mortgage stress rose to 41.1% of borrowing households which translates to 1.52 million households, with the end of JobSeeker and JobKeeper in March.

Within the series both mortgage stress and rental stress were higher, although there was a small improvement in Victoria. Mortgage stress remains highest in Tasmania, at 55.8%, while rental stress is highest in NSW. Property investor stress is highest in NSW and ACT, and overall financial stress (which is a weighted average of all stressed households, against all households) was highest in NSW and ACT.

Across the DFA household segments, many Young Growing Families (which includes significant representation of First Time Buyers) are exposed, as are households living in the high growth high construction corridors around our major centres. But we also continue to see more affluent households who are often highly leveraged, with multiple properties also being caught. It is also worth highlighting that many first generation migrants are being caught too.

The postcodes with the highest levels of mortgage stress (measured by count of households) includes Chipping Norton 2170, Tapping, Wanneroo 6065, Toowoomba 4350 and Narre Warren 3805. So the pressures are wide spread, with the highest counts in those high growth corridors.

Turning to rental stress, the footprint is rather different, with Melbourne 3000 at the top of the list (thanks to many students and young workers in the area) followed by 2770, Liverpool and surrounds, 2145 which includes Westmead and Wentworthville, 2540 Jervis Bay and surrounds, and 2250, the area around Gosford. So rental stress appears in a range of settings.

Investor stress is led off by Queensland post code 4670 which includes Bundaberg, 2010 which includes Surry Hills and Darlinghurst, Meadow Springs and Mandurah 6210, 2145 Westmead and 3000 Melbourne.

Overall financial stress (our aggregate measure) was highest in 2170, Toowoomba 4350, 27770, 3000 and 3029, which includes Hoppers Crossing. Again this shows the wide distribution of those under financial pressure.

We discussed this in our recent show on DFA, together with some heat maps

We updated our core market model to take account of these changes, with our main scenario seeking an ongoing rise in property values ahead, but determined by the trajectory of the virus, vaccine rollout and border controls.

In conclusion, while many households are experiencing a rebound, there are many who are still caught in significant and growing financial pressures. Given that costs of many services are rising, while income is not, plus the larger mortgages being written at the moment, we expect stress to remain elevated for some time. And given the long cycle between stress, and ultimate property sale or mortgage default, it is likely we will see a continued build up in those financially exposed ahead.

Household Financial Stress Higher Than Before COVID

The latest results from our household surveys confirms that there are more households in financial stress than before the pandemic hit. As the various Government support mechanisms are ratcheted back, we will see the true impact on the community. Household debt is also turning higher again.

We have 41.1% of mortgaged households (1.5 million) in financial flow stress, despite the lower interest rate environment. While many have paid down debt, other have borrowed more. For example, the average new first time buyer loan is 15-18% larger than a year back- so much for the maintenance of lending standards!

We discussed this in detail in our live show, last night.

Across the states, the patterns are familiar, with Tasmania still reporting the highest proportion of households in mortgage stress thanks to low wages, and rising home prices. Victoria continues to be impacted by the longer lock-downs. Rental stress is being exacerbated by the end of tenant protections, so expect to see more evictions, and rent rises in the weeks ahead. Property investors in NSW are still having rental flow issues (due to high vacancies and lower rents). Overall financial stress – the aggregated measure across all households is highest in NSW, ACT and VIC.

Across our household segments young growing families, and those on the urban fringe in high growth corridors are being impacted, although across our segments and stress categories, it remains a real patchwork.

The top post codes for mortgage stress include Narre Warren and Fountain Gate, 3805 in Victoria, and Liverpool 2170 in NSW.

The top rental stress post codes include Liverpool 2170, NSW, Mount Druitt and Lethbridge Park 2770, NSW and Westmead 2145 NSW.

Investor stress is highest is St Kilda 3182, Westmead 2145 and Surfers Paradise 4217 in QLD.

Cumulative financial stress is highest in Liverpool 2170, Mount Druitt 2145, and Westmead 2145.

The mapping of mortgage stress to post codes reveals the potential hot spots, which include many of the high growth corridors, where vast estates continue to be built and sold to people who extend themselves to buy them. Many are first time buyers. Given flat wages, and higher unemployment post JobKeeper, this is one to watch.

Sydney

Melbourne

Brisbane

Adelaide

Perth

Hobart

ACT

Darwin

Whilst property prices are rising in many areas, the financial pressures on households are building, and we expect to see more casualties ahead. Financial stress can ultimately lead to significant social and behaviourial issues. Mortgage default rates (which are also rising) do not tell the full story.

How Many Households Are Behind With Their Mortgages? [Podcast]

The latest edition of our finance and property news digest with a distinctively Australian flavour.

Go to the Walk The World Universe at https://walktheworld.com.au/

Digital Finance Analytics (DFA) Blog
How Many Households Are Behind With Their Mortgages? [Podcast]
Loading
/

Mortgage Stress Higher In February 2021

Well, against expectations – based on the main thrust of economic news (and spin), some may find it surprising to learn that our latest household surveys detected a RISE in Mortgage stress in February, based on our 52,000 or 0.5% rolling sample.

Remember that we are measuring free cash flow, and a range of factors have driven the rate higher. First, people are spending harder now, and draining their savings (some built large buffers last year). Second the number of people on principal and interest rate holidays from the banks has fallen as they restart some (any) sort of repayments, (which of course resets the default “timer”, conveniently). Third, more are weaning off JobKeeper, and payment rates on JobSeeker are dropping as the extra support is withdrawn. Finally, some have negotiated new loans, at lower rates, but others are not successful in this, due to credit history, or taking a larger loan. Support ends at the end of March, so expect to see more of this ahead.

And the snap lock-downs had a big impact on some incomes, which are growing only slowly, if at all.

It is worth remembering that some new loans are being made at up to eight times income – this is a very high multiple even in the current low rate environment. And rates may not be as low for as long as many currently expect!

Thus overall mortgage stress rose from around 39% last month to more than 41% this month.

Across the country, more than 1.5 million mortgage holders have cash flow issues, this is 41.8% of borrowers. Tasmania and NT had the highest proportion of households exposed, and Victoria rose to 45.4% in response to the recent lock-down.

We also measure rental stress, which is 34.9% of renters, investment property stress at 26.5%, and overall aggregate financial stress at 38%. In total around 4 million households are being crunched in some way.

Across the segments, young growing families, and those on the urban fringe are most exposed (this includes many recent first time buyers), while more affluent households are also caught, thanks often to multiple investment properties.

We can identify the top post codes for our four stress types, sorted by the number of households exposed. We see the same post codes appearing in multiple lists. There was a significant rise in the high growth areas around Melbourne, as well as Toowoomba in Queensland, and areas of New South Wales.

Underlying our modelling are our scenarios, which we have updated with the latest economic data inputs. There is a greater probability of home price rises, especially in some smaller states, and in the house, not high-rise unit segment.

And we discussed this analysis, together with the stress maps which accompany it in our recent live show.

Whilst some are falling over themselves to get into the market, we remain cautious, given the potential rise in stress, mortgage rates, and the tapering of Government support.

Mortgage Stress Falls In January

The latest results from our household surveys reveals that by the end of January 2021, overall levels of mortgage stress dropped below 40%, to 39.5% – still well above the level prior to the virus hitting.

This is a consequence of lower mortgage rates following the RBA cash rate cuts, liquidity support and quantitative easing, plus less impact from the virus on lock-downs and employment. That said, whilst many households have grown their savings buffers, a considerable number remain close to the edge, in cash-flow terms. More than 1.4 million mortgaged households remain under pressure

Across the states, mortgage stress fell significantly in VIC, but remains highest in TAS. Rental stress is still elevated, with NSW and ACT having the most significant issues, while property investor stress in also highest in ACT and NSW, thanks to falling returns from rents, and rising vacancy rates in some areas. As a result many property investors are considering selling into the autumn market rise.

Levels of stress vary across our household segments, with many living on the urban fringe in the high-growth corridors still under pressure. A considerable number of more affluent households, often holding multiple investment properties are also under pressure. Young Growing Families, which include many First Time Buyers remain stretched, with overall Financial Stress (an aggregate of mortgage, rental and investor stress) are the most stressed.

Looking at specific post codes – mortgage stress is highest (by count of households) in Narre Warren 3805, Cambelltown (2560) and Tapping/Wanneroo (6065). All high growth corridors.

Rental stress is highest in central Melbourne (3000), Cambelltown (2560) and Liverpool (2170). Much of the pressure is from high-rise occupants, as well as in the high growth corridors.

Property investor stress is highest in Surfers Paradise (4217) where tourism is well down, Central Melbourne (3000) and Northern Beaches (2099).

Finally, overall financial stress, our aggregate measure is highest in Cambelltown (2560), Liverpool (2170), Toowoomba (4350) and Central Melbourne (3000).

We discussed this data in detail on our live show last night.

We also updated our scenarios, reflecting the more positive economic news – though retain alternatives where the virus remains less contained. The path of the virus, and its control is clearly directly linked with economic performance and the trajectory of mortgage stress, and home prices ahead.

Mortgage Stress Accelerates In November 2020

This was not meant to happen – after all the official story is we are in recovery mode – yet the latest results from our rolling household surveys tells another story as unemployment and underemployment rise further, even as Government financial support is tapered down. As a result mortgage stress – those households with a mortgage and cash flow pressures – rose to an astonishing 41.6% in November. Before the pandemic we sat at 32.9% in February, so nearly 10% more households are now feeling the pain.

The surveys showed some mixed drivers of this result. Sure, a number of larger firms have come off JobKeeper as the economy reopenes but more smaller firms are putting people on JobKeeper, even as the level of support is reduced. This was confirmed by the segmental analysis of the latest payroll data which showed growth among larger firms but a fall among smaller firms.

More households have had to recommence mortgage repayments now, with the ABA reporting that among the top 7 largest banks, deferred loans dropped from a peak of $250 billion down to $86 billion in November, with home loan deferrals by the seven largest banks are down to fewer than 145,000. But this has placed considerable pressures on households recommencing, even as unemployment continues to rise – to 7% in November according to the ABS and remember this is artificially understating the true picture as JobKeeper recipients are excluded.

The unemployment rate increased 0.1 pts to 7.0% (1.7 pts higher than a year ago)

Unemployment increased by 25,500 to 960,900 people (and increased by 238,900 over the year to October 2020)

The youth unemployment rate increased 1.0 pts to 15.6% (and increased by 3.1 pts over the year to October 2020)

Our analysis also examines Rental Stress, Property Investor Stress and overall Financial Stress by state and household segment.

Across the states, Tasmania still retains top mortgage stress spot in in percentage terms, followed by Victoria and Western Australia. Rental stress is highest in New South Wales and Victoria, and across Australia. On average 35.2% of those renting have cash flow issues. Among property investors, 25.6% reported a cash flow deficit, as rents fall, and vacancies rise. More are still considering selling – especially those holding high-rise apartments in Sydney and Melbourne.

Across our segments, mortgage stress is highest among young growing families, which includes many first time buyers who were attracted into the market by Government incentives. This will not end well. Those living in the high growth corridors are also under pressure, especially on the urban fringe. And we see more affluent households caught up in stress, thanks to higher levels of unemployment – and high leverage.

Rental stress is broad based, with many first generation migrants under pressure, as well as young affluent.

Many affluent households with investment property are stressed, thanks to the proliferation of multiple properties, and high leverage, even as rentals fall in some areas. Once again, units are most exposed.

Overall financial stress (an aggregate of the three elements we discussed) is broad based across our segments. This is a significant structural issues – and one which was already in play BEFORE the pandemic. But it is significantly worse now.

The top postcodes by mortgage, rental and investor stress are presented below. This data is sorted by the number of households impacted by stress (again in cash flow terms). We see high representation in high growth corridors across the country, as well as some inner City suburbs.

Investor postcodes show the location where the investor resides, not necessarily the location of their investment properties.

Overall financial stress is highest in the high growth corridors, areas where many households are under pressure, yet also areas where more development in under way and home land packages are being pushed very hard though the current Government schemes.

We also mapped the stress – here is an example of mortgage stress in Melbourne. This is to illustrate the patchwork nature of stress (orange and red are high stress areas).

Two final points, as Government support is wound back further, especially in the March quarter next year it seems likely stress will continue to bite, unless unemployment turns around faster than expected.

And as the ABA said recently

“Don’t wait till you are in over your head, talk to your bank, they’ll help you find a way through this. Don’t tough it out on your own”,

This is excellent advice, and should sound a note of caution to those who are considering a property move in the current environment. Mortgage stress can put considerable pressures on households, and often leads to a sale later. So new purchasers should be cautious, and develop their own cash-flows prior to committing – just because a lender agrees to make a loan, this does not necessarily mean its a sensible decision from a borrowers point of view – a bank has a completely different view of “risk”. So buyers beware!

FINAL REMINDER DFA Live Q&A Tonight 8pm Sydney – Latest Scenarios And Household Stress

Join us for a live Q&A as I discuss the latest results from our surveys and explore the impact at a post code level. You can ask a question live via the YouTube chat as we explore the latest economic data together. And yes, I will have my stress mapping and post code analytic engine online…

https://walktheworld.com.au/

Household Financial Stress Reaches New High

The results from our latest household surveys reveals that despite the return to work as the lock down is eased, the reduction in JobSeeker, JobKeeper and the need to renew mortgage payments are all offsetting the better job news, in a low income growth, high cost environment.

We also updated our property and finance scenarios to take account of the RBA announcements yesterday. There is still a path for higher property prices ahead, but this is not our central scenario over the next 2-3 years. Handling the virus will be a critical issue ahead.

We discussed this in detail on our live stream Q&A.

We measure stress in cash flow terms, recognising that households may have access to credit or savings in the short term, rather than a set proportion on a mortgage repayment. In addition we examine those renting, and those with investment property to give a more complete picture. Note our approach is different from those preferring to use a set percentage of income.

Mortgage stress rose to 40.6%. This is a new record.

Across the states, mortgage stress is most severe in Tasmania and Victoria, whereas rental stress is highest New South Wales. Investor stress is also highest in this state together with the ACT. Overall financial stress is highest in NSW and ACT, with VIC following closely behind.

Across the segments, young growing families (including many first time buyers are the most exposed to mortgage stress, whereas rental stress is hitting younger affluent, first generation migrants and older households. More affluent households are experiencing higher levels of property investor stress, as they are more leveraged, and often have multiple properties. In aggregate Financial stress is touching a wide range of our cohorts.

We present the top post codes (in terms of count) for each stress dimension.

And for the first time we have mapped aggregate financial stress for each major centre, highlighting that pressures on households are impacting a range of locations. Generally the high-growth corridors show significant issues, but even more established areas are also under pressure.

Our view is that we are still in the foothills of the financial crisis, and that as stimulus is withdrawn further, and unemployment continues to rise, stress will deteriorate.