Auckland’s Construction Shortfall Analysed

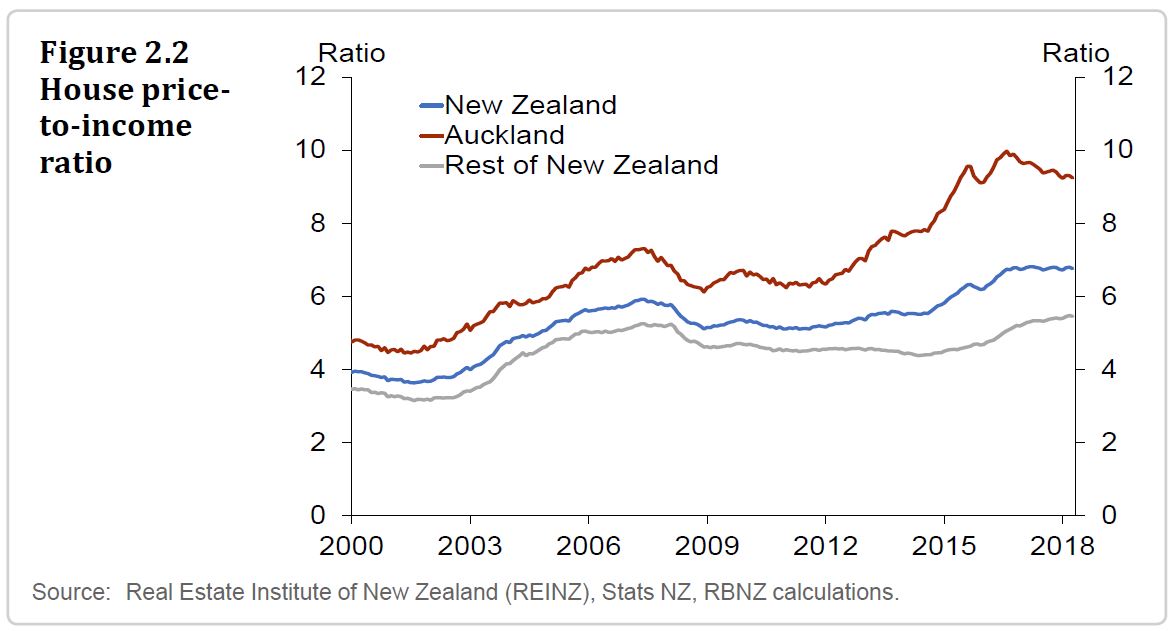
A new discussion paper has been published on the Reserve Bank New Zealand’s website: Residential construction and population growth in New Zealand: 1996-2016. It highlights the supply shortfall at approximately 10 percent of Auckland’s housing stock. But not until apartment construction almost completely ceased in 2008 did Auckland’s housing shortage started to become acute.

This paper aims to understand how population growth has affected building activity in New Zealand regions during the last twenty years. Using panel data regression techniques, we estimate that 0.25 – 0.30 additional houses are built for every additional person in a region. The additional 0.25 – 0.30 building permits per person equate to about 40 m2 of new construction, with a value of just over $60,000 in 2016 terms. This construction is in addition to the ‘background’ construction that occurs to replace old houses, which amounts to 2.5 – 3.0 dwellings per 1,000 people per year, or approximately 11,000 – 13,000 dwellings per year.

The estimates suggest Auckland’s construction shortfall between 1996 and 2016 was between 40,000 and 55,000 dwellings, or approximately 10 percent of Auckland’s housing stock. The estimates of the shortfall are fairly robust to changes in the specification of the models; moreover, they all suggest that the shortfall was modest until the end of 2005, when it increased rapidly.

We also examine the relationship between the size of newly constructed dwellings and population change. Since four of the sixteen New Zealand regions experienced almost no population growth over the period, it is possible to contrast the size of newly constructed houses in regions experiencing population change with those that did not. These estimates suggest that, at least until 2005, smaller houses were constructed in growing regions with above-average incomes, particularly Auckland and Wellington, than in growing regions with below average incomes or in regions with no population growth. This difference appears to reflect the much younger age profile of the residents of Auckland and Wellington. It appears that Auckland’s housing shortfall was less severe prior to 2005 precisely because of the large number of small apartments that were constructed in the city. Not until apartment construction almost completely ceased in 2008 did Auckland’s housing shortage started to become acute.

Finally, we analyse the relationship between population growth rates and the number of ‘residential’ construction workers. Our estimates suggest that a 1 percent increase in population growth rates is associated with a 0.4 – 0.5 percentage point increase in the fraction of the workforce in the construction sector. Since regions with zero population growth have 4.5 – 5 percent of their workers involved in residential construction, each percentage increase in the population growth rate increases the number of residential construction workers by approximately 10 percent. This does not include additional workers in related industries such as building materials. Auckland is again an outlier. For most of the period Auckland had approximately 9000 fewer construction workers than could be expected from trends around the rest of the country. Clearly, if this shortfall continues it will be difficult for Auckland to overcome its housing shortage.


RBNZ Holds Official Cash Rate

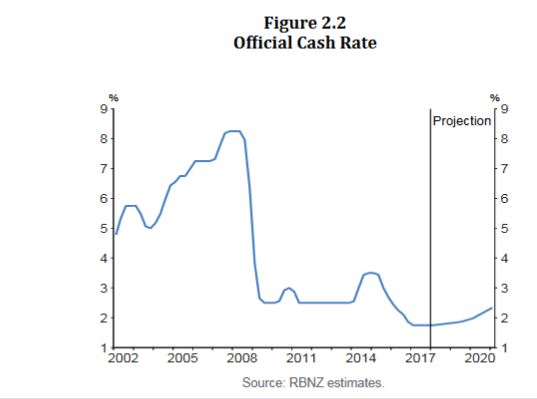
The New Zealand Reserve Bank has left the Official Cash Rate (OCR) unchanged at 1.75 percent and released their February 2018 Monetary Policy Statement.

Global economic growth continues to improve.  While global inflation remains subdued, there are some signs of emerging pressures.  Commodity prices have increased, although agricultural prices are relatively soft.  International bond yields have increased since November but remain relatively low.  Equity markets have been strong, although volatility has increased recently.  Monetary policy remains easy in the advanced economies but is gradually becoming less stimulatory.

The exchange rate has firmed since the November Statement, due in large part to a weak US dollar. We assume the trade weighted exchange rate will ease over the projection period.

GDP growth eased over the second half of 2017 but is expected to strengthen, driven by accommodative monetary policy, a high terms of trade, government spending and population growth.

Labour market conditions continue to tighten. Compared to the November Statement, the growth profile is weaker in the near term but stronger in the medium term.

The Bank has revised its November estimates of the impact of government policies on economic activity based on Treasury’s HYEFU.  The net impact of these policies has been revised down in the near term. The Kiwibuild programme contributes to residential investment growth from 2019.

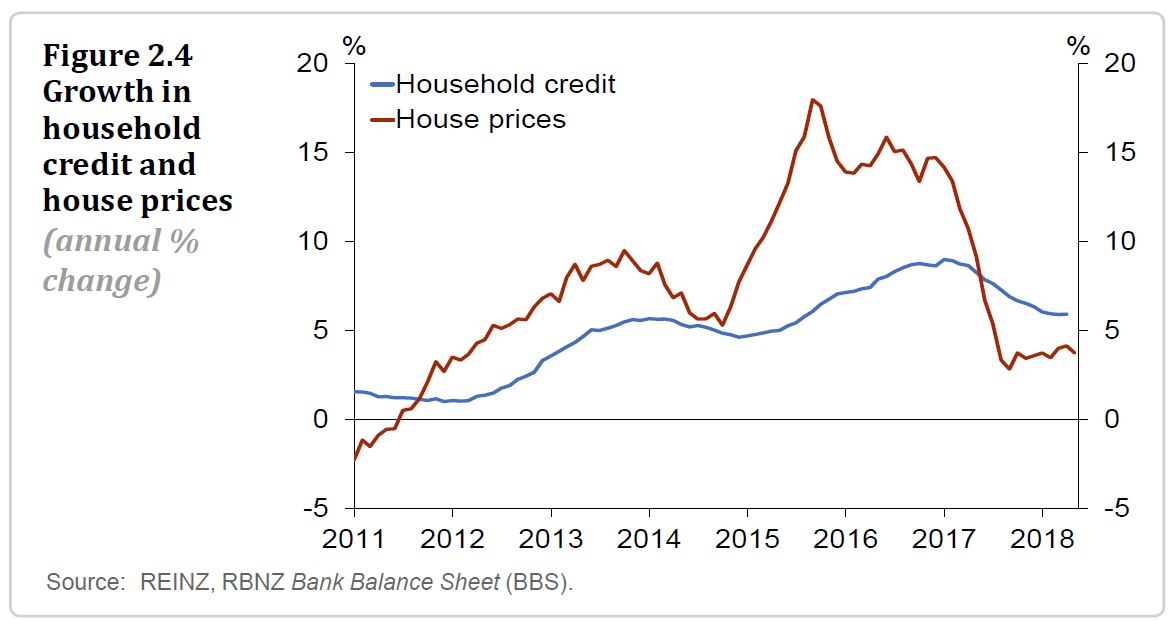
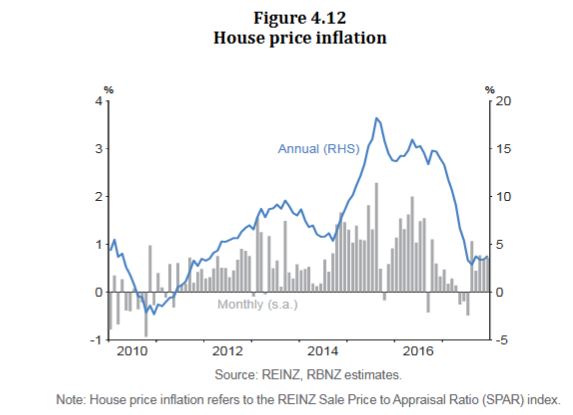
House price inflation has increased somewhat over the past few months but housing credit growth continues to moderate.

The Bank says ” Bank funding costs eased slightly in the second half of 2017. Consistent with the decline in funding costs and a fall in the two-year swap rate, the average two-year mortgage rate has declined by around 15 basis points since June 2017. In contrast, most other mortgage rates have remained relatively stable. Mortgage rates are higher than a year ago across all terms, but remain low relative to history”.

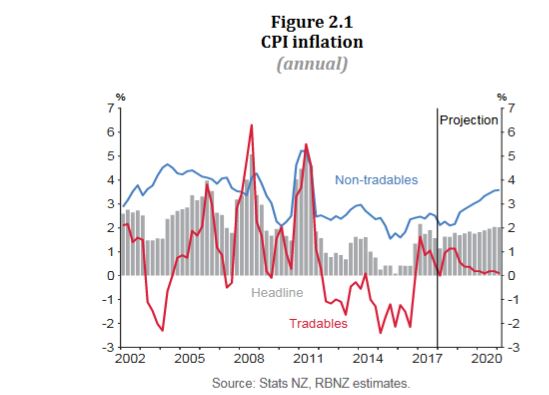
Annual CPI inflation in December was lower than expected at 1.6 percent, due to weakness in manufactured goods prices.

While oil and food prices have recently increased, traded goods inflation is projected to remain subdued through the forecast period. Non-tradable inflation is moderate but expected to increase in line with increasing capacity pressures.  Overall, CPI inflation is forecast to trend upwards towards the midpoint of the target range. Longer-term inflation expectations are well anchored at 2 percent.

Monetary policy will remain accommodative for a considerable period.  Numerous uncertainties remain and policy may need to adjust accordingly.

ANZ Confirms UDC sale to HNA is not proceeding

ANZ today announced the agreement to sell UDC Finance to HNA Group will not proceed as the agreement with HNA has now been terminated in accordance with the contracted timeframe.

This follows the 21 December 2017 announcement that New Zealand’s Overseas Investment Office had declined HNA Group’s application to acquire UDC Finance.

ANZ Group Executive and New Zealand CEO David Hisco said: “Following the termination of the agreement with HNA, we’ll continue to assess our strategic options regarding the future of UDC, although there is no immediate requirement to do anything.

“It will be business as usual for staff and customers. UDC continues to be a very profitable business with a strong capital position and a growing loan portfolio across a range of industries.

“Its focus remains on its core business of financing vehicles and equipment for people and companies across New Zealand,” Mr Hisco said.

ANZ Bank New Zealand’s Sale of UDC Finance Blocked

ANZ Bank New Zealand has been informed that New Zealand’s Overseas Investment Office has declined HNA Group’s application to acquire UDC Finance.

ANZ Bank Group Executive and New Zealand CEO David Hisco said: “While the sale agreement between the parties remains in place, unless HNA successfully overturns the OIO decision, the sale will not proceed.

“We don’t know if HNA will attempt to overturn the decision.

“If the sale does not proceed, we’ll assess our strategic options regarding the future of UDC. It’s a great business and there is no immediate requirement to do anything, particularly given the strength of ANZ’s capital position.

“UDC continues to be a highly profitable and strong business, with great staff and customers, and a growing loan portfolio across a range of industries.

“UDC’s focus remains on its core business of financing vehicles and equipment for people and companies across New Zealand. So, it will be business as usual for our staff and customers.”

This OIO decision has no impact on the recently announced $AUD1.5 billion on-market buy back of ANZ Banking Group shares.

The UDC transaction proceeds are equivalent to ~10 basis points of APRA CET1 capital. If the transaction does not go ahead, ANZ’s FY18 earnings will no longer be adjusted for the sale. The transaction summary detail was included in the ANZ Banking Group News Release of 11 January 2017.

RBNZ Consults On Revised Capital Adequacy Changes

The Reserve Bank NZ, has issued a Consultation Paper: Review of the Capital Adequacy Framework for locally incorporated banks: calculation of risk weighted assets.

This is the third consultation document of the review. The first document provided an overview of the review. The second document considered the definition of capital, which is the numerator in the minimum regulatory capital ratio. This document is concerned with the denominator in the minimum capital ratio, which is effectively a measure of exposure to risk.

They highlight further issues with the internal calculation method, as well as recent changes from the Basel Committee.

There is international and New Zealand evidence that minimum capital requirements went down significantly after banks were permitted to use their internal models for parts of the capital calculation. There is also international evidence that internal model outcomes are inconsistent. Different banks often come up with similar rankings of risk but the absolute levels of risk are substantially different even for the same obligors. The evidence is clearest in the case for exposures to governments, banks, and large corporations, but there is also some evidence of problems in other portfolios such as residential mortgages and SME lending.

The Basel Committee had proposed to replace the IRB approach with the standardised approach for bank and large corporate exposures, and with a standardised or semi-standardised approach for all specialised lending to corporates. The finalised framework did not go this far – it continues to allow a more limited form of IRB modelling, the Foundation IRB (F-IRB) approach, for bank and large corporate exposures. The new framework does, as originally proposed, constrain the outputs of internal models and impose an overall floor – based on the risk assessed under the standardised approach – on the average risk weight, to prevent it from straying too far from a common level.

Specifically, there are currently significant differences between the two approaches. Banks with internal models have a significant capital advantage.

They table options for both internal and standard approaches, as below.


Reserve Bank NZ to ease LVR restrictions

The Reserve Bank NZ has announced a slight reduction in tight loan to value lending controls, in response to the slowing housing sector and Government policy.  The loan-to-value ratio (LVR) policy was first introduced in October 2013, with progressively tighter restrictions for investors introduced in November 2015 and October 2016.

New Zealand’s financial system remains sound and risks to the system have reduced over the past six months, Reserve Bank Governor Grant Spencer said today when releasing the Bank’s November Financial Stability Report.

“Momentum in the global economy has continued to build over the past six months, reducing near-term risks to financial stability. However, the New Zealand financial system remains exposed to international risks related to elevated asset prices and high levels of debt in a number of countries.

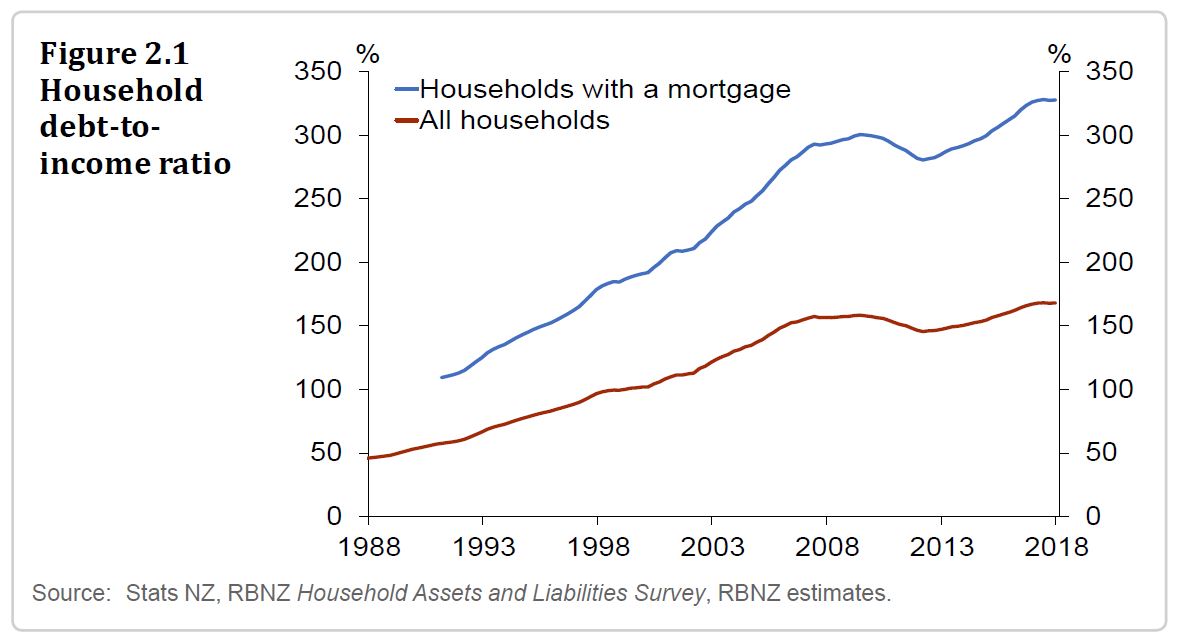
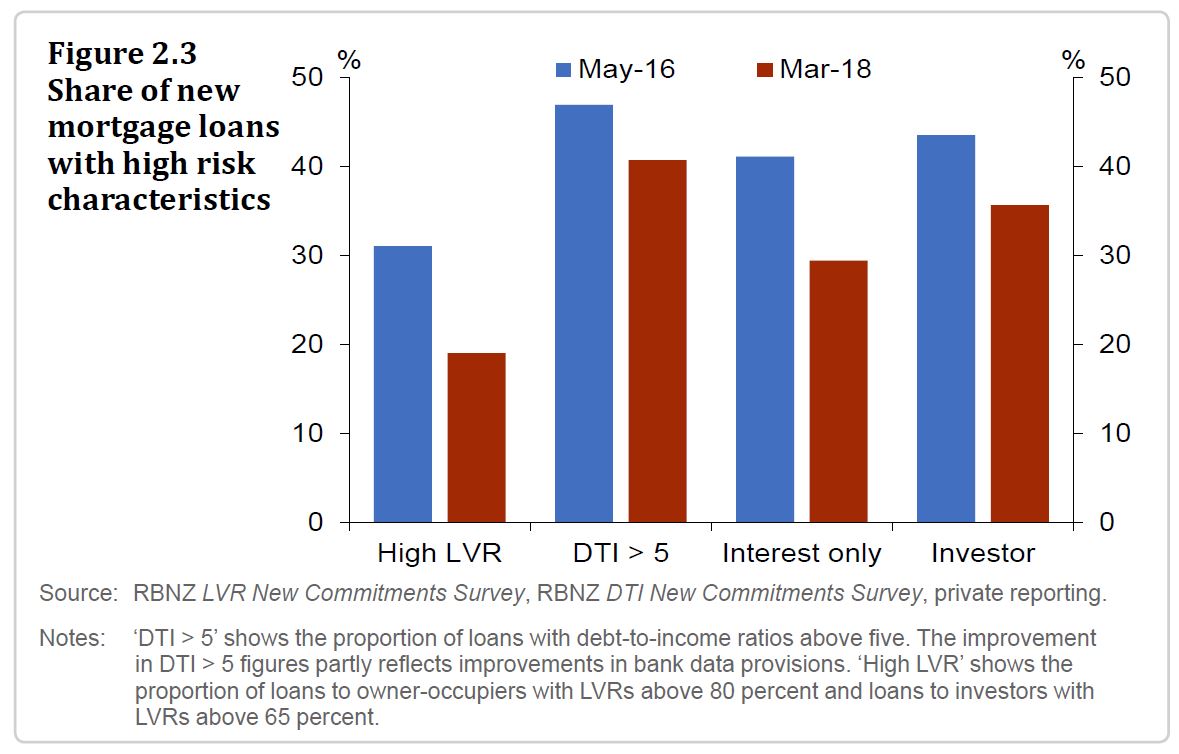
“Domestically, LVR policies have been in place since 2013 to address financial stability risks arising from rapid house price inflation and increasing household debt. These policies have helped improve banking system resilience by substantially reducing the share of high-LVR loans. Over the past six months, pressures in the housing market have continued to moderate due to the tightening of LVR restrictions in October 2016, a more general firming of bank lending standards and an increase in mortgage interest rates in early 2017.

If there was a major housing market correction or economic downturn, then this reduction in the share of lending at high LVRs is likely to mean that fewer housing loans would default, and overall bank losses would be lower. One way of quantifying this is to use data from recent stress tests to estimate how the change in banks’ portfolios would affect default and loss rates for a given downturn scenario. Based on the 2017 stress test scenario we estimate that banks would experience around 10 percent lower default rates and around 20 percent lower credit loss rates than they would have if LVR restrictions had not been applied .

In the media conference the bank said $54bn of new OO were written over the past year, but there is no data on the number of additional applications which may flow now. They expect some increase in new loans at higher LVR’s but as the banks use their own buffers the bank is not expecting a large rise, but it could benefit first time buyers. They called this an incremental change, and they will continue to review the LVR restrictions – there is no schedule to move to no restrictions.  This is also a reaction to Government policies which will cool the market. They expect property investors to remain on the “back foot”, with lower future price gains now observed.

“Housing market policies announced by the Government are also expected to have a dampening effect on the housing market.

“In light of these developments, the Reserve Bank is undertaking a modest easing of the LVR restrictions. From 1 January 2018, the LVR restrictions will require that:

  • No more than 15 percent (currently 10 percent) of each bank’s new mortgage lending to owner occupiers can be at LVRs of more than 80 percent.
  • No more than 5 percent of each bank’s new mortgage lending to residential property investors can be at LVRs of more than 65 percent (currently 60 percent).

“The Bank will monitor the impact of these changes and will only make further LVR adjustments if financial stability risks remain contained. A cautious approach will reduce the risk of resurgence in the housing market or deterioration in lending standards.

Deputy Governor Geoff Bascand said “Looking at the financial system more broadly, the banking system maintains adequate buffers over minimum capital requirements and appears to be performing its financial intermediation role efficiently. The recovery in dairy commodity prices since mid-2016 has supported farm profitability and has helped to reduce bank non-performing loans in the sector. Recent stress tests suggest that banks are well positioned to withstand a severe economic downturn and operational risk events.

“The Bank has released two consultation papers on the review of bank capital requirements and a third paper on the measurement and aggregation of bank risk will be released shortly. The aim of the capital review is to ensure a very high level of confidence in the solvency of the banking system while minimising complexity and compliance costs.

“The Bank has also completed a review of the bank directors’ attestation regime and is making good progress in implementing a new dashboard approach to quarterly bank disclosures. This is expected to go live next May,” Mr Bascand said.

Westpac capital requirements increased after breaching regulatory obligations

The Reserve Bank in New Zealand says that Westpac New Zealand Limited (Westpac) has had its minimum regulatory capital requirements increased after it failed to comply with regulatory obligations relating to its status as an internal models bank.

Internal models banks are accredited by the Reserve Bank to use approved risk models to calculate how much regulatory capital they need to hold. Westpac used a number of models that had not been approved by the Reserve Bank, and materially failed to meet requirements around model governance, processes and documentation.

“This is very disappointing. Operating as an internal models bank is a privilege that requires high standards and comes with considerable responsibilities. Westpac has not met our expectations in this regard,” Reserve Bank Deputy Governor and Head of Financial Stability Geoff Bascand said.

The Reserve Bank required Westpac to commission an independent report into its compliance with internal models regulatory requirements. The report found that Westpac:

  • currently operates 17 (out of 35) unapproved capital models;
  • has used 21 (out of 32) additional unapproved capital models since it was accredited as an internal models bank in 2008; and
  • failed to put in place the systems and controls an internal models bank is required to have under its conditions of registration.

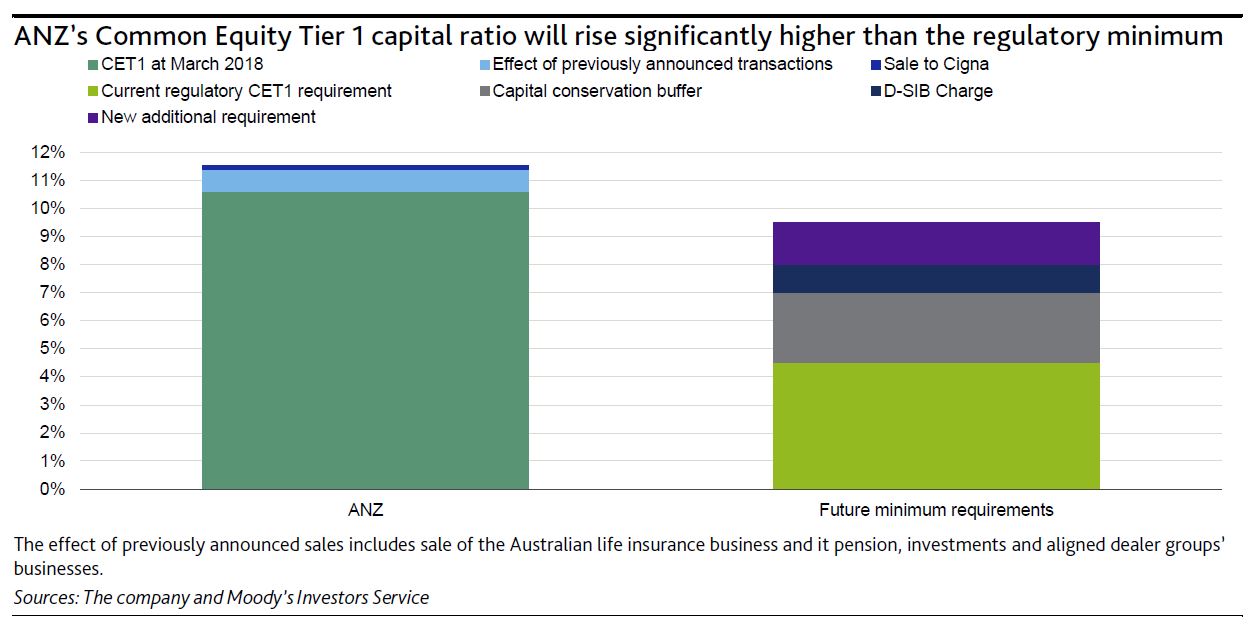
The Reserve Bank has decided that Westpac’s conditions of registration should be amended to increase its minimum capital levels until the shortcomings and non-compliance identified in the independent report have been remedied.  Westpac’s minimum capital ratio requirements will be 6.5 percent for Common Equity Tier 1 capital, 8 percent for Tier 1 capital and 10 percent for Total capital, with the additional 2.5 percent capital conservation buffer applying.  Currently, for all other locally incorporated banks capital ratios are set at, respectively, 4.5 percent, 6 percent and 8 percent, plus the 2.5 percent buffer.

In addition, the Reserve Bank has accepted an undertaking by Westpac to maintain its total capital ratio above 15.1 percent until all existing issues have been resolved.  The Reserve Bank has given Westpac 18 months to satisfy the Reserve Bank that it has sufficiently addressed those issues or it risks losing accreditation to operate as an internal models bank.

“We believe the regulatory action is appropriate given the seriousness of Westpac’s non-compliance and the need to protect the integrity of the capital regime,” Mr Bascand said.

The Reserve Bank has taken into account that Westpac has not deliberately sought to reduce its regulatory capital. While there have been serious shortcomings and  non-compliance, it appears that Westpac has remained well above its required regulatory capital levels.

Westpac has confirmed that it does not dispute the findings of the independent report, that it is committed to remedying all the issues identified, and that it will maintain its total capital ratio above 15.1 percent.

RBNZ Holds Cash Rate At 1.75%

The New Zealand Reserve Bank today left the Official Cash Rate (OCR) unchanged at 1.75 percent. They are projecting higher rates ahead.

Global economic growth continues to improve, although inflation and wage outcomes remain subdued.  Commodity prices are relatively stable.  Bond yields and credit spreads remain low and equity prices are near record levels.  Monetary policy remains easy in the advanced economies but is gradually becoming less stimulatory.

The exchange rate has eased since the August Statement and, if sustained, will increase tradables inflation and promote more balanced growth.

GDP in the June quarter grew broadly in line with expectations, following relative weakness in the previous two quarters.  Employment growth has been strong and GDP growth is projected to strengthen, with a weaker outlook for housing and construction offset by accommodative monetary policy, the continued high terms of trade, and increased fiscal stimulus.

The Bank has incorporated preliminary estimates of the impact of new government policies in four areas: new government spending; the KiwiBuild programme; tighter visa requirements; and increases in the minimum wage. The impact of these policies remains very uncertain.

House price inflation has moderated due to loan-to-value ratio restrictions, affordability constraints, reduced foreign demand, and a tightening in credit conditions.  Low house price inflation is expected to continue, reinforced by new government policies on housing.

Annual CPI inflation was 1.9 percent in September although underlying inflation remains subdued.  Non-tradables inflation is moderate but expected to increase gradually as capacity pressures increase.  Tradables inflation has increased due to the lower New Zealand dollar and higher oil prices, but is expected to soften in line with projected low global inflation.  Overall, CPI inflation is projected to remain near the midpoint of the target range and longer-term inflation expectations are well anchored at 2 percent.

Monetary policy will remain accommodative for a considerable period.  Numerous uncertainties remain and policy may need to adjust accordingly.

Banks Need To Grow Deposits In Line With Credit

The Reserve Bank New Zealand has published an Analytics Note entitled “Diving in the deep end of domestic deposits“.   They conclude that banks may need to limit credit growth unless they are able to grow retail deposits in line with credit growth.

Deposits are an important part of the New Zealand financial system. Deposits play a large role in funding bank lending – banks try to attract deposits in order to build up funds to lend out to borrowers. Over the past couple of years, lending has been growing faster than deposits, requiring banks to source funding from offshore wholesale funding markets. External funding can increase risks in the financial sector, as deposits are typically a more stable (“core”) source of funding than offshore wholesale funding.

This paper explores deposit growth in New Zealand in order to answer two questions:

1) What factors drive deposit growth in New Zealand, particularly in the past few years?

2) Can banks increase deposits by increasing interest rates?

We use two models to explore the dynamics of household deposits in New Zealand’s banking system in order to answer these questions. The first model uses bank-specific data from New Zealand’s four largest banks, while the second uses aggregate data for the entire banking system.

The paper highlights that the rate of domestic deposit growth has varied significantly since the Global Financial Crisis, and sharply slowed over 2016. We provide evidence that a range of supply and demand factors influence deposit growth, and that the recent slowing was largely driven by a reduction in supply (that is, households wanting to allocate less money to deposit products). We also find that banks increased their demand for deposits in late 2016 in an effort to close the gap between deposit growth and lending.

We also consider the degree to which banks are able to increase deposit growth materially by raising interest rates. We find that a 1 percentage point increase in the six-month deposit rate can increase the level of household deposits by about 1 percent after four quarters, and by 1.3 percent in the long-run.

As we find that deposits are not strongly responsive to interest rates, if banks wish to maintain robust funding profiles by not becoming too reliant on offshore wholesale funding, they may need moderate credit growth or use a combination of approaches to bring deposit growth in line with credit growth.

The Analytical Note series encompasses a range of types of background papers prepared by Reserve Bank staff. Unless otherwise stated, views expressed are those of the authors, and do not necessarily represent the views of the Reserve Bank.

Does past inflation predict the future?

Interesting Analytical Note from the Reserve Bank New Zealand. They have recently changed their modelling of inflation, preferring to use past data rather than a two year prediction because despite low unemployment, inflation has remained lower than would be expected on the old method. This suggests monetary policy needs to be more stimulatory than expected .

Forecasts of non-tradables inflation have been produced using Phillips curves, where capacity pressure and inflation expectations have been the key drivers. The Bank had previously used the survey of 2-year ahead inflation expectations in its Phillips curve. However, from 2014 non-tradables inflation was weaker than the survey and estimates of capacity pressure suggested. Bank research indicated the weakness in non-tradables inflation may have been linked to low past inflation and its impact on pricing behaviour.

This note evaluates whether measures of past inflation could have been used to produce forecasts of inflation that would have been more accurate than using surveys of inflation expectations. It does this by comparing forecasts for annual non-tradables inflation one year ahead. Forecasts are produced using Phillips curves that incorporate measures of past inflation or surveys of inflation expectations, and other information available at the time of each Monetary Policy Statement (MPS). This empirical test aims to determine the approach that captures pricing behaviour best, highlighting which may be best for forecasting going forward.

The results show that forecasts constructed using measures of past inflation have been more accurate than using survey measures of inflation expectations, including the 2-year ahead survey measure previously used by the Bank. In addition, forecasts constructed using measures of past inflation would have been significantly more accurate than the Bank’s MPS forecasts since 2009, and only slightly worse than these forecasts before the global financial crisis (GFC). The consistency of forecasts using past-inflation measures reduces the concern that this approach is only accurate when inflation is low, and suggests it may be a reasonable approach to forecasting non-tradables inflation generally.

From late 2015, the Bank has assumed that past inflation has affected domestic price-setting behaviour more than previously. As a result, monetary policy has needed to be more stimulatory than would otherwise be the case. This price-setting behaviour is assumed to persist, and is consistent with subdued non-tradables inflation and low nominal wage inflation in 2017.

Figure 6 shows the average 1-year ahead forecast of non-tradables inflation for the measures of past inflation and surveys of inflation expectations. The range of forecasts produced by the models is currently large relative to history, perhaps reflecting differences between the surveys of inflation expectations and measures of past inflation. The two most accurate measures (shown by the red lines) suggest non-tradables inflation will be between 2.5 and 3 percent in 2018 – similar to the forecast in the August 2017 MPS and only a little higher than the latest outturn of 2.4 percent in the June quarter 2017.

Conclusion

Non-tradable inflation has been surprisingly weak since 2014. Phillips curves with the survey of 2-year ahead inflation expectations suggest non-tradables inflation should have risen by more than we have seen, given the level of the unemployment rate and the Bank’s estimates of the output gap. This note shows that using measures of past CPI inflation instead of surveyed inflation expectations would have produced more accurate forecasts of non-tradables inflation, although not all of the weakness in non-tradables inflation would have been predicted.

The Bank has adjusted its forecasting models to better capture the role of past inflation, moving away from using the survey of 2-year ahead inflation expectations to underpin its forecasts

The Analytical Note series encompasses a range of types of background papers prepared by Reserve Bank staff. Unless otherwise stated, views expressed are those of the authors, and do not necessarily represent the views of the Reserve Bank.