We look at the RBA’s Committed Liquidity Facility as featured in this months RBA Bulletin.

Digital Finance Analytics (DFA) Blog
"Intelligent Insight"
We look at the RBA’s Committed Liquidity Facility as featured in this months RBA Bulletin.

We look at the RBA’s Committed Liquidity Facility as featured in this months RBA Bulletin.
In the latest RBA Bulletin there is an article on the Committed Liquidity Facility, which is a facility designed to support some of our major banks. Under the CLF, the Reserve Bank will provide an ADI with liquidity via repurchase agreements (repos), for a fee. Since the CLF was introduced in 2015, the number of ADIs that have applied to APRA to have a facility has risen from 13 to 15.

Under the Basel liquidity standard, the liquidity coverage ratio (LCR) requires authorised deposit-taking institutions (ADIs) to have enough high-quality liquid assets (HQLA) to cover their net cash outflows in a 30-day liquidity stress scenario. Jurisdictions with a clear shortage of domestic currency HQLA can use alternative approaches to enable financial institutions to satisfy the LCR – hence the CLF in Australia.
The RBA says the CLF has been in operation for five years and continues to be required given the still relatively low level of government debt in Australia. However, because the volume of HQLA securities has increased over recent years and they appear to have become more available for trading in secondary and repo markets, the Reserve Bank has assessed that the CLF ADIs should be able to raise their holdings to 30 per cent of the stock of HQLA securities. This increase will occur at a pace of 1 percentage point each year, commencing with an increase to 26 per cent in 2020. Taking into account how the CLF ADIs have responded to the framework between 2015 and 2019, the Reserve Bank has also concluded that the CLF fee should be increased from 15 basis points to 20 basis points by 2021; this is to proceed in two steps, with the fee rising to 17 basis points on 1 January 2020 and to 20 basis point on 1 January 2021.
These pricing changes will have only a minor impact on the CLF Banks in terms of their net interest margins, at a time when many other factors are in play, such as reductions in the RBA’s cash rate, competition for mortgages and the yield curve driving pricing in the 2-5 years portion of banks treasury portfolios.
But there are two bigger questions to ask and answer. First, given the size of Government debt now, and the flow of bonds available, why do we still need this facility at all?
Net general government debt at June 2019 is $374bn (19.2% of GDP), some $12.5bn higher than forecast in the April 2019 Budget
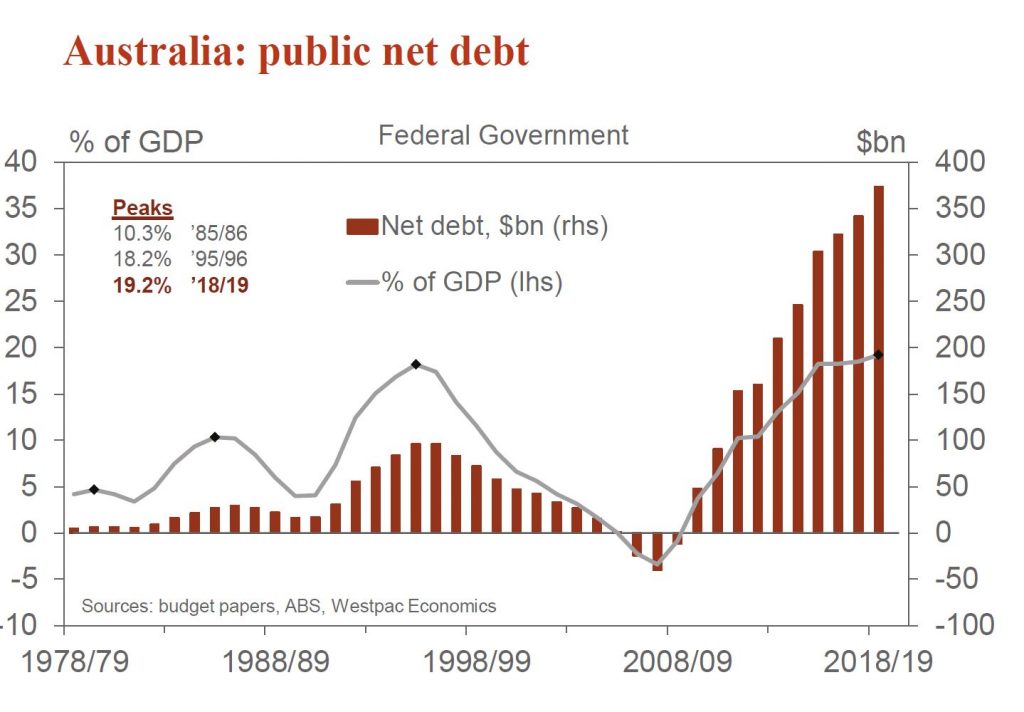
The answer to that, and the second point is the CLF is essentially a back-door QE measure. If international liquidity became an issue, or if rate decreases triggered a capital flight, the CLF allows the RBA to step in and fund the banks’ funding shortfall from a loss of international investors, at rates below the banks’ international funding rates. Thus, high cost international funding by the banks can easily be replaced by cheap RBA funding through a form of QE or money printing subsidising bank profits and banker bonuses – for a short period.
This also distorts the markets because there are many lenders unable to get the CLF, creating a two-tier banking system with the “blessed” 15 supported by the CLF.
This is what the RBA says:
The Reserve Bank provides the Committed Liquidity Facility (CLF) as part of Australia’s implementation of the Basel III liquidity standard.[1] This framework has been designed to improve the banking system’s resilience to periods of liquidity stress. In particular, the liquidity coverage ratio (LCR) requires authorised deposit-taking institutions (ADIs) to have enough high-quality liquid assets (HQLA) to cover their net cash outflows in a 30-day liquidity stress scenario. Under the Basel liquidity standard, jurisdictions with a clear shortage of domestic currency HQLA can use alternative approaches to enable financial institutions to satisfy the LCR. These include the central bank offering a CLF. This is a commitment by the central bank to provide funds secured by high-quality collateral through the period of liquidity stress. This commitment can then be counted by the ADI towards meeting its LCR requirement given the scarcity of HQLA. The Australian Prudential Regulation Authority (APRA) has implemented the LCR in Australia, incorporating a CLF provided by the Reserve Bank.[2]
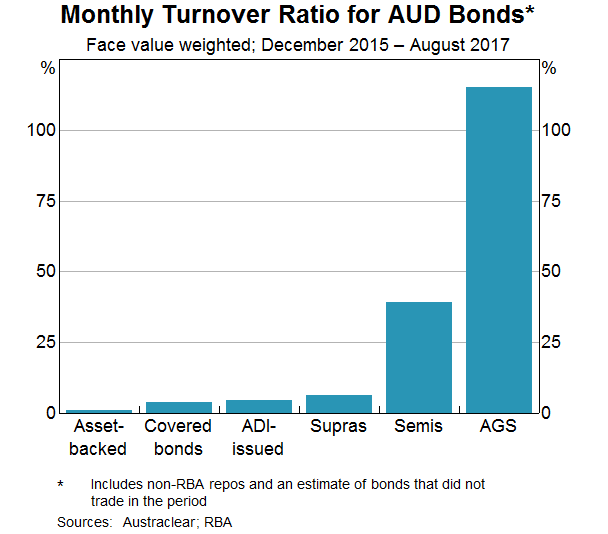
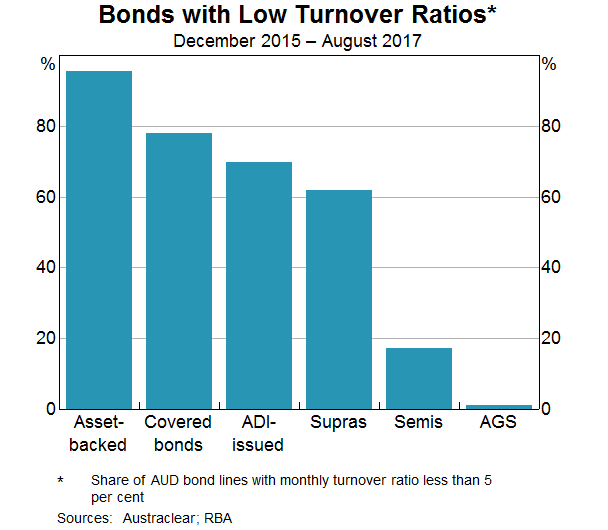
The Australian dollar securities that have been assessed by APRA to be HQLA are Australian Government Securities (AGS) and securities issued by the central borrowing authorities of the states and territories (semis). All other forms of HQLA available in Australian dollars are liabilities of the Reserve Bank, namely banknotes and Exchange Settlement Account (ESA) balances. For securities to be considered HQLA, the Basel liquidity standard requires that they have a low risk profile and be traded in an active and sizeable market. AGS and semis satisfy these requirements since they are issued by governments in Australia and are actively traded in financial markets. In contrast, there is relatively little trading in other key types of Australian dollar securities, such as those issued by supranationals and foreign governments (supras), covered bonds, ADI-issued paper and asset-backed securities (Graph 1). Given this, these securities are not classified as HQLA.
The supply of AGS and semis is not sufficient to meet the liquidity needs of the Australian banking system. This reflects the relatively low levels of government debt in Australia (Graph 2). When the CLF was first introduced in 2015, ADIs would have needed to hold around two-thirds of the stock of HQLA securities to be able to cover their LCR requirements. Such a high share of ownership by the ADIs would have reduced the liquidity of these securities, defeating the purpose of them being counted on as HQLA.
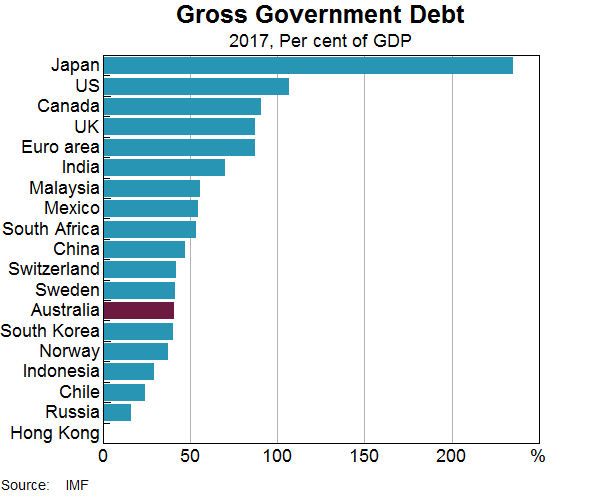
Jurisdictions with low government debt have used a range of approaches to address the resulting shortage of domestic currency HQLA. Australia is one of three countries that have put in place a CLF, along with Russia and South Africa. Some other jurisdictions have allowed financial institutions to hold HQLA in foreign currencies to cover their liquidity needs in domestic currency. The main downsides of the latter approach is that it relies on foreign exchange markets to be functioning smoothly in a time of stress and increases the foreign currency exposures in the banking system. Some jurisdictions have classified a broader range of domestic currency securities as HQLA. However, this approach has not been taken in Australia due to the low liquidity of Australian dollar securities other than AGS and semis.
APRA determines which ADIs can establish a CLF with the Reserve Bank. Access is limited to those ADIs domiciled in Australia that are subject to the LCR requirement.[3] Before establishing a CLF, these ADIs must apply to APRA for approval. In these applications, the ADIs have to demonstrate that they are making every reasonable effort to manage their liquidity risk independently rather than relying on the CLF. APRA also sets the size of the CLF, both in aggregate and for each ADI.
The Reserve Bank makes a commitment under the CLF to provide a set amount of liquidity against eligible securities as collateral, subject to the ADI having satisfied several conditions.[4] The ADI is required to pay a CLF fee to the Reserve Bank that is charged on the entire committed amount (not just the amount drawn). To access liquidity through the CLF, an ADI must make a formal request to the Reserve Bank that includes an attestation from its CEO that the institution has positive net worth. The ADI must also have positive net worth in the opinion of the Reserve Bank.
Under the CLF, the Reserve Bank will provide an ADI with liquidity via repurchase agreements (repos). In a repo, funds are exchanged for high-quality securities as collateral until the funds are repaid. These securities must meet criteria set by the Reserve Bank. The types of securities that the ADIs can hold for the CLF include self-securitised residential mortgage backed securities (RMBS), ADI-issued securities, supras, and other asset-backed securities. To protect against a decline in the value of these securities should an ADI not meet its obligation to repay, the Reserve Bank requires the value of the securities to exceed the amount of liquidity provided by a certain margin. These margins are set by the Reserve Bank to manage the risks associated with holding these securities.[5] If the CLF is drawn upon, the ADI must also pay interest to the Reserve Bank for the term of the repo at a rate set 25 basis points above the cash rate.
Since the CLF was introduced in 2015, the number of ADIs that have applied to APRA to have a facility has risen from 13 to 15.[6] Each year, APRA sets the total size of the CLF by taking the difference between the Australian dollar liquidity requirements of the ADIs and the amount of HQLA securities that the Reserve Bank assesses can be reasonably held by these ADIs (the CLF ADIs) without unduly affecting market functioning.
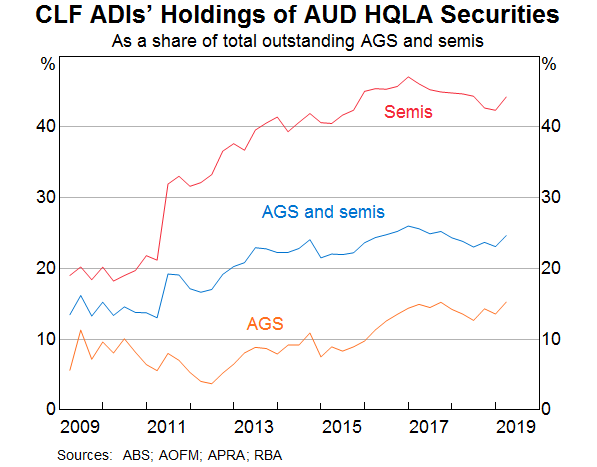
For 2015-19, the Reserve Bank assessed that the CLF ADIs could reasonably hold 25 per cent of the stock of HQLA securities. In determining this, the Reserve Bank took into account the impact of the CLF ADIs’ holdings on the liquidity of HQLA securities in secondary markets, along with the holdings of other market participants. The volume of HQLA securities that the CLF ADIs could reasonably hold increased from $175 billion in 2015 to $225 billion in 2019, reflecting growth in the stock of HQLA securities (Table 1). Over the period, the CLF ADIs held a significantly higher share of the stock of HQLA securities than in the years leading up to the introduction of the LCR (Graph 3). The CLF ADIs have been holding a larger share of the stock of semis compared to AGS.
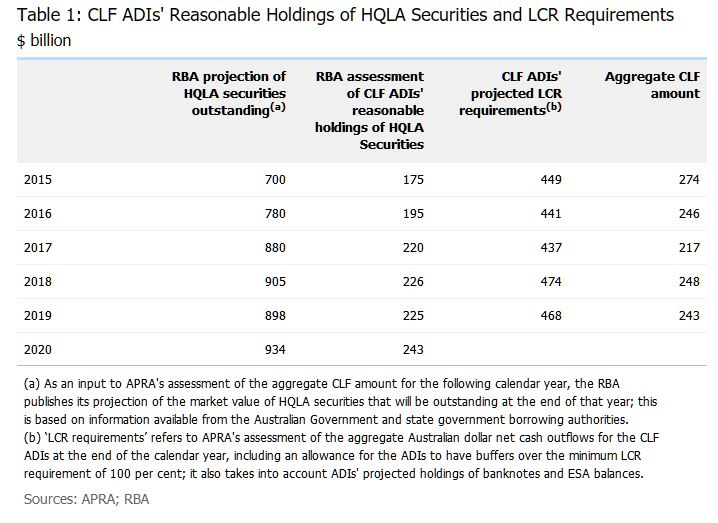
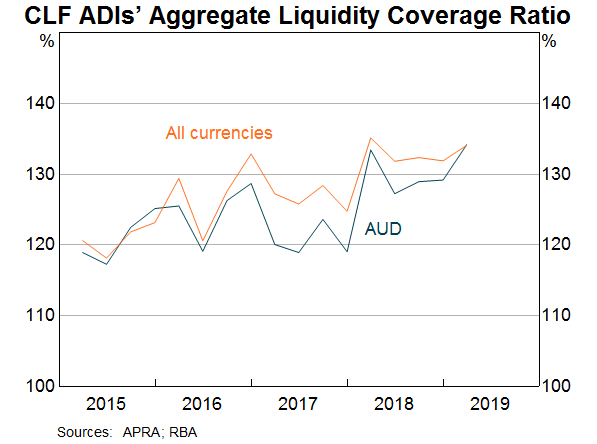
The CLF ADIs’ projected LCR requirements, which were used in calculating the CLF, increased modestly in aggregate from $449 billion in 2015 to $468 billion in 2019. This increase can be entirely explained by the CLF ADIs seeking to raise their liquidity buffers over time to be well above the minimum LCR requirement of 100. Reflecting this, the aggregate LCR for these ADIs increased from around 120 per cent in 2015 to around 130 per cent in 2019; this was the case for their Australian dollar liquidity requirements as well as for their requirements across all currencies (Graph 4).[7]
The aggregate CLF amount is the CLF ADIs’ projected LCR requirements less the RBA’s assessment of their reasonable holdings of HQLA securities. APRA reduced the aggregate size of the CLF from $274 billion in 2015 to $243 billion in 2019. This reflected that the volume of HQLA securities that the CLF ADIs could reasonably hold increased by more than their projected liquidity requirements over this period.
From 2015 to 2019, the Reserve Bank charged a CLF fee of 15 basis points per annum on the commitment to each ADI. The fee is set so that ADIs face similar financial incentives to meet their liquidity requirements through the CLF or by holding HQLA. The amount of CLF fee paid by the CLF ADIs to the Reserve Bank declined from $413 million in 2015 to $365 million in 2019, which is in line with the reduction in the size of the CLF. Since the CLF was established, no ADI has drawn on the facility in response to a period of financial stress.[8]
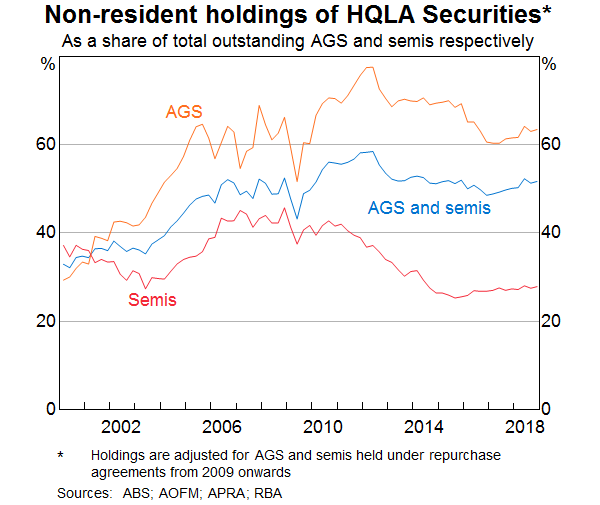
When assessing the volume of HQLA securities that the CLF ADIs can reasonably hold, the Reserve Bank seeks to ensure that these holdings are not so large that they impair market functioning or liquidity. For the period from 2015 to 2019, the Reserve Bank assessed that the CLF ADIs could reasonably hold 25 per cent of HQLA securities without materially reducing their liquidity. This was informed by the fact that a large proportion of HQLA securities were owned by ‘buy and hold’ investors. These investors were price inelastic and generally did not lend these securities back to the market, reducing the free float of HQLA securities. Many of these investors were non-residents (such as sovereign wealth funds), which were holding nearly 60 per cent of the stock of HQLA securities earlier in the decade (Graph 5). So overall, the Reserve Bank concluded that these bond holdings were not contributing significantly to liquidity in the market.
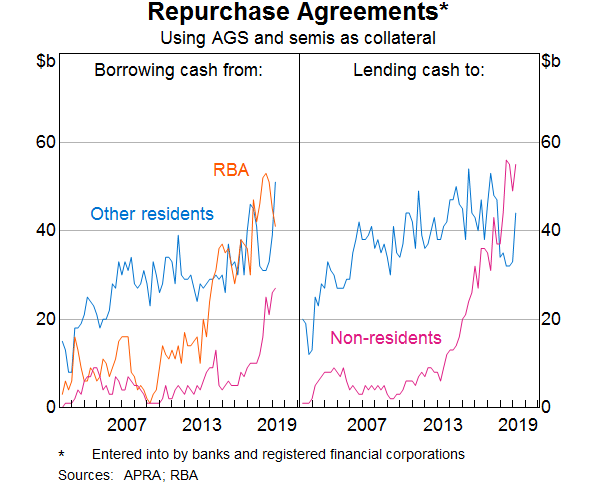
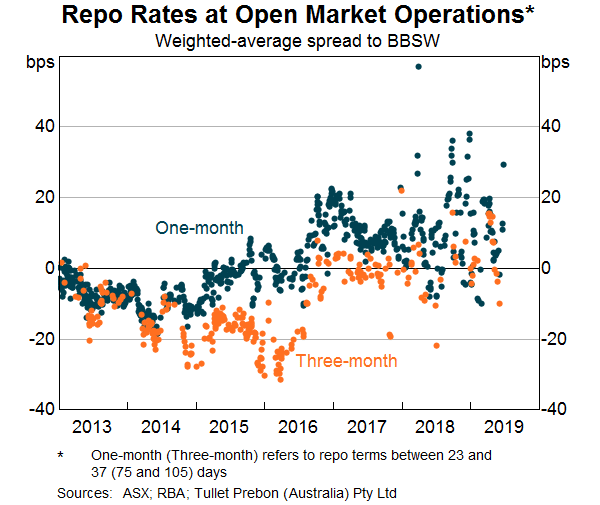
Over recent years, the volume of HQLA securities has risen and they have become more readily available in bond and repo markets (Table 1). The Australian repo market has grown considerably, driven by more HQLA securities being sold under repo. Since 2015, non-residents have emerged as significant lenders of AGS and semis (and borrowers of cash) in the domestic market (Graph 6). Over the same period, repo rates at the Reserve Bank’s open market operations have risen relative to unsecured funding rates (Graph 7). This is consistent with market participants financing a larger volume of HQLA securities on a short-term basis through the repo market. For this assessment, the increased availability of HQLA securities in the market suggests that the CLF ADIs should be able to hold a higher share of these securities without impairing market functioning.
Analysis of transactions in the bond and repo markets using data from 2015–17 suggests that most HQLA securities were being actively traded.[9] Monthly turnover ratios for AGS bond lines were well above zero, and much higher than turnover ratios for other Australian dollar securities such as asset-backed securities, covered bonds, ADI-issued paper and supras (Graph 1). Although semis bond lines were traded less frequently than AGS, relatively few semis had low turnover ratios (Graph 8). As such, some increase in ADIs’ holdings of AGS and semis would appear unlikely to jeopardise liquidity in these markets.
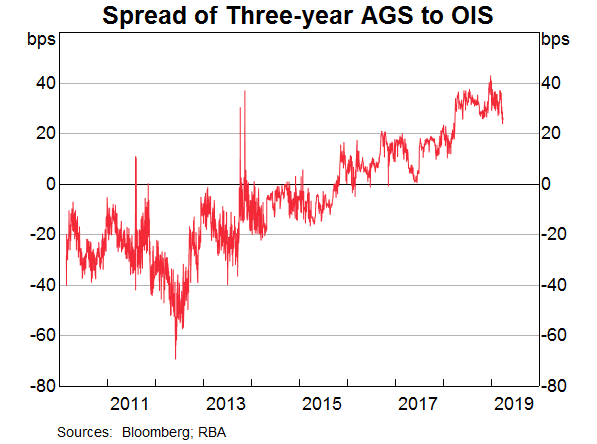
Earlier in the decade, a ‘scarcity premium’ had emerged in the pricing of HQLA securities. Australia’s relatively strong economic performance and AAA sovereign rating have been of considerable appeal to investors with a preference for highly rated securities. Higher yields compared to other AAA-rated sovereigns also contributed to strong demand from foreign investors, particularly for AGS. The scarcity premium was most prominent before 2015, when the yield on 3-year AGS was well below the expected cash rate over the equivalent horizon (as measured by overnight indexed swaps (OIS); Graph 9). However, the scarcity premium has dissipated alongside an increase in the stock of AGS on issue. This suggests that there is scope for the CLF ADIs to hold more HQLA securities without impairing market functioning.
Given these developments, the Reserve Bank has assessed that the CLF ADIs should be able to increase their holdings to 30 per cent of the stock of HQLA securities.[10] To ensure a smooth transition and thereby minimise the effect on market functioning, the increase in the CLF ADIs’ reasonable holdings of HQLA securities will occur at a pace of 1 percentage point per year until 2024, commencing with an increase to 26 per cent in 2020.
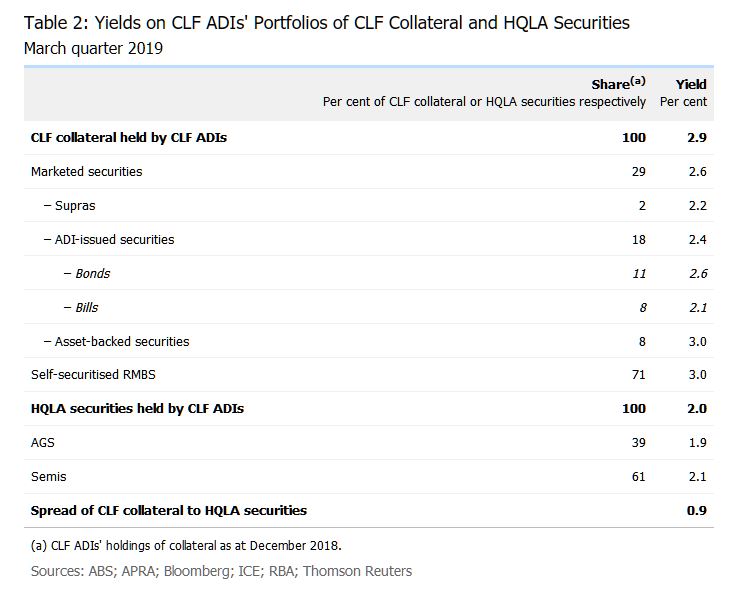
The Reserve Bank sets the level of the CLF fee such that ADIs face similar financial incentives when holding additional HQLA securities or applying for a higher CLF in order to satisfy their liquidity requirements. A useful starting point to assess the appropriate CLF fee is to compare the yields on the CLF collateral and the HQLA securities held by the relevant ADIs.[11] The Reserve Bank estimated that the weighted average yield differential between the CLF collateral and the HQLA securities was around 90 basis points in the March quarter 2019 (Table 2). This includes the compensation required by ADIs to account for the higher credit risk associated with holding CLF collateral rather than HQLA securities, which would be a sizeable share of the spread. However, it is only the additional liquidity risk associated with holding CLF collateral that should be reflected in the CLF fee. In practice, adjusting the spread between CLF collateral and HQLA securities to remove the credit risk component is not straightforward.
When the Reserve Bank set the CLF fee earlier this decade, it looked at repo rates on some CLF-eligible securities to gauge how much a one-month liquidity premium might be worth. Before late 2013, it was possible to separately identify repo rates on government securities (AGS and semis) and private securities (such as ADI-issued securities) in the Reserve Bank’s market operations. Based on these data, it was estimated that the one-month liquidity premium for private securities was less than 10 basis points in normal circumstances. However, given that part of the purpose of the liquidity reforms was to recognise that the market had under-priced liquidity in the past, it was judged to have been appropriate to set the fee at 15 basis points.
It has since become more difficult to gauge a liquidity premium by using repo rates. In particular, in late 2013 the Reserve Bank ceased to charge different repo rates for government and private securities. Instead, the Bank revised its margin schedule to manage the credit risk on different types of collateral accepted under repo. Moreover, most of the collateral now being purchased by the Reserve Bank under repo is HQLA securities. This suggests that repo rates mostly reflect the price for converting HQLA securities into ESA balances, rather than CLF collateral into HQLA.
At the same time, it is now possible to take into account how the CLF ADIs have responded to the existing framework when setting the future CLF fee. Since the CLF was introduced, the CLF ADIs (in aggregate) have consistently overestimated their liquidity requirements (Table 3). This has resulted in the CLF ADIs being granted larger CLF amounts, which they have mainly used to hold larger buffers above the minimum required LCR of 100 (Graph 4).[12] In recent years, the CLF ADIs have also been holding fewer HQLA securities than the Reserve Bank had judged could be reasonably held without impairing the market for HQLA securities. Taken together, these two observations suggest that the CLF fee should be set at a higher level in future.
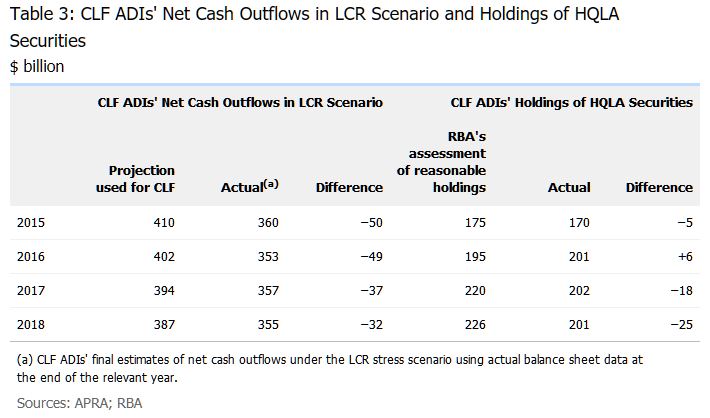
However, there is uncertainty about the exact level of the fee that would make ADIs indifferent between holding more HQLA or applying for a larger CLF. If the CLF fee is set too high, this could trigger a disruptive shift away from using the facility and distort the markets that use HQLA. This has potential implications for the implementation of monetary policy, since the market that underpins the cash rate involves the trading of ESA balances, which are also HQLA.[13] The remuneration on ESA balances is purposefully set at a rate of 25 basis points below the cash rate target in order to encourage ADIs to recycle their surplus ESA balances rather than holding them. There are scenarios where holding ESA balances could be a cheaper way to satisfy the LCR than holding HQLA securities. For instance, earlier in the decade, the yield on AGS was at or below the expected return from holding ESA balances (Graph 9). In this context, the CLF fee should be set such that ADIs would not have an incentive to meet their LCR requirements by holding excessive ESA balances.
As a result of these considerations, the RBA has concluded that the CLF fee should be increased moderately. This should ensure that ADIs have strong incentives to manage their liquidity risk appropriately, without generating unwarranted distortions in the markets that use HQLA. To ensure a smooth transition by minimising the effect on market functioning, the increase will occur in two steps, with the CLF fee rising to 17 basis points on 1 January 2020 and to 20 basis points on 1 January 2021.[14]
The RBA released their minutes today. Clear talk of more cuts, against a weaker global scene. But holding on to households spending more as the housing sector wakens. Rates will be lower for longer as Central Banks globally cut to the max. Saved somewhat by Government spending and higher iron ore price, but small businesses not borrowing, and households not spending.

International Economic Conditions
Members commenced their discussion of the global economy by noting that business conditions in the manufacturing sectors in many economies had remained subdued. They discussed the escalation of the US–China trade and technology disputes, which had intensified the downside risks to the global outlook. By contrast, conditions in more domestically focused sectors had generally continued to be resilient, supported by ongoing strength in labour markets. Employment growth had remained robust in the major advanced economies, although it had eased a little in some economies in recent months, and unemployment rates had remained low. Although wages growth had picked up, year-ended inflation had remained below target in the major advanced economies. Members noted that inflation in the United States had increased in recent months.
The main development over the previous month had been the escalation of the US–China trade and technology disputes. The United States had announced higher tariffs on most imports from China, including consumer goods that had not previously been subject to the tariff increases, to take effect over the remainder of 2019. Members noted that recent and prospective increases in tariffs could increase consumer price inflation in the United States by between ¼ and ½ percentage point over the following few years, based on a range of published estimates. In response to the US announcements, China had suspended purchases of US agricultural products and had announced plans to increase tariffs on around one-half of the value of US imports. In value terms, US exports to China had contracted by around 20 per cent over the year to June, while US imports from China had been around 3 per cent lower. Members also noted that some other east Asian economies were benefiting from the diversion of US imports away from China.
More generally, global trade volumes had fallen over the previous year, reflecting both the escalation of trade tensions and slower growth in Chinese domestic demand. Weak external demand had been reflected in slowing growth in global industrial production and below-average conditions in the global manufacturing sector. Recent indicators suggested trade-related activity would remain weak for some time.
Members noted that weak external demand and heightened geopolitical uncertainty had contributed to lower growth in business investment in many economies, including the United States, the euro area and the United Kingdom. These economies had also recorded declines in investment intentions. By contrast, in the United States the household sector had been resilient, but overall GDP growth had slowed in the June quarter. GDP growth had also slowed in most euro area countries in the June quarter; Germany had recorded a small contraction in GDP. By contrast, GDP growth in Japan had been moderate, supported by consumption brought forward ahead of a scheduled increase in the consumption tax in October, as well as ongoing growth in investment, bolstered by the need to address labour shortages.
Recent data suggested that growth in China had eased further. Most indicators of economic activity had slowed in July, including in components being supported by recent policy measures, such as infrastructure investment. The level of steel production had declined slightly. Retail sales growth had resumed its downward trend, after having received a boost from strong growth in car sales in recent months ahead of tighter emission standards coming into effect. In India, recent indicators had also pointed to output growth slowing.
Weak global trade had continued to weigh on growth in east Asia. Trade within the region and with China had contracted further in June. Growth in industrial production and survey measures of manufacturing conditions had remained weak. Political unrest had weighed on economic conditions for businesses and households in Hong Kong, while an ongoing dispute with Japan had disrupted South Korean production of electronics. However, domestic demand elsewhere in the region had held up, supported by government policies in some cases.
Iron ore prices had declined since the previous meeting, but were around 40 per cent higher than a year earlier. Market reports had attributed these declines to a number of factors, including concerns about the outlook for steel demand in China following the escalation of the disputes between the United States and China in early August, lower steel prices and an easing in supply concerns. The prices of coal and rural commodities had been somewhat lower over the prior month, while oil and base metals prices had been little changed, except where there had been disruptions to the supply of specific metals.
The main information on the domestic economy received since the previous meeting had been on the labour market as well as partial indicators of output growth in the June quarter in the lead-up to the publication of the national accounts. Quarterly GDP growth was expected to be around ½ per cent, supported by a strong recovery in resource exports from earlier supply disruptions.
The ABS capital expenditure (Capex) survey suggested that mining investment had grown in the June quarter, driven by an increase in machinery & equipment investment. The Capex survey suggested there had also been an increase in machinery & equipment investment by the non-mining sector in the June quarter, while non-residential construction was expected to have declined. Investment intentions for 2019/20 had been positive for the mining sector, but had been modestly lower for the non-mining sector. Members noted that the outlook for the construction sector was particularly weak.
Members recognised that, overall, Australian businesses had not appeared to have been affected by the weak trade environment to the same extent as businesses in other advanced economies. This was partly because Australia’s exports are more exposed to Chinese domestic demand and less integrated in global supply chains.
Consumption growth was expected to have remained low in the June quarter. Retail sales volumes had been weak in the June quarter and the value of retail sales had fallen in July. The low- and middle-income tax offset (LMITO) was expected to boost household income, and thus support consumption growth, in coming quarters. However, the Bank’s liaison with retailers suggested that this had yet to lift spending noticeably. Members noted that even if the LMITO was used to pay off debts, this would still bring forward the point at which households could increase their spending.
Established housing market conditions had steadied in recent months. Reported housing prices in Sydney and Melbourne had risen noticeably in August and auction clearance rates had increased further, although volumes had remained low. Housing market conditions had been subdued elsewhere, although there were signs of housing prices stabilising in Brisbane. Housing turnover had remained low. Consequently, spending on home furnishings and other housing-related items was not expected to contribute to consumption growth in the near term. Indicators suggested that dwelling investment had declined further in the June quarter and indicators of earlier stages of residential building activity had remained weak; building approvals had declined further in June and other measures of early-stage activity and buyer interest had remained at low levels.
Employment growth had remained strong in July, but the unemployment rate had remained at 5.2 per cent. Employment growth over preceding months had been broadly based across states and had predominantly been in full-time work. Strong employment growth had been accompanied by a further increase in the participation rate, which had recorded another all-time high. Members noted that the increase in participation had been particularly notable for New South Wales. Forward-looking indicators had continued to suggest that employment growth would moderate over the following six months. Information from liaison suggested employment intentions had remained weak in the residential construction sector but positive among services firms.
Wages growth had remained low and the upward trend in wages growth appeared to have stalled. The wage price index had increased by 2.3 per cent over the year to the June quarter. Private sector wages growth had been unchanged in the quarter, while public sector wages growth had been a little higher. Most of this increase had been the result of a one-off adjustment to equalise the wages of nurses and midwives in Victoria with those in New South Wales.
Members commenced their discussion of financial markets by noting that government bond yields had declined and were at record lows in many countries, including Australia. Volatility and risk premiums in global financial markets had increased in August, following the escalation of the disputes between the United States and China and disappointing economic data releases in Germany and China. The persistent downside risks to the global economy, combined with subdued inflation, had led a number of central banks to reduce interest rates in recent months and further monetary easing was widely expected.
In the United States, market pricing implied that the federal funds rate was expected to decline by around 100 basis points over the following year. Market participants also expected the European Central Bank to provide additional monetary stimulus in the near term, including renewed asset purchases and a reduction in its policy rate further into negative territory. Central banks in a number of other advanced economies had also eased policy, or signalled that they were prepared to do so, in response to subdued inflation, moderating activity and downside risks to growth. For similar reasons, central banks in emerging markets had also been easing policy over recent months and had signalled the possibility of further easing.
Financial conditions for corporations remained accommodative globally. This reflected market participants’ ongoing expectations that central banks were likely to deliver further monetary easing to sustain the global economic expansion. Corporate bond spreads had increased a little in August, but remained low. Equity prices had declined somewhat, reflecting concerns about the outlook for growth, but remained substantially higher over the year to date. In Australia, equity prices were 5 per cent below the record high reached in late July. Australian listed companies’ profits had risen, driven by the resources sector. At the aggregate level, companies had increased their dividends over the preceding year, although this reflected higher dividends in the resources sector in particular.
In China, the authorities had intervened to support three small banks in preceding months, and the People’s Bank of China had continued to maintain a high level of liquidity in the banking system. While funding conditions for smaller banks had tightened this year, money market rates and corporate and government bond yields in China had generally remained low and market participants were expecting further easing in monetary policy in the period ahead.
In foreign exchange markets, the Chinese renminbi had depreciated against the US dollar in August following the escalation of the US–China disputes, while the Japanese yen had appreciated over the month. The Australian dollar had been little changed at around its lowest level in some years.
In Australia, borrowing rates for both businesses and households were at historically low levels, as were banks’ funding costs. Variable mortgage rates had declined broadly in line with the reductions in the cash rate in June and July. Fixed mortgage rates had also declined substantially over the preceding six months. Financial market pricing continued to imply that the cash rate was expected to be lowered by another 25 basis points by November 2019, with a further cut expected in the early part of 2020.
Growth in housing credit had been little changed over the year to July, having declined steadily through 2018. Credit to investors had declined slightly over previous months. Meanwhile, housing loan approvals to both owner-occupiers and investors had increased for the second consecutive month in July. This pick-up in loan approvals had followed a significant decline over the preceding two years and was consistent with the signs of stabilisation in the established housing market. Borrowing by large businesses had continued to grow at a relatively strong pace. In contrast, small businesses’ access to finance remained difficult, and had become more difficult over the preceding year as banks had tightened their lending practices. While new sources of non-traditional finance had been growing, including equity funding from family offices and private equity funds, they remained a small share of business funding.
Members had a detailed discussion of the ways in which financial conditions abroad affect Australia. They discussed how shifts in world interest rates and global risk premiums flow through to domestic financial conditions. While Australia’s floating exchange rate means that monetary policy can be set largely according to domestic considerations, members discussed the large shifts in savings/investment decisions globally, which were affecting the level of interest rates everywhere, including in Australia. Members also noted the critical role that the exchange rate had played over many years as a shock absorber for the Australian economy. One important factor here has been that Australian entities raising offshore funding are able to do so in Australian dollars, either directly or via hedging markets.
Turning to the policy decision, members observed that the news on the international economy had confirmed that the risks to the global growth outlook were to the downside. The trade disputes between the United States and China had escalated and growth in China had continued to slow. There had been further indications that these developments were affecting trade and investment decisions in overseas economies, although businesses had continued hiring and labour market conditions had remained tight.
Against this backdrop and with ongoing low inflation, a number of central banks had reduced interest rates over recent months and further monetary easing was widely expected. Long-term government bond yields had declined and were at record lows in many countries, including Australia. Borrowing rates for both businesses and households were also at historically low levels, and the Australian dollar exchange rate was at the lowest level that it had been in recent times.
Domestically, members considered a number of developments over preceding months that had a bearing on the monetary policy decision. First, employment had continued to grow strongly and the participation rate was at a record high. However, the unemployment rate had remained steady at around 5.2 per cent over recent months. At the same time, wages growth had remained low and there were few indications that wage pressures were building. Members noted that a further gradual lift in wages growth would be a welcome development. Taken together, recent outcomes suggested that spare capacity remained in the labour market and that the Australian economy could sustain lower rates of unemployment and underemployment.
Second, there had been further signs of a turnaround in established housing markets, especially in Sydney and Melbourne, although housing turnover had remained low. Housing credit growth had remained subdued, although mortgage rates were at record low levels and there was strong competition for borrowers of high credit quality. Data on residential building approvals and information from the Bank’s liaison program suggested that there was likely to be further weakness in dwelling investment in the near term; members recognised that this could sow the seeds of an upswing in the housing price cycle at some point, particularly given the lengthy stages in the construction of higher-density residential housing. Demand for credit by investors continued to be subdued and credit conditions, especially for small and medium-sized businesses, remained tight.
Finally, based on partial indicators, GDP growth in the June quarter was expected to have been around ½ per cent. The largest contributions to growth were expected to have been from exports and public demand. Private final demand, which includes consumption, business investment and dwelling investment, was expected to have been weak.
Looking forward, the outlook for output growth was being supported by the low level of interest rates, recent tax cuts, signs of stabilisation in some established housing markets and a brighter outlook for the resources sector. A key uncertainty continued to be the outlook for consumption growth, which was expected to increase over time, supported by a gradual pick-up in growth in household disposable income and improvements in conditions in the housing market. Inflation pressures remained subdued, but inflation was expected to increase gradually to be a little above 2 per cent over 2021 as output growth picked up and the labour market tightened.
Based on the information available, members judged that it was reasonable to expect that an extended period of low interest rates would be required in Australia to make sustained progress towards full employment and achieve more assured progress towards the inflation target. Members would assess developments in both the international and domestic economies, including labour market conditions, and would ease monetary policy further if needed to support sustainable growth in the economy and the achievement of the inflation target over time.
The Board decided to leave the cash rate unchanged at 1.00 per cent.
Australian prime home loan arrears fell in July in all states except NSW and South Australia, but they remain above their five-year average, new data from Standard & Poor’s has shown, via The Adviser.
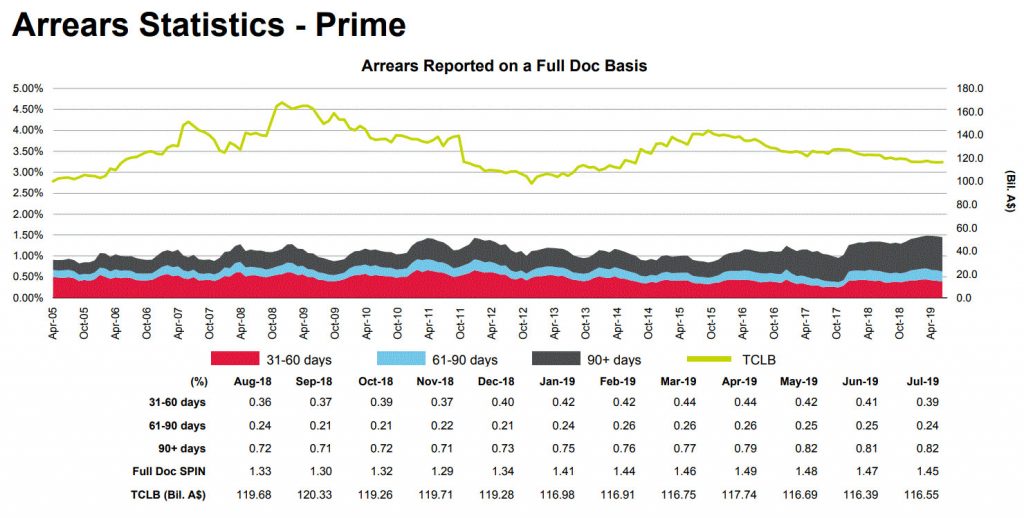
The Standard & Poor’s Performance Index (SPIN) for Australian prime mortgages dropped to 1.49 per cent in July 2019, down from 1.51 per cent a month earlier, S&P Global Ratings’ recent RMBS Arrears Statistics: Australia report showed.
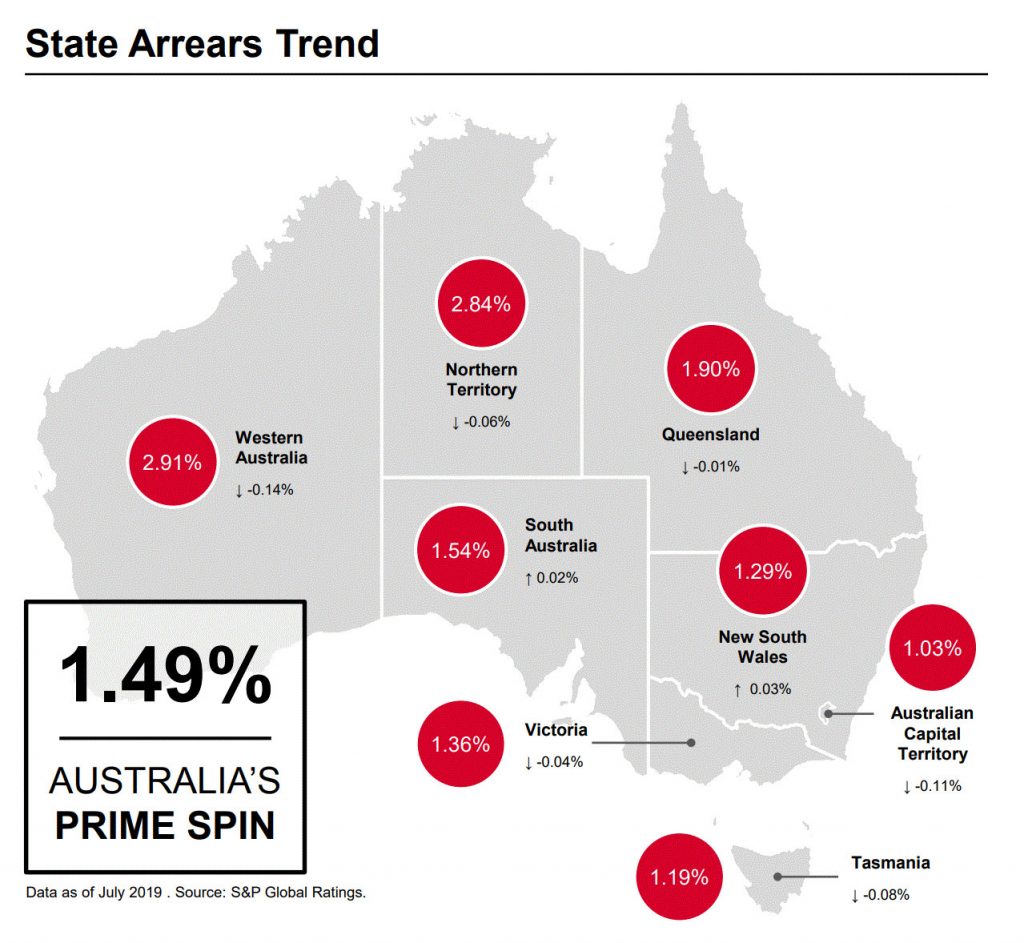
According to the data, which measures the weighted average of residential mortgage loans that are more than 30 days past due in publicly and privately rated Australian RMBS transactions, prime arrears typically drop in spring and are expected to decline during the third quarter of the year.
However, while the arrears index dropped month-on-month, the data showed that arrears were 11 basis points higher than they were in July 2018 and remain above their five-year average of 1.25 per cent.
Looking at arrears on a national level, arrears improved in six states and territories, with NSW and South Australia showing an uptick in arrears.
NSW saw an increase to 1.29 per cent, while South Australia saw arrears rise to 1.54 per cent in July 2019.
Western Australia recorded the largest drop in arrears during July, with the rate decreasing 14 basis points to 2.91 per cent.
According to S&P, the majority of this improvement was for loans 30-60 days in arrears. Loans more than 90 days in arrears, however, continued to increase in the western state.
Owner-occupier arrears improved in July, falling by 3 basis points to 1.71 per cent.
However, investor arrears remained mostly unchanged in July, falling by 1 basis point to 1.46 per cent from the previous month.
According to S&P, this partly reflects the “generally tighter lending conditions for investors in the current environment”.
“We expect arrears to continue to decline as the recent rate cuts filter through. These improvements are likely to be seen in the earlier arrears categories, which are more sensitive to interest-rate movements. We expect longer-dated arrears to remain elevated in a softer economic environment,” S&P analysts stated.
“Recent rises in housing finance approvals could bolster refinancing conditions, which started to improve in July, rising 5.4 per cent in seasonally adjusted terms. This will help to stabilize arrears and prepayment rates if the current momentum continues because refinancing is a common way for borrowers to self-manage their way out of arrears.”
RBA on the rising arrears rate
The level of mortgages past due has been noted in recent months, with the Reserve Bank of Australia’s head of financial stability, Jonathan Kearns, noting in June that the number of people in arrears on their home loans had reached the highest level recorded since the global financial crisis.
In an address to the 2019 Property Leaders’ Summit in Australia in June, Mr Kearns discussed the factors contributing to the continual rise in home loan arrears.
Mr Kearns claimed that “cyclical upswings” in arrears were attributable to weak economic conditions, which include falling or stagnant wages and softness in the housing market – which may inhibit some borrowers from selling their property to ease their mortgage burden.
The head of financial stability also acknowledged that tighter lending standards can conversely impact a borrower’s ability to meet their mortgage repayments, pointing to previous restrictions on interest-only lending, which prevented borrowers from rolling over the interest-only period.
Mr Kearns also conceded that tighter serviceability measures may prevent distressed borrowers from refinancing their loan, cited by S&P as one of the factors contributing to the rise in delinquencies.
However, Mr Kearns pointed to internal data collected by the Reserve Bank, which suggested that the application of tighter lending standards has been “effective” in improving credit quality.
Mr Kearns said at the time that he expected the overall arrears rate to continue rising, but he claimed the trend would not pose a significant threat to financial stability.
“To the extent that we can point to drivers of the rise in arrears, while the economic outlook remains reasonable and household income growth is expected to pick up, the influence of at least some other drivers may not reverse course sharply in the near future, and so the arrears rate could continue to edge higher for a bit longer,” he said.
“But with overall strong lending standards, so long as unemployment remains low, arrears rates should not rise to levels that pose a risk to the financial system or cause great harm to the household sector.”
At its meeting today, the Board decided to leave the cash rate unchanged at 1.00 per cent.

The outlook for the global economy remains reasonable, although the risks are tilted to the downside. The trade and technology disputes are affecting international trade flows and investment as businesses scale back spending plans due to the increased uncertainty. At the same time, in most advanced economies, unemployment rates are low and wages growth has picked up, although inflation remains low. In China, the authorities have taken further steps to support the economy, while continuing to address risks in the financial system.
Global financial conditions remain accommodative. The persistent downside risks to the global economy combined with subdued inflation have led a number of central banks to reduce interest rates this year and further monetary easing is widely expected. Long-term government bond yields have declined and are at record lows in many countries, including Australia. Borrowing rates for both businesses and households are also at historically low levels. The Australian dollar is at its lowest level of recent times.
Economic growth in Australia over the first half of this year has been lower than earlier expected, with household consumption weighed down by a protracted period of low income growth and declining housing prices and turnover. Looking forward, growth in Australia is expected to strengthen gradually to be around trend over the next couple of years. The outlook is being supported by the low level of interest rates, recent tax cuts, ongoing spending on infrastructure, signs of stabilisation in some established housing markets and a brighter outlook for the resources sector. The main domestic uncertainty continues to be the outlook for consumption, although a pick-up in growth in household disposable income and a stabilisation of the housing market are expected to support spending.
Employment has grown strongly over recent years and labour force participation is at a record high. The unemployment rate has, however, remained steady at 5.2 per cent over recent months. Wages growth remains subdued and there is little upward pressure at present, with strong labour demand being met by more supply. Caps on wages growth are also affecting public-sector pay outcomes across the country. A further gradual lift in wages growth would be a welcome development. Taken together, recent labour market outcomes suggest that the Australian economy can sustain lower rates of unemployment and underemployment.
Inflation pressures remain subdued and this is likely to be the case for some time yet. In both headline and underlying terms, inflation is expected to be a little under 2 per cent over 2020 and a little above 2 per cent over 2021.
There are further signs of a turnaround in established housing markets, especially in Sydney and Melbourne. In contrast, new dwelling activity has weakened. Growth in housing credit remains low. Demand for credit by investors continues to be subdued and credit conditions, especially for small and medium-sized businesses, remain tight. Mortgage rates are at record lows and there is strong competition for borrowers of high credit quality.
It is reasonable to expect that an extended period of low interest rates will be required in Australia to make progress in reducing unemployment and achieve more assured progress towards the inflation target. The Board will continue to monitor developments, including in the labour market, and ease monetary policy further if needed to support sustainable growth in the economy and the achievement of the inflation target over time.
We look at the latest corporate plans put out my the RBA and APRA

The RBA has released its corporate plan. Its a pretty vague document. APRA’s plan, also released, is worse.
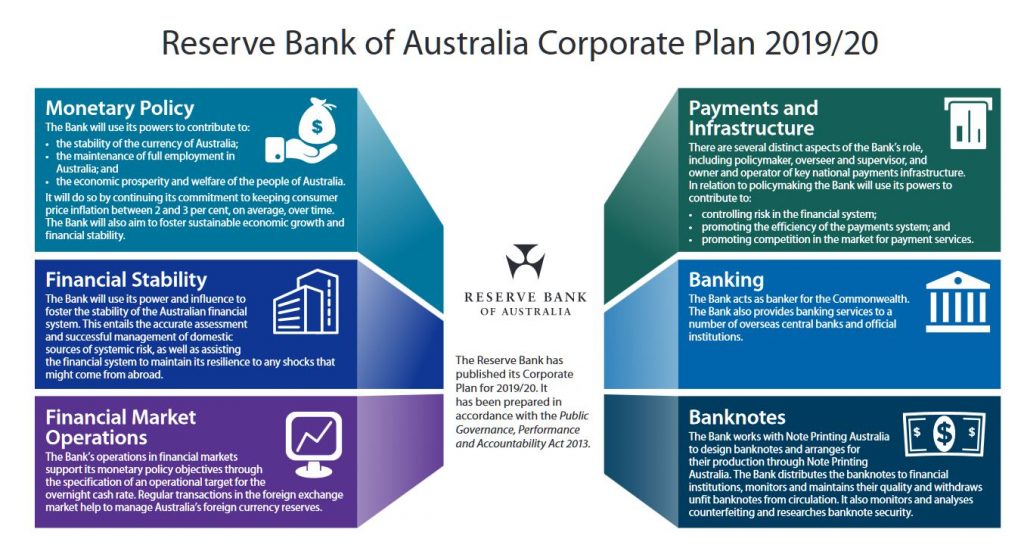
But, the Reserve Bank of Australia has pointed to Australia’s high debt levels as a factor in its decision making for the cash rate, fearing that it will make the economy more vulnerable to shocks.
Just remember this in the context of APRA reducing the lending standards recently! And in APRA’s Corporate plan Australia’s banking watchdog will stress test the country’s banks every year, instead of the current three-year cycle, ramping up oversight of a sector that has been marred by misconduct.
In the most recent series of stress tests in 2017, all 13 of the country’s largest banks passed the “severe but plausible” scenarios applied by the regulator, despite projected losses of about A$40 billion in home loans alone.
This of course is based on individual bank modelling, and does not really consider the implications of multiple lenders tapping the markets at the same time. This means the stress tests are pretty weak.
Now back to the RBA. Via, InvestorDaily.
The RBA published its four-year corporate plan on Friday, pointing to the banks’ exposure to housing loans and cyber security in financial institutions as the largest risks to the country’s financial stability.
In Australia, wages growth is low, reflecting spare capacity in the labour market as well as some structural factors.
The central bank expects the unemployment rate will remain around 5.25 per cent for a time, before declining to around 5 per cent in 2021, with wages growth expected to remain stable and then increase modestly from 2020.
Consumer price inflation is forecast to increase to be a little under 2 per cent over 2020 and a little above 2 per cent over 2021.
The RBA noted over the next four years, “movements in asset values and leverage may be more important for economic developments than in the past given the already high levels of debt on household balance sheets.
“Especially in the context of weak growth in household income, high debt levels could complicate future monetary policy decisions by making the economy less resilient to shocks,” the RBA said.
The central bank noted policymakers in the US and other countries employing quantitative easing as a result of intensifying trade and technology disputes.
Globally, the RBA reported, labour market conditions remain tight in major advanced economies, although unemployment rates are at multidecade lows.
“Global interest rates and measures of financial market volatility both remain low compared with historical experience,” the RBA said in its corporate plan.
“The future path of global monetary policy and financial conditions more generally remain subject to substantial uncertainty. These global factors significantly influence the environment in which monetary policy in Australia is conducted,” the RBA said.
Last week, RBA governor Philip Lowe reflected on the RBA’s decision on the cash rate during an address to Jackson Hole Symposium in Wyoming.
“So the question the Reserve Bank Board often asks itself in making its interest rate decision is how our decision can best contribute to the welfare of the Australian people,” Mr Lowe said.
“Keeping inflation close to target is part of the answer, but it is not the full answer. Given the uncertainties we face, it is appropriate that we have a degree of flexibility, but when we use this flexibility we need to explain why we are doing so and how our decisions are consistent with our mandate.”
He said a challenge the central bank is facing is elevated expectations that monetary policy can deliver economic prosperity.
“The reality is more complicated than this, not least because weak growth in output and incomes is largely reflecting structural factors,” Mr Lowe commented.
“Another element of the reality we face is that monetary policy is just one of the levers that are potentially available for managing the economy. And, arguably, given the challenges we face at the moment, it is not the best lever.”
The RBA is due to deliver its cash rate decision tomorrow.
We discuss the latest credit data from the RBA, APRA and also building approvals from the ABS. Wall to wall disappointment!
https://www.rba.gov.au/statistics/frequency/fin-agg/2019/fin-agg-0719.html
https://www.abs.gov.au/AUSSTATS/abs@.nsf/DetailsPage/8731.0Jul%202019?OpenDocument
The RBA released their data to end of July today . Off the bat in should be noted they made a number of reporting changes, and the growth rates have been “adjusted” as well as applying seasonal adjustments (we assume based on earlier years, though this year might be unique!).
This data shows the total domestic lending commitments (allowing for new loans written, old loans repaid or refinanced – so this is net stock movements.
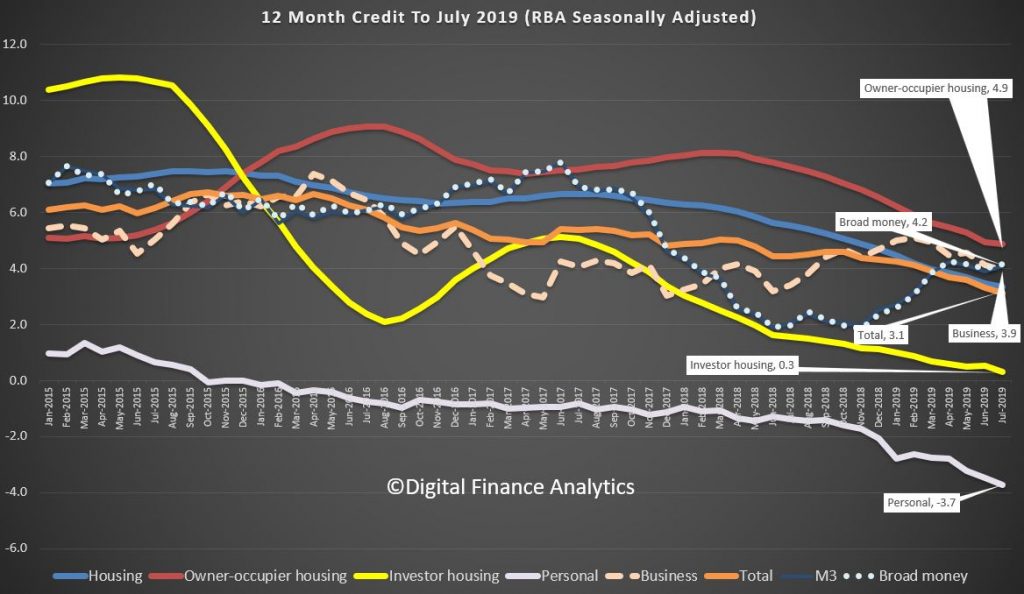
In the D1 data we see that owner occupied lending growth for the past 12 months fell again, down to 4.9%, investment housing lending was down to 0.3%, and so total housing growth fell from 3.5% to 3.3%, another record low. Business lending grew at 3.9% over the past 12 months. Personal lending fell 3.7% and total credit grew 3.1%.
So no evidence of any pick-up on these annualised numbers.
The one month numbers show a small rise in owner occupied loans from 0.2% last month, to 0.5%, a level last seen in September. Investment lending fell down 0.1%. Personal credit fell 0.4% from the previous month, and business lending up from 0.0% to 0.2%. Even with those of the bullish disposition, this is weak. And this data is always noisy, so there is really little to see which signals an improvement.
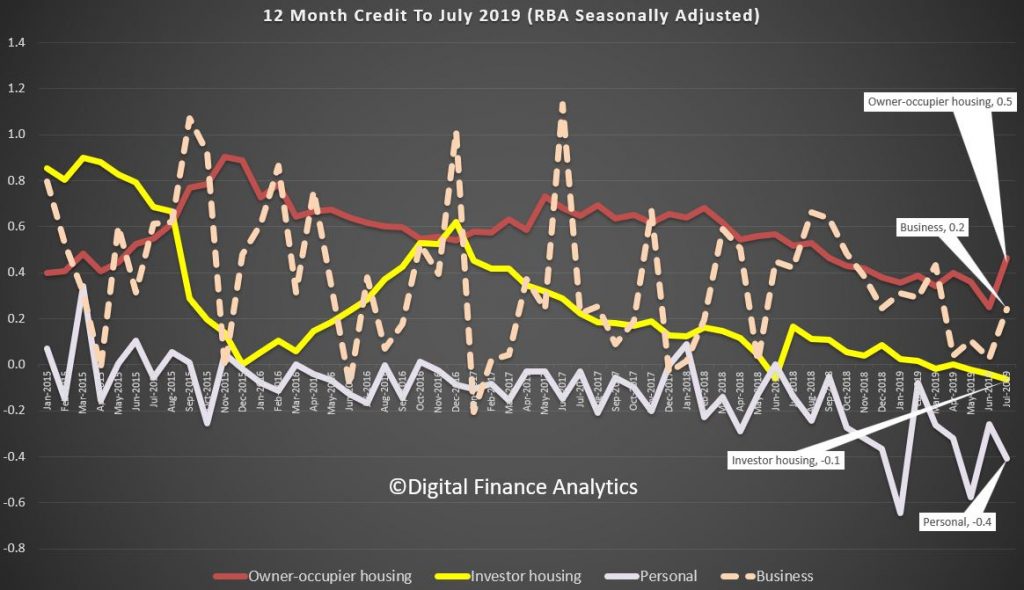
So, its true to say there is little evidence to show the stimulus from lower cash rates, or APRA’s loosening has made any substantive difference – which by the way chimes with our recent household surveys. Which begs the question, where then are the supposed home price rises coming from. Perhaps the ABS flow data in a few days will tell us more. But I remain skeptical. On any basis, property investors are sitting out still.
But we also know the RBA has done some heavy tweaking to the data. This is because the raw D2 data shows big swings between owner occupied and investment lending between June and July, thanks to their revisions. This is what they say:
From this release onward, the financial aggregates incorporate an improved conceptual framework and a new data collection. This is referred to as the Economic and Financial Statistics (EFS) collection. For more information, see Updates to Australia’s Financial Aggregates. All growth rates have been adjusted for the effects of series breaks resulting from these changes. Minor revisions to the historical growth rates of the financial aggregates reflect improvements in the RBA’s seasonal adjustment processes. Revisions to the historical growth rates of the money aggregates – specifically M3 and Broad Money – also reflect methodological improvements to their production.
The implementation of the EFS collection has led to larger-than-usual movements in the levels of the outstanding stocks of series published in the table Lending and Credit Aggregates – D2 between June and July 2019. In particular, the EFS collection seeks to resolve ambiguity about the classification of finance according to its purpose and residency. The sample of entities participating in the collection has also changed and the measurement of housing credit extended by non-authorised deposit-taking institutions has improved. Some of the key changes resulting from the EFS collection are reclassifications between: owner-occupier housing loans and investor housing loans; housing loans and other personal loans; and loans to residents and loans to non-residents (loans to non-residents are not included in the credit aggregates). In combination, these changes have led to: decreases in the levels of total credit, business credit, housing credit and owner-occupier housing credit; and increases in the levels of other personal credit and investor housing credit. In contrast to the published growth rates, the levels of the credit aggregates are not adjusted for series breaks. Growth rates should not be calculated from data on the levels of credit.
The table Monetary Aggregates – D3 has changed; for more information, please see the change notice published on 31 July 2019. The history of M1 has been revised to include all transaction deposits, whereas previously some of these deposits were only included in M3. The history of M3 and Broad Money has also been revised, reflecting minor conceptual changes. Beyond these historical revisions, movements in transaction and non-transaction deposits between June and July 2019 are larger than usual. This is because the EFS collection used to compile the monetary aggregates more accurately classifies deposits by their type. The levels of the monetary aggregates are not adjusted for series breaks. Growth rates should not be calculated from data on the levels of money.
Owing to the EFS collection, ‘Net switching of housing loan purpose – from investor to owner-occupied within the same lender’ will now be published with a one-month delay.
As usual, all growth rates for the financial aggregates are seasonally adjusted, and adjusted for the effects of breaks in the series as recorded in the notes to the tables listed below. Data for the levels of financial aggregates are not adjusted for series breaks. The RBA credit aggregates measure credit provided by financial institutions operating domestically. They do not capture cross-border or non-intermediated lending.
More data noise in the machine. We will look at the APRA bank specific data in a later post.