
Economist John Adams and Analyst Martin North discuss the latest on Deposit Bail-In and John reveals its all been done before.
Tag: RBA
Is This The RBA’s Bernanke Moment?
Just before the GFC hit, the then Chair of the Fed reassured that everything was going to be fine.
The subprime mess is grave but largely contained, said Federal Reserve Chairman Ben Bernanke Thursday, in a speech before the Federal Reserve Bank of Chicago. While rising delinquencies and foreclosures will continue to weigh heavily on the housing market this year, it will not cripple the U.S. economy, he said. The speech was the Chairmans most comprehensive on the subprime mortgage issue to date.
It of course was not. We are still reaping the QE whirlwind.
So, today, RBA Assistant Governor (Financial System) Michele Bullock spoke in Perth “Property, Debt and Financial Stability”. In Perth, of all places where prices have been falling for many years!
She concludes that “vulnerabilities from the level of household debt, the apartment development cycle and the level of non-residential commercial property valuations continue to present risks for financial stability. While so far, the financial sector has remained resilient, we continue to monitor developments in household debt and in property markets for signs that these might have more broad ranging effects on the financial system”.
As Assistant Governor (Financial System) I oversee the Bank’s work on financial stability. But what is financial stability and what is the Reserve Bank’s role in it?
The wellbeing of households and businesses in Australia depends on growth in the Australian economy. And a crucial facilitator of sustained growth is credit – flows of funds from people who are saving to people who are investing. Credit provides households and businesses with the ability to borrow on the back of future expected income to finance large outlays, for example, the purchase of a home or equipment to establish or grow a business. A strong and stable financial system is important for this flow of funds.
There is no universal definition of financial stability but one way to think about it is to consider what is meant by financial instability. My colleague Luci Ellis suggested that this is best thought of as a disruption in the financial sector so severe that it materially harms the real economy.[1] This leaves unsaid where the disruption might come from, but we would all recognise the outcomes of financial stability when we see it. For example, while Australia was spared the worst impact of the global financial crisis, internationally it demonstrated the impact that financial instability can have on growth and hence the wellbeing of households and businesses in the economy.
Most of you will know about the Reserve Bank’s role in conducting monetary policy. But another key role of the Reserve Bank that you might be less familiar with is promoting financial stability. In this area, we share responsibility with the Australian Prudential Regulation Authority (APRA). But it is APRA that has responsibility for the stability of individual financial institutions and the tools that go along with that. So how does the Bank contribute to financial stability?[2]
There are a number of things we do. We undertake analysis of the economy and the financial system through the lens of financial stability, looking for financial vulnerabilities that could result in substantial negative impacts on the economy, or economic vulnerabilities that could result in risks to financial stability. We work with other regulators to identify signs of increasing risks in the financial system and measures to address these risks. Where appropriate, we provide advice to government on the potential implications for financial stability of policies. And we talk about the risks we are seeing to help inform other regulators, participants in the financial system, businesses and the general public of the potential risks that might have an impact on the economy.
This last action – communicating the risks – is the key purpose of our six-monthly Financial Stability Review (the Review). While any individual financial institution, business or household might think the risks they are taking on are appropriate, they may not be adequately taking into account the risks that are arising at a systemic level from everyone’s actions. The Review attempts to bring this system-wide view.
Our most recent Review was published in October last year and we are currently in the process of drafting the next one, which will come out in April. So, for the remainder of my talk, I am going to cover some of the key risks that we see at the moment. Given the audience, I am going to focus on risks related to residential and commercial property. First, I will give an update on recent developments in these areas. Then I will talk a little about recent concerns around tighter lending standards. And I will finish up with a few observations on the property market in Western Australia.
Household Debt
Six months ago in the Review, we noted that global economic and financial conditions were generally positive and that the Australian economy was improving. At the same time, housing prices were declining. In this context, we highlighted a number of vulnerabilities – issues that, were a shock to occur or economic conditions take a turn for the worse, could manifest in a threat to financial stability. At that time, we highlighted two domestic vulnerabilities that are relevant to my talk today – the level of household debt, and the slowdown in housing and credit markets. Six months on, these vulnerabilities remain. If anything, they are a little more heightened.
The Bank has highlighted the issue of household debt as a potential threat to financial stability many times over the past few years. Although it does not capture all the important information about household indebtedness, the ratio of household debt to disposable income is one summary indicator. This ratio is historically high (Graph 1). The household debt-to-income ratio rose from around 70 per cent at the beginning of the 1990s to around 160 per cent at the time of the GFC. The ratio steadied for a few years before starting to rise again around 2013 (around the same time that housing price growth began to accelerate) and is now around 190 per cent.
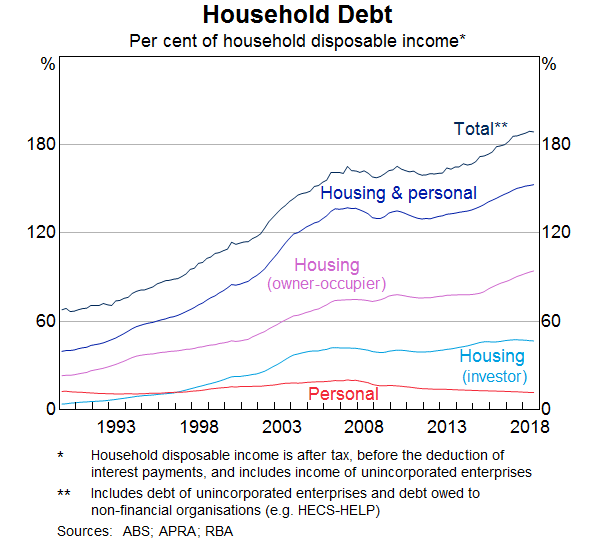
I have talked previously about some of the reasons why the debt-to-income ratio has risen so much over the past few decades.[3] In particular, a structural decline in the level of nominal interest rates and deregulation have eased credit constraints and increased loan serviceability. And as households have been able to borrow more, they have been able to pay more for housing. One important driver of high household debt in Australia is, therefore, housing. There is very little debt related to non-housing loans such as credit cards or car loans.
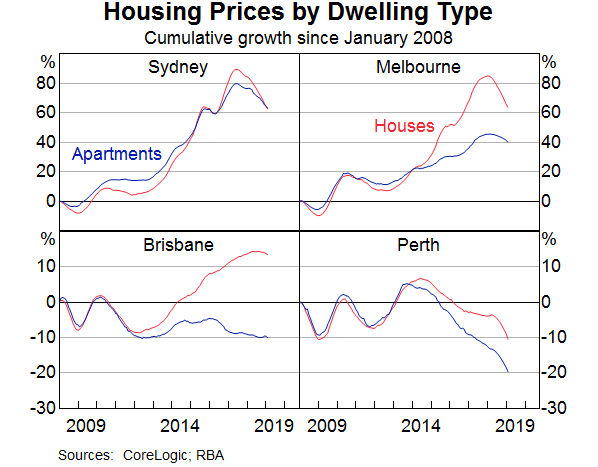
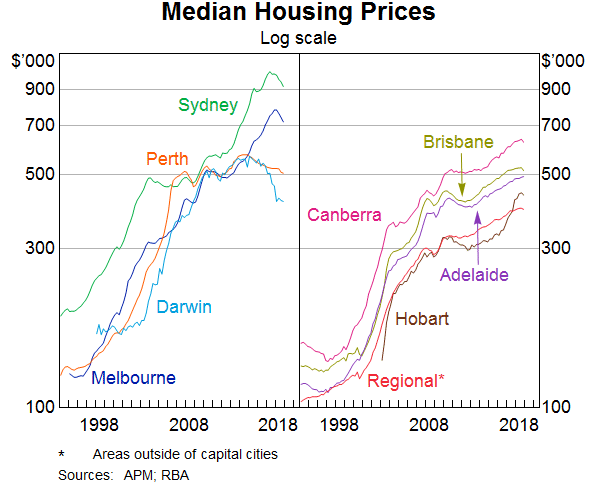
Just as housing costs have been an important driver of household debt, so has the ability to borrow more influenced the price of housing. Over the past decade, housing prices in many parts of Australia have risen but the rise has been particularly sharp in Sydney and Melbourne, which account for around 40 per cent of the housing stock (Graph 2). More recently, housing prices have fallen. Since the peak in mid 2017, housing prices Australia-wide have declined by around 7 per cent. The falls in Sydney and Melbourne have been larger. The question we are asking ourselves is, given the high levels of debt and falling housing prices, are there any significant implications for financial stability?
The answer would be no at this stage – the impacts are not large enough to result in widespread problems in the financial sector. This is not to downplay the financial stress that some households are experiencing. But most of the debt remains well secured against property, even with the decline in housing prices. Total repayments as a share of income remain steady and a large number of indebted households have built up substantial prepayments over the past few years. Broadly, the debt is held by households that can afford to service it. Arrears rates, while increasing a bit over the past few years, remain low. Banks are well capitalised and work over recent years to improve lending standards has made household and bank balance sheets more resilient. Loans at high loan-to-valuation (LVR) ratios and interest-only loans are less common than they were and most households have not been borrowing the maximum amount available.
Apartment Development
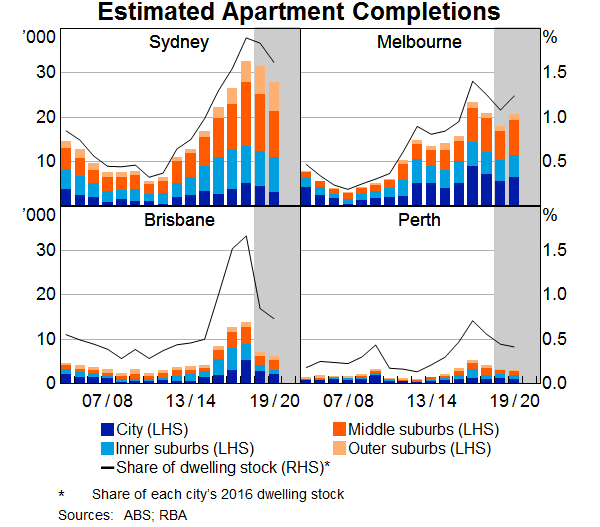
One area that we have focused on in recent years in our analysis of financial stability risks is apartment development. There has been a substantial increase in apartment construction since the start of the decade in the largest Australian capital cities (Graph 3). In Sydney there have been more than 80,000 apartments completed over the past few years adding roughly 5 per cent to housing stock in Sydney. Melbourne and Brisbane have also seen relatively large additions to the supply of apartments and, while the number of apartments being built in Perth has been small by comparison, this has been in the context of a fairly small apartment stock.
Our main concern with this from a financial stability perspective is the potential for this large influx of supply to exacerbate declines in housing prices and so adversely impact households’ and developers’ financial positions. By its nature, high-density development can tend to exacerbate price cycles. Large apartment developments have longer planning and development processes than detached housing. Purchasing the land, designing the development, getting approvals through relevant government bodies and then actual construction of the apartment block all take time. In a climate of rapidly rising prices, developers are willing to pay high prices for land on which to build apartments. Households, including investors, are willing to purchase apartments off the plan, confident that the apartment will be worth more than they paid for it when it is finally completed. This continues as long as prices are rising. This large increase in supply, however, ultimately sows the seeds of a decline in prices which, if large enough, results in development becoming unattractive, new supply falling and the cycle starting again.
This presents two risks. The first is to household balance sheets. A decline in apartment prices could negatively impact households that purchased off the plan and are yet to settle. They might find themselves in a situation where the value of the apartment in the current environment is less than they contracted to pay for it. And as market pricing falls, lenders will revise their valuations down and so will be willing to lend less. Households will therefore have to contribute more funds, either from their own savings or loans from other sources.
The second risk is to developers who are delivering completed apartments into the cooling market. If people who had pre-purchased are having difficulty getting finance, or decide it is not worth going ahead with the purchase, there would be increasing settlement failures. Developers would be left holding completed apartments, reducing their cash flow and their ability to service their loans, and impacting banks’ balance sheets.
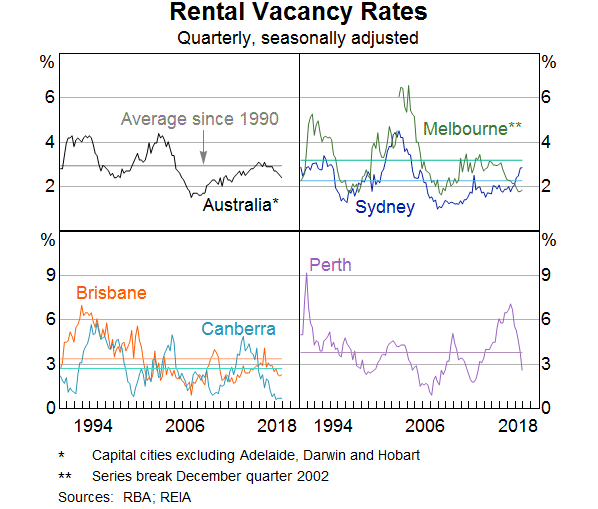
Currently, the risks here appear to be elevated but contained. The apartment market is quite soft in Sydney; apartment prices have declined since their peak, rental vacancies have risen and rents are falling (Graph 4). In Melbourne and Brisbane, however, apartment prices have so far held up. Liaison suggests that settlement failures have not increased much and, to the extent that they have, some developers are in a position where they can choose to hold and rent unsold apartments. Further tightening in lending standards might, however, impact both purchasers of new apartments and developers – I will return to this in a minute.
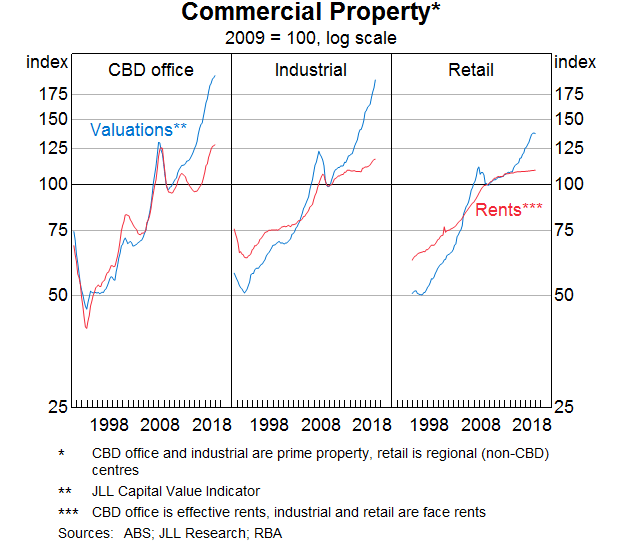
Commercial Property
A final area worth touching on is non-residential commercial property.
Commercial property valuations have, like housing, risen substantially over the past decade, and much more than rents so that yields on commercial property have fallen to very low levels historically (Graph 5). This is particularly the case for office and industrial property. One reason for this is that yields, although they have been historically low in Australia, are high relative to overseas and to returns on other assets. Furthermore, some markets, such as the Sydney and Melbourne office property markets, are experiencing strong tenant demand and vacancy rates are low. But the rapid increase in commercial property prices over the past decade does pose risks. If transaction prices and valuations were to fall sharply, for example, in response to a change in risk preferences, highly leveraged borrowers could be vulnerable to breaching their LVR covenants on bank debt. This could trigger property sales and further price falls, exacerbating the cycle.
Lending Standards
With that background, I want to turn to an issue that has attracted a fair bit of attention in recent months – the role that tightening lending standards might have played in the downturn in credit and the housing market. We published a special chapter in the October 2018 Review on this issue and the Deputy Governor discussed it in a speech in November last year so I will only cover it briefly here.[4]
Lending standards have been tightening since late 2014, well before housing prices in the eastern states started to turn down. The initial tightening occurred in December 2014 in response to very fast growth in lending to housing investors and an assessment by APRA that banks’ lending practices could be improved. APRA required banks to tighten their lending practices in a number of areas, including interest rate buffers, verification of borrower income and expenses, and high LVR lending. The measure that got the most attention at that time, however, was the ‘investor lending benchmark’ in which APRA indicated that supervisors would be paying particular attention to any institutions with annual investor credit growth exceeding 10 per cent. The idea was that it would be temporary while APRA worked with the banks on addressing lending standards.
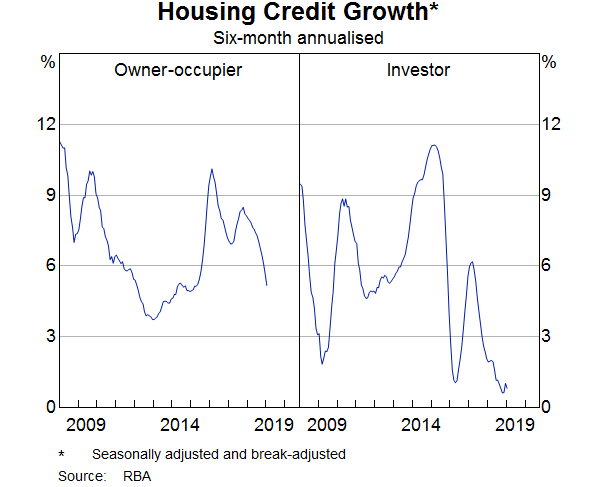
The benchmark and the tightening of standards didn’t have an immediate impact on the pace of investor lending. It didn’t really start to bite until the middle of 2015 when banks introduced higher interest rates for loans to investors. And at that point, growth in lending to investors slowed sharply (Graph 6).
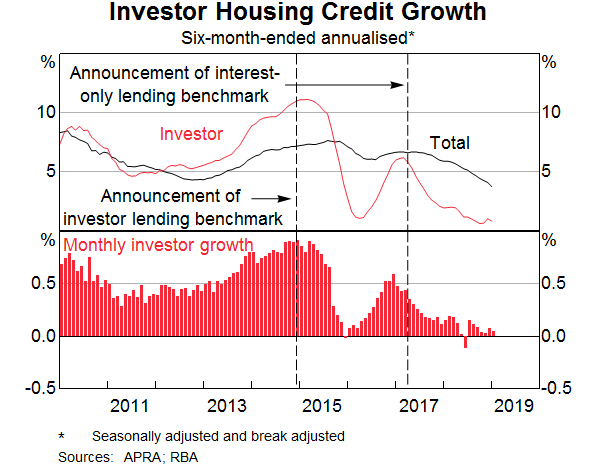
Once things settled down, however, and banks were comfortable that they were well below the benchmark, the growth in lending to investors started to pick up again. Then, in March 2017, APRA introduced restrictions on the share of new interest-only lending as part of its broader suite of measures to strengthen lending practices. As part of this, APRA reinforced its investor benchmark. While the interest-only measure was focused on reducing the volume of higher-risk lending rather than lending to a particular type of borrower, there was a noticeable impact on the growth in lending to housing investors since interest-only loans tend to be the product of choice for many investors.
Both the investor lending benchmark and the interest-only lending benchmark have been removed for banks that have provided assurances on their lending policies and practices to APRA. But the improvements in lending practices implemented by the banks over the past few years have resulted in credit conditions being tighter than they were a few years ago. Application processes have been taking a bit longer as lenders are being more diligent about verifying borrower income and expenses, borrowers are generally being offered smaller maximum loans and some borrowers are finding it more difficult to obtain a loan. Banks are more closely adhering to their lending policies, resulting in fewer exceptions being granted and there are fewer high LVR and interest-only loans being approved.
There have been some concerns expressed that these developments have been a key reason for the slowing in credit growth over the past year. Coupled with possibly some increased risk aversion of front-line lending staff in the wake of the Royal Commission into Misconduct in the Banking, Superannuation and Financial Services Industry, the concern is that this has been impacting housing credit growth and, by extension, housing prices. As concluded in the Banks’ February Statement on Monetary Policy, and noted by the Governor in a recent speech, tighter credit conditions do not appear to be the main reason for declining housing credit growth.[5] The evidence points towards declining demand for housing credit as being a more important factor.
Nevertheless, it is possible that tighter lending standards could be impacting developers of apartments. This could be direct, reflecting banks’ desire to reduce their exposure to the property market, particularly high-density development. But it could also be indirect by banks tightening their lending standards for purchases of new apartments, hence impacting pre-sales for developers and their ability to obtain finance. The Deputy Governor noted this in a speech in November 2018 and concluded that this was of potentially higher risk to the economy than household lending standards.
From a financial stability perspective, prudent lending standards are a good thing. They ensure that households and banks are resilient to changes in circumstances. But there needs to be a balance. The regulators are not proposing any further tightening in lending standards. And the appropriate amount of credit risk is not zero – banks need to continue to lend and that will inevitably involve some credit losses.
Western Australia
Finally, I want to turn my focus to developments in Western Australia. As you will have seen from some of my earlier graphs, the Western Australian circumstances are somewhat different to those of the eastern capital cities. There are two aspects I would like to focus on – household resilience and the commercial property sector.
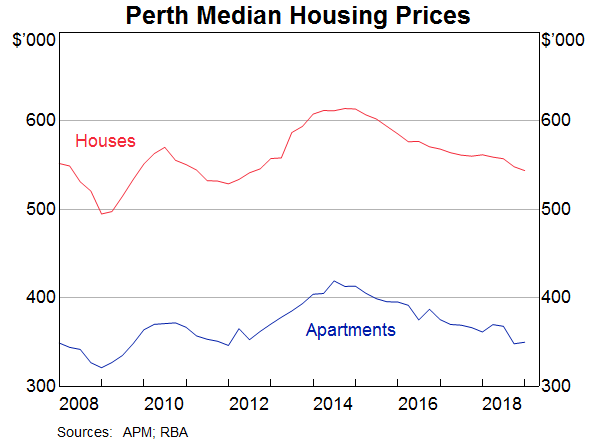
Housing prices in Perth have been declining for some years (Graph 7). The peak in housing prices in Perth was in the middle of 2014. This followed a period of strong housing price growth as the population of Western Australia increased strongly during the mining investment boom and housing construction took longer to ramp up. When housing construction did respond, however, population growth had slowed markedly and housing prices started to fall. Median housing prices have fallen by around 12 per cent since 2014.
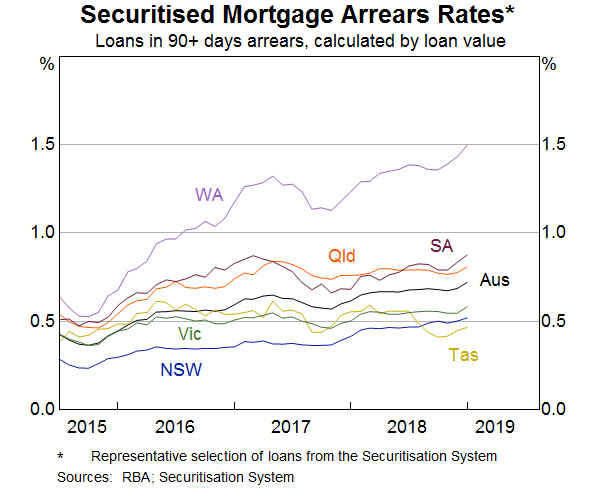
This has clearly been a difficult time for many homeowners in Western Australia. There are some households that are having difficulty meeting repayments, as evidenced by a rising arrears rate in Western Australia (Graph 8). At this stage, however, the losses are not large enough to threaten the stability of the financial sector. We nevertheless continue to monitor the situation for any potential systemic impacts.
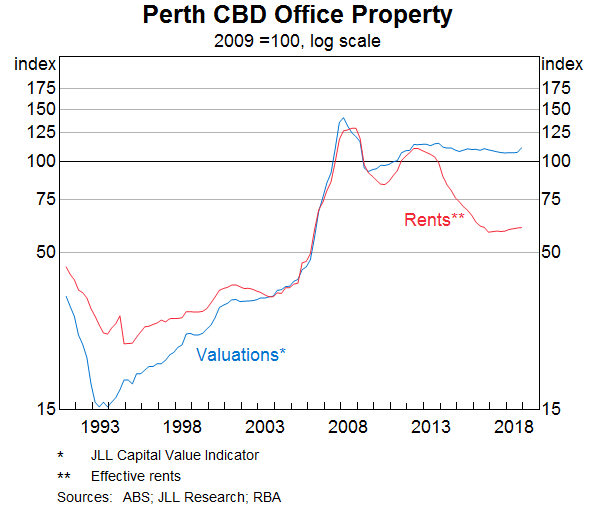
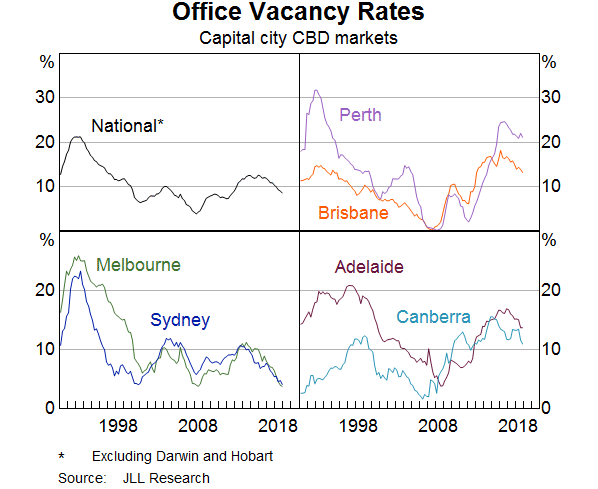
Finally, office property in Western Australia has also been experiencing oversupply. Valuations have fallen over the past decade (Graph 9). Rents have also fallen reflecting a sharp increase in office vacancy rates in Perth’s CBD over the past few years (Graph 10). This makes for a challenging environment for owners of these buildings, particularly for owners of older or lower quality office buildings as tenants have taken the opportunity to move into newer buildings as rents have come down. But again, while a difficult time for developers and owners of office buildings, the financial stability implications seem limited.
Conclusion
Vulnerabilities from the level of household debt, the apartment development cycle and the level of non-residential commercial property valuations continue to present risks for financial stability. While so far, the financial sector has remained resilient, we continue to monitor developments in household debt and in property markets for signs that these might have more broad ranging effects on the financial system.
RBA Minutes March 2019
The RBA released their minutes today relating top the March 2019 meeting. They called out the market’s view that policy rates would be lower in 2020 (a turn around), lower retail, and slowing housing momentum, despite strong employment.
In considering the stance of monetary policy, members observed that growth in the global economy had been above trend in 2018, although it had slowed over the second half of the year and timely indicators suggested that this moderation had extended into 2019. Nonetheless, output growth had remained sufficient in most advanced economies for labour markets to remain tight, putting upward pressure on wages. Members noted the tension in a number of economies between slower GDP growth and resilient labour markets. The transmission of tighter labour market conditions to inflation pressures was taking longer than might be expected, based on historical experience.
The authorities had responded to slowing growth in China by putting in place policies to increase the flow of credit to the private sector and easing fiscal policy in a targeted way to support growth, while continuing to pay close attention to risks in the financial sector. Slowing growth in China and ongoing trade tensions had led to lower growth in global trade, and continued to be a source of uncertainty for the outlook for global growth.
The tightening of global financial conditions, associated with higher risk premiums required by investors around the turn of the year, had eased. Members assessed that global financial conditions remained accommodative, with financial market pricing indicating that little change to the accommodative stance of monetary policy in the advanced economies was expected over the following year or so. The terms of trade for Australia were expected to have remained above their trough in early 2016 and the Australian dollar had remained within its narrow range of recent times.
Domestically, there continued to be tension between the ongoing improvement in labour market data and the apparent slowing in the momentum of output growth in the second half of 2018. Leading indicators of conditions in the labour market, such as vacancies and hiring intentions, pointed to further tightening in the labour market in the near term. Private sector wages growth had picked up further in the December quarter, consistent with the Bank’s forecasts and survey evidence that a significant share of firms were finding it difficult to attract suitable labour.
Although output growth had slowed in the second half of 2018, the outlook for business investment and spending on public infrastructure had remained positive. Growth in consumption was expected to be supported by an increase in growth in household disposable income. However, there continued to be considerable uncertainty around the outlook for consumption given the environment of declining housing prices in some cities, low growth in household income and high debt levels. Dwelling investment was expected to subtract from growth in output over the forecast period and, unless pre-sales volumes started to increase, this decline could be sharper than currently expected.
The process of adjustment in the housing market had continued. Housing prices in Sydney, Melbourne and Perth had declined further, and turnover in the housing market had fallen significantly. Rent inflation had remained low across most of the country despite declines in rental vacancy rates over the previous year, except in Sydney, where rental vacancy rates had been increasing. Credit conditions had tightened for some borrowers and the demand for housing credit had slowed noticeably as conditions in the housing market had changed. Mortgage rates had remained low and there was strong competition for borrowers of high credit quality.
Members noted that the sustained low level of interest rates over recent years had been supporting economic activity and had allowed for gradual progress to be made in reducing the unemployment rate and returning inflation towards the midpoint of the target. While the labour market had continued to strengthen, less progress had been made on inflation. Looking forward, the central forecast scenario was still for growth in GDP of around 3 per cent over 2019 and a further decline in the unemployment rate to 4¾ per cent over the next couple of years. This further reduction in spare capacity underpinned the forecast of a gradual pick-up in wage pressures and inflation. Given this, members agreed that developments in the labour market were particularly important.
Taking account of the available information on current economic and financial conditions and how they were expected to evolve, members assessed that the current stance of monetary policy was supporting jobs growth and a gradual lift in inflation. However, members noted that significant uncertainties around the forecasts remained, with scenarios where an increase in the cash rate would be appropriate at some point and other scenarios where a decrease in the cash rate would be appropriate. The probabilities around these scenarios were more evenly balanced than they had been over the preceding year.
Members agreed to continue to assess the outlook carefully. Given that further progress in reducing unemployment and lifting inflation was a reasonable expectation, members agreed that there was not a strong case for a near-term adjustment in monetary policy. Rather, they assessed that it would be appropriate to hold the cash rate steady while new information became available that could help resolve the current tensions in the domestic economic data. Members judged that holding the stance of monetary policy unchanged at this meeting would enable the Bank to be a source of stability and confidence, and would be consistent with sustainable growth in the economy and achieving the inflation target over time.
The Decision
The Board decided to leave the cash rate unchanged at 1.5 per cent.
RBA On Climate Change and the Economy
RBA Deputy Governor Guy Debelle, spoke at a public forum hosted by the Centre for Policy Development. Here are some edited highlights.

I will talk about how climate change affects the objectives of monetary policy and some of the challenges that arise in thinking about climate change.
Finally, I will also briefly discuss how climate change affects financial stability.
Let me start by highlighting a few of the dimensions that we need to consider:
- We need to think in terms of trend rather than cycles in the weather. Droughts have generally been regarded (at least economically) as cyclical events that recur every so often. In contrast, climate change is a trend change. The impact of a trend is ongoing, whereas a cycle is temporary.
- We need to reassess the frequency of climate events. In addition, we need to reassess our assumptions about the severity and longevity of the climatic events. For example, the insurance industry has recognised that the frequency and severity of tropical cyclones (and hurricanes in the Northern Hemisphere) has changed. This has caused the insurance sector to reprice how they insure (and re-insure) against such events.
- We need to think about how the economy is currently adapting and how it will adapt both to the trend change in climate and the transition required to contain climate change. The time-frame for both the impact of climate change and the adaptation of the economy to it is very pertinent here. The transition path to a less carbon-intensive world is clearly quite different depending on whether it is managed as a gradual process or is abrupt. The trend changes aren’t likely to be smooth. There is likely to be volatility around the trend, with the potential for damaging outcomes from spikes above the trend.
- Both the physical impact of climate change and the transition are likely to have first-order economic effects.
Climate Change, Economic Models and Monetary Policy
The economics profession has examined the effects of climate change at least since Nobel Prize winner William Nordhaus in 1977. Since then, it has become an area of considerably more active research in the profession.[4] There has been a large body of research around the appropriate design of policies to address climate change (such as the design of carbon pricing mechanisms), but not that much in terms of what it might imply for macroeconomic policies, with one notable exception being the work of Warwick McKibbin and co-authors.[5]
How does climate affect monetary policy? Monetary policy’s objectives in Australia are full employment/output and inflation. Hence the effect of climate on these variables is an appropriate way to consider the effect of climate change on the economy and the implications for monetary policy. The economy is changing all the time in response to a large number of forces. Monetary policy is always having to analyse and assess these forces and their impact on the economy. But few of these forces have the scale, persistence and systemic risk of climate change.
A longstanding way of thinking about monetary policy and economic management is in terms of demand and supply shocks.[6] A positive demand shock increases output and increases prices. The monetary policy response to a positive demand shock is straightforward: tighten policy. Climate events have been good examples of supply shocks. Indeed, droughts are often the textbook example used to illustrate a supply shock. A negative supply shock reduces output but increases prices. That is a more complicated monetary policy challenge because the two parts of the RBA’s dual mandate, output and inflation, are moving in opposite directions. Historically, the monetary policy response has been to look through the impact on prices, on the presumption that the impact is temporary. The banana price episode in 2011 after Cyclone Yasi is a good example of this. The spike in banana prices and inflation was temporary, although quite substantial. It boosted inflation by 0.7 percentage points. The Reserve Bank looked through the effect of the banana price rise on inflation. After the banana crop returned to normal, prices settled down and inflation returned to its previous rate.
The response to such a shock is relatively straightforward if the climate events are temporary and discrete: droughts are assumed to end; the destruction of the banana crop or the closure of the iron ore port because of a cyclone is temporary; things return to where they were before the climate event. That said, the output that is lost is generally lost forever. It is not made up again later, but rather output returns to its former level.
The recent IPCC report documents that climate change is a trend rather than cyclical, which makes the assessment much more complicated. What if droughts are more frequent, or cyclones happen more often? The supply shock is no longer temporary but close to permanent. That situation is more challenging to assess and respond to.
Climate Change and Financial Stability
Having talked about the macroeconomic impact of climate change and how that might affect monetary policy, I will briefly discuss climate through the lens of financial stability implications.[10] Financial stability is also a core part of the Reserve Bank’s mandate. Challenges for financial stability may arise from both physical and transition risks of climate change. For example, insurers may face large, unanticipated payouts because of climate change-related property damage and business losses. In some cases businesses and households could lose access to insurance. Companies that generate significant pollution might face reputational damage or legal liability from their activities, and changes to regulation could cause previously valuable assets to become uneconomic. All of these consequences could precipitate sharp adjustments in asset prices, which would have consequences for financial stability.
The reason that I will only cover the implications of climate change for financial stability only briefly today is that it has been very eloquently discussed by Geoff Summerhayes (APRA) and John Price (ASIC) including at this forum over the past two years.[11] I would very much endorse the points that Geoff and John have made. Geoff stresses the need for businesses, including those in the financial sector to implement the recommendations of the Task Force for Climate-related Financial Disclosures (TCFD).[12] I strongly endorse this point. We have seen progress on this front in recent years, but there is more to be done. Financial stability will be better served by an orderly transition rather than an abrupt disorderly one.
One area that Geoff highlighted in a recent speech is that there is a data gap which needs to be addressed:[13] ‘The challenge governments, regulators and financial institutions face in responding to the wide-ranging impacts of climate change is to make sound decisions in the face of uncertainty about how these risks will play out.’ In that regard, Geoff mentions one challenge that I spoke about earlier in the context of monetary policy. Namely, taking the climate modelling and mapping that into our macroeconomic models. For businesses and financial markets, that challenge is understanding the climate modelling and conducting the scenario analysis to determine the potential impact on their business and investments.
RBA Provides Housing Crash Alibi
Interesting speech from the RBA Governor today, in which he explains why home prices are falling, and says its all manageable. No mention of too loose credit and too low interest rates. Or the substantial credit tightening of recent times as the credit impulse slows!
Just remember they banked on the household sector to spend big to support the economy after the mining boom faltered, and that housing credit growth was the centre piece. This is a neat piece of misdirection in my view!
The Current State of the Housing Market
Australians watch housing markets intensely, perhaps more so than citizens of any other country. Over the five years to late 2017, they saw nationwide housing prices increase by almost 50 per cent (Graph 1). Since then, prices have fallen by 9 per cent, bringing them back to their level in mid 2016.
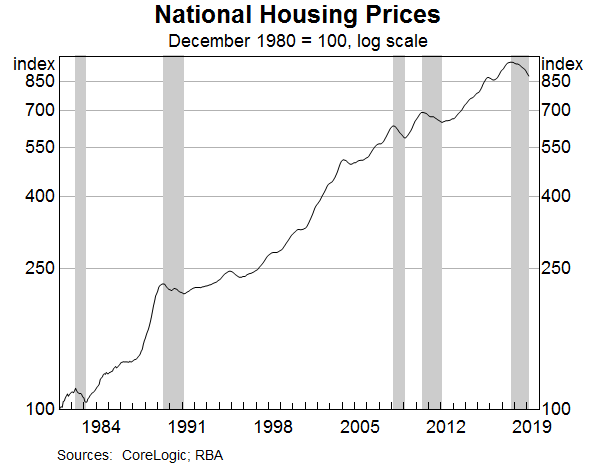
Declines of this magnitude are unusual, but they are not unprecedented. In 2008 and 2010, prices fell by a similar amount, as they did on two occasions in the 1980s. In the 1980s, the rate of CPI inflation was higher than it is now, so in inflation-adjusted terms, the declines then were larger than the current one.
These nationwide figures mask considerable variation across the country (Graph 2). The run-up in prices over recent years was most pronounced in Sydney and Melbourne, so it is not surprising that the declines over the past year have also been largest in these two cities. In Perth and Darwin, the housing markets have been weak for some time, affected by the swings in population and income associated with the mining boom. By contrast, the housing market in Hobart has been strong recently. In Adelaide, Brisbane, Canberra and many parts of regional Australia, conditions have been more stable. Given these contrasting experiences, it is pretty clear that there is no such thing as the Australian housing market. What we have is a series of separate, but interconnected, markets.
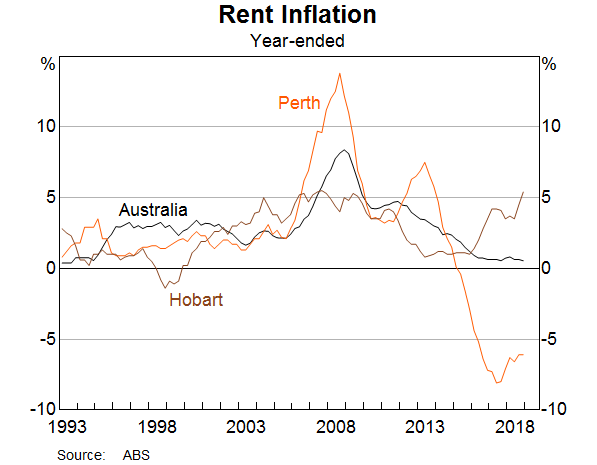
Another important window into housing markets is provided by rental markets. Over recent times, the nationwide measure of rent inflation has been running at a bit less than 1 per cent, the lowest in three decades (Graph 3). As with housing prices, there is a lot of variation across the country. Rents have been falling for four years in Perth and are now around 20 per cent below their previous peak. By contrast, in Hobart rents have been rising at the fastest rate for some years.
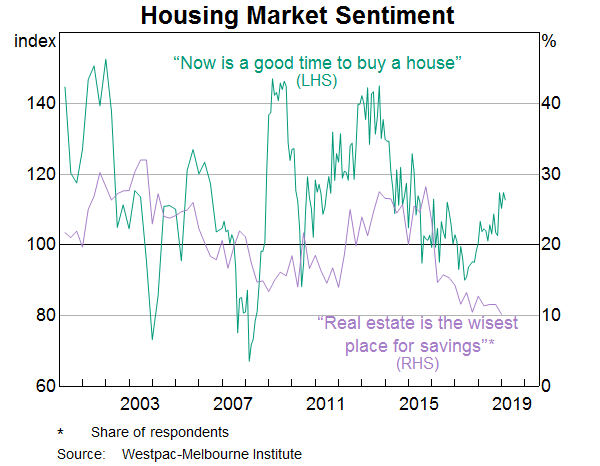
As is well understood, shifts in sentiment play an important role in housing markets. When prices are rising, people are attracted to the market in the hope of capital gains. At some point, though, valuations become so stretched that demand tails off and there is a shift in momentum. When prices are falling, it’s the reverse. The prospect of capital losses leads buyers to stay away or to delay purchasing. At some point, though, the lower prices draw more buyers into the market. First home owners find it easier to buy a home, investors are attracted back into the market, and trade-up buyers take the opportunity to upgrade to the home they have always wanted. These shifts in sentiment and momentum are seen in most housing cycles, but their precise timing is difficult to predict.
Some of these shifts in sentiment are evident in consumer surveys (Graph 4). Over recent times, the number of people reporting that an investment in real estate is the wisest place for their savings has fallen significantly. So, it is not surprising that there are fewer investors in the market. At the same time, the number of people saying it is a good time to buy a home has increased. Lower prices draw more people in and, eventually, this helps stabilise the market. So it is worth closely watching these shifts in sentiment.
Explaining the Recent Cycle
An obvious question to ask is what are the underlying, or structural, drivers of the large run-up in housing prices and the subsequent decline?
There isn’t a single answer to this question. Rather, it is a combination of factors.
Before I discuss these factors, it is worth pointing out that the current adjustment is unusual. Unlike the other four episodes in which housing prices have declined in recent decades, this one was not preceded by rising mortgage rates. Nor has it been associated with a rise in the national unemployment rate. Instead, in New South Wales, where the recent decline in housing prices has been the largest, the unemployment rate has continued to trend down. It is now at levels last seen in the early 1970s. The unemployment rate has also trended lower in Victoria.
So, the origins of the current correction in prices do not lie in interest rates and unemployment. Rather, they largely lie in the inflexibility of the supply side of the housing market in response to large shifts in population growth.
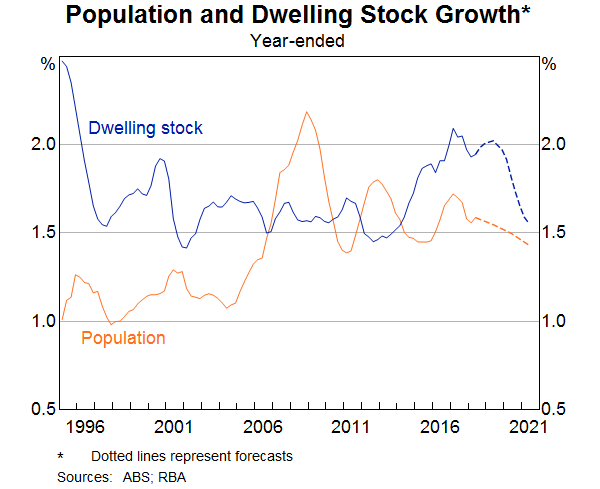
It is useful to start with the national picture (Graph 5). Australia’s population growth picked up noticeably in the mid 2000s and it took the better part of a decade for the rate of home building to respond. It took time to plan, to obtain council approvals, to arrange finance and to build the new homes. Not surprisingly, housing prices went up. Eventually, though, the supply response did take place. Over recent times, the number of dwellings in Australia has been increasing at the fastest rate in more than two decades. Again, not surprisingly, prices have responded to this extra supply.
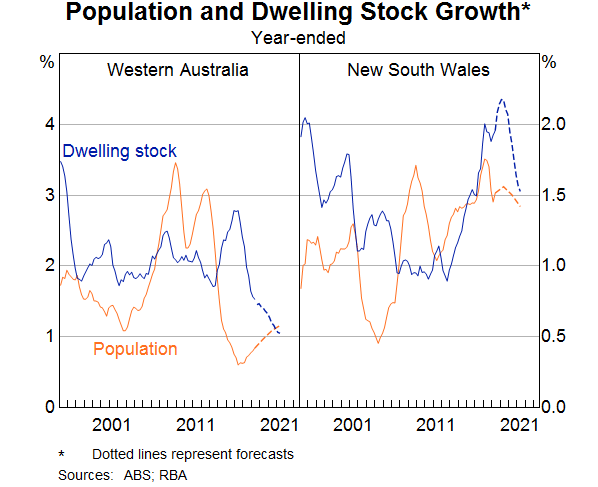
The population and supply dynamics are most evident in Western Australia and New South Wales (Graph 6).
During the mining investment boom, population growth in Western Australia increased from around 1 per cent to 3½ per cent. This was a big change. The rate of home building was slow to respond. When it did finally respond, it was just at the time that population growth was slowing significantly, as workers moved back east at the end of the boom. This explains much of the cycle.
In New South Wales it is a similar story, although it is not quite as stark. The recent rate of home building in New South Wales is the highest in decades. At the same time, population growth is moderating, partly due to people moving to other cities, attracted by their lower housing prices and rents. By contrast, in cities where population patterns and the rate of home building have been more stable, prices, too, have been more stable.
Another demand-side factor that has influenced prices is the rise and then decline in demand by non-residents.
One, albeit imperfect, way of seeing this is the number of approvals by the Foreign Investment Review Board (Graph 7). In the middle years of this decade, there was a surge in foreign investment in residential property, particularly from China. This was apparent not just in Australian cities, but also in ‘international’ cities in other countries. In Australia, the demand was particularly strong in Sydney and Melbourne, given the global profiles of these two cities and their large foreign student populations. More recently, this source of demand has waned, partly as a result of the increased difficulty of moving money out of China as the authorities manage capital flows.
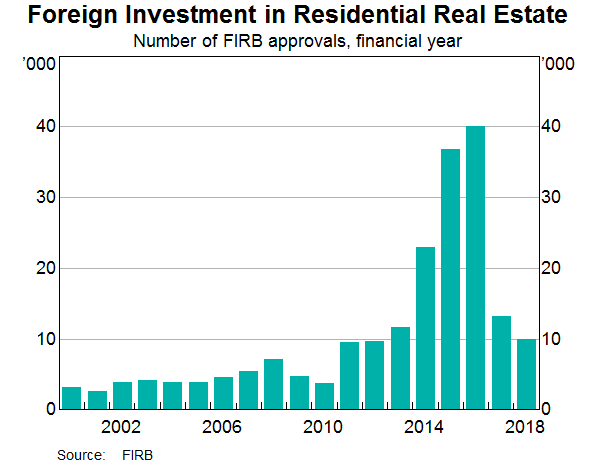
The timing of these shifts in foreign demand has broadly coincided with – and reinforced – the shifts in domestic demand. However, making a full assessment of their impact on prices is complicated by the fact that international property developers were also adding to supply in Australia at a time of very strong demand. More recently, these developers have scaled back their activity.
Domestic investors have also played a significant role in this cycle. This is especially the case in New South Wales, which was the epicentre of strong investor demand (Graph 8). At the peak of the boom, approvals to investors in New South Wales accounted for half of approvals nationwide, compared with an average of just 30 per cent over the five years to 2010. More than 40 per cent of the new dwellings built in New South Wales recently have been apartments, which tend to be more attractive to investors.
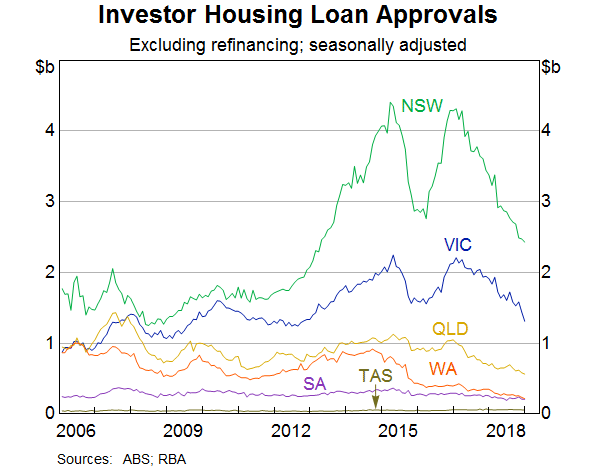
The strong demand from investors had its roots in the population dynamics. Low interest rates and favourable tax treatment added to the attraction of investing in an appreciating asset. The positive side to this was that the strong demand by investors helped underpin the extra construction activity needed to house the growing population. But the rigidities on the supply side, coupled with investors’ desire to benefit from a rising market in a low interest rate environment, amplified the price increases.
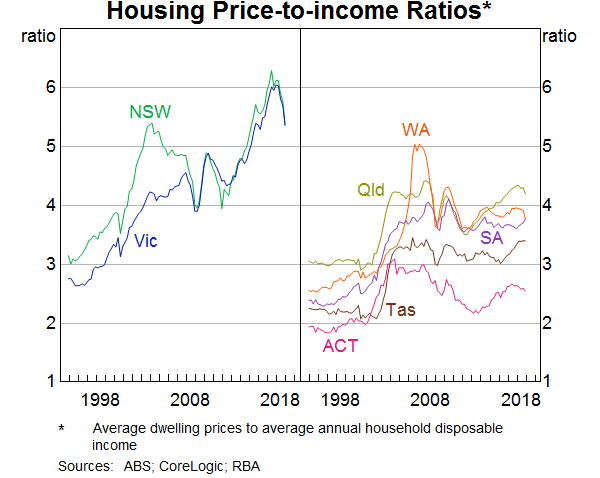
As I discussed earlier, there is an internal dynamic to housing price cycles, and this one is no exception. By 2017, the ratio of the median home price to income had reached very high levels in Sydney and Melbourne (Graph 9). Finding the deposit to purchase a home had become beyond the reach of many people, especially first home buyers if they did not have others to help them. At the same time, the combination of high prices and weak growth in rents meant that rental yields were quite low. So, naturally, momentum shifted. Given the big run-up in prices and the large increase in supply, a correction at some point was not surprising, although the precise timing is nearly impossible to predict.
No discussion of housing prices is complete without touching on interest rates and the availability of finance. The low interest rates over the past decade did increase people’s capacity to borrow and made it more attractive to borrow to buy an asset whose price was appreciating. But the increase in housing prices is not just about low interest rates. The variation across the different housing markets indicates that city-specific factors have played an important role.
Recently, much attention has also been paid to the availability of credit. This attention has coincided with a noticeable slowing in housing credit growth, especially to investors (Graph 10).
It is clear there has been a progressive tightening in lending standards over recent years. The RBA’s liaison suggests that, on average, the maximum loan size offered to new borrowers has fallen by around 20 per cent since 2015. This reflects a combination of factors, including more accurate reporting of expenses, larger discounts applied to certain types of income and more comprehensive reporting of other liabilities. Even so, only around 10 per cent of people borrow the maximum they are offered. Sensibly, most people borrow less than what they are offered, so the effect of this reduction in borrowing capacity has not been particularly large.
It has also been apparent through our liaison that some lenders became more cautious last year. There was a heightened concern by some loan officers about the consequences to them and their career prospects of making a loan that might not be repaid if the borrower’s circumstances changed. So, lenders became more risk averse. This, along with greater verification of expenses and income, led to an increase in average loan approval times, although some lenders have invested in people and technology to address this. Our liaison suggests that application approval rates are largely unchanged.
Overall, the evidence is that a tightening in credit supply has contributed to the slowdown in credit growth. The main story, though, is one of reduced demand for credit, rather than reduced supply.
When housing prices are falling, investors are less likely to enter the market and to borrow. So too are owner-occupiers for a while. Consistent with this, the number of loan applicants has declined over the past year. There is also strong competition for borrowers with low credit risk, which is not something you would expect to see if it were mainly a supply story. This competition is evident in the significant discounts on interest rates on new loans compared with those on outstanding loans.
Even though the slowing in credit growth is largely a demand story, we are watching credit availability closely. It is perhaps stating the obvious to say that we want lenders who are both prudent and who are prepared to take risk. As lenders recalibrated their risk controls last year, the balance may have moved too far in some cases. This meant that credit conditions tightened more than was probably required. Now, as lenders continue to seek the right balance, we need to remember that it is important that banks are prepared to take credit risk. And it’s important that they have the capacity to manage that risk well. If they can’t do this, then the economy will suffer.
Impact on the Macroeconomy
This brings me to the issue of how developments in the housing market affect the broader economy.
Movements in housing prices affect the economy through multiple channels. They influence consumer spending, including through the spending that occurs when people move homes. They also influence the amount of building activity that takes place. Changes in housing prices also have an impact on access to finance by small business by affecting the value of collateral for loans. And finally, they can affect the profitability of our financial institutions.
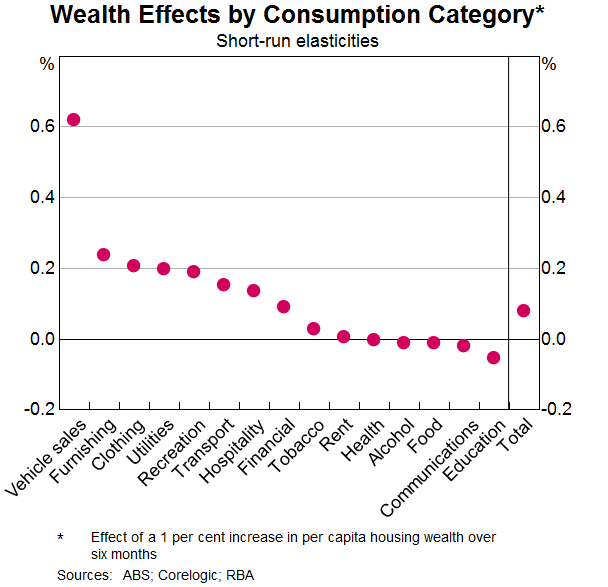
Today, I would like to focus on the effect of housing prices on household consumption. My colleagues at the RBA have examined how changes in measured housing wealth affect household spending.[1] They estimate that a 10 per cent increase in net housing wealth raises the level of consumption by around ¾ per cent in the short run and by 1½ per cent in the longer run. They have also examined how this wealth effect differs by type of spending. They find that it is highest for spending on motor vehicles and household furnishings and that for many other types of spending the effect is not significantly different from zero (Graph 11). Part of the effect on spending on furnishings is likely to come from the fact that periods of rising housing prices are often associated with higher housing turnover, and turnover generates extra spending.
Over recent years, spending by households has risen at a faster rate than household income; in other words, the saving rate has declined (Graph 12). The results that I just spoke about suggest that rising housing wealth played a role here. If so, falling housing prices, and a decline in measured household wealth, could have the opposite effect.
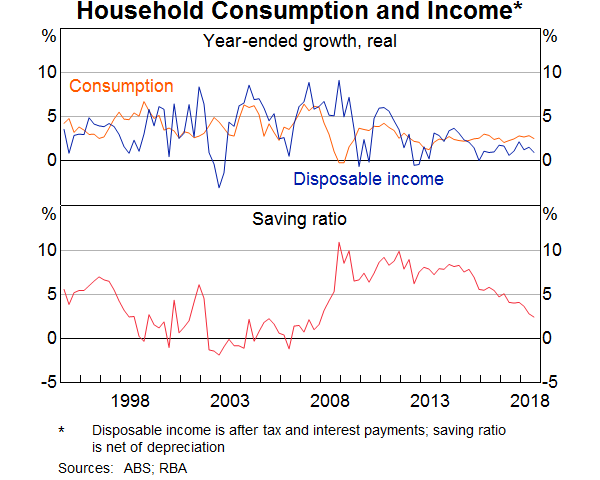
The more important influence, though, is what is happening with household income. For many people, the main source of their wealth is their human capital; that is, their future earning capacity. As I have discussed on previous occasions, growth in household income has been quite weak for a while. It is plausible that, for a time, this didn’t affect people’s expectations of their future income growth; that is the value of their human capital. So they didn’t change their spending plans much, despite their current income growth being weak, and the saving rate fell. However, as the period of weak income growth has persisted, it has become harder to ignore it. Expectations of future income growth have been revised down and it is likely that this is affecting spending.
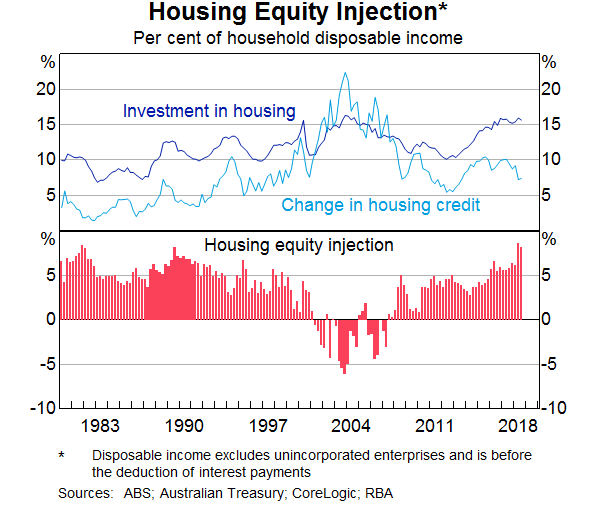
My conclusion here is that wealth effects are influencing consumption decisions, but they are working mainly through expectations of future income growth. Swings in housing prices and turnover in the housing market are also having an effect, but they are not the main issue. This assessment is consistent with the data on housing equity injection (Graph 13). Over recent years, households have been injecting substantial equity into housing and have not been using the higher housing prices to borrow to support their other spending. This is in contrast to the period around the turn of the century, when households were withdrawing equity.
Given this assessment, developments in the labour market are particularly important. A further tightening of the labour market is expected to see a gradual increase in wages growth and faster income growth. This should provide a counterweight to the effect on spending of lower housing prices.
Taking these various considerations into account, the adjustment in our housing market is manageable for the overall economy. It is unlikely to derail our economic expansion. It will also have some positive side-effects by making housing more affordable for many people.
A related issue that the RBA has paid close attention to is the impact of lower housing prices on financial stability.
In 2017, APRA assessed the ability of Australian banks to withstand a severe stress scenario, in which housing prices declined by 35 per cent over three years, GDP declined by 4 per cent and the unemployment rate increased to more than 10 per cent.[2] The estimated impact on bank profitability was substantial, but importantly, bank capital remained above regulatory minimum levels. This provides reassurance that the adjustment in our housing market is not a financial stability issue. We have not experienced the very loose lending practices that were common in the United States before the housing crash there a decade ago. Nor have we seen significant overbuilding around the country.
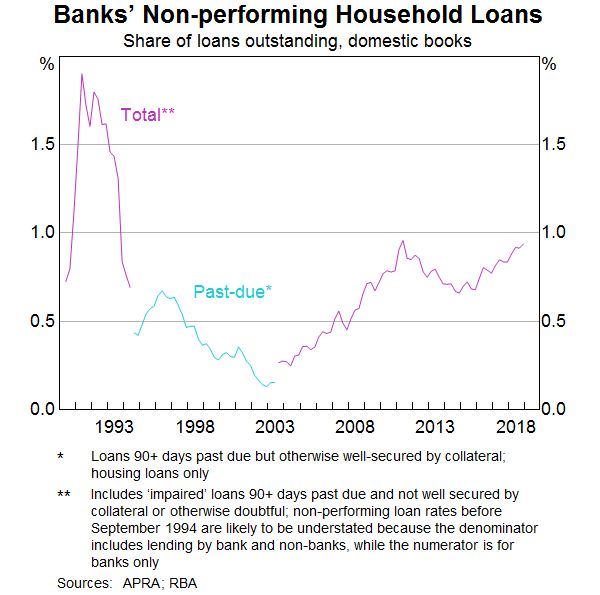
Non-performing housing loans in Australia have risen recently, but they remain low at less than 1 per cent (Graph 14). The increase is most evident in Western Australia, where the unemployment rate has risen.
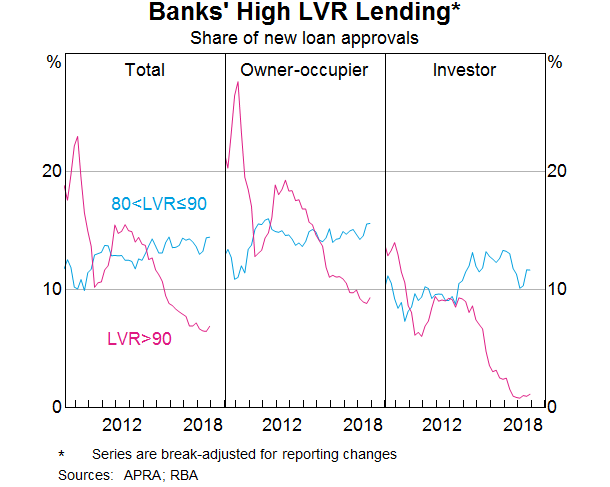
The national experience has been that low levels of unemployment and low interest rates allow most people to service their loans, even if weak income growth means that household finances are sometimes strained. Our estimate is that currently, less than 5 per cent of indebted owner-occupier households have negative equity, and the vast bulk of these households continue to meet their mortgage obligations. One factor that has helped here is that the share of new loans with high loan-to-valuation ratios (LVRs) has declined substantially (Graph 15). The nature of Australian mortgages – in which there is an incentive to make prepayments – has also helped.
Monetary Policy
I would like to conclude with some words about monetary policy and highlight some of the issues we focused on at yesterday’s Reserve Bank Board meeting.
As you are aware, the current setting of monetary policy has been in place for some time. A cash rate of 1.5 per cent is very low historically and it is clearly stimulatory. It is supporting the creation of jobs and progress towards achieving the inflation target.
Looking forward, a key issue is the labour market. Achieving full employment is an important objective in its own right. But, in addition, a strong labour market is the central ingredient in the expected pick-up in inflation. We are expecting that as the labour market tightens, wages growth will increase further. In turn, this should boost household income and spending and provide a counterweight to the fall in housing prices. The pick-up in spending is, in turn, expected to put upward pressure on inflation. Of course, it is possible that inflation could move higher for other reasons, although the likelihood of this at the moment seems low. This means that a lot depends upon the labour market.
The recent data on this front have been encouraging. Employment growth has been strong, the vacancy rate is very high and firms’ hiring intentions remain positive. The latest reading of the wage price index also confirmed a welcome, but gradual, pick-up in wage growth, especially in the private sector.
Other indicators of the economy, though, paint a softer picture. We will receive another reading on GDP growth later this morning, but growth in the second half of 2018 was clearly less than in the first half. This is similar to the picture internationally. In a number of countries, including our own, there is growing tension between strong labour market data and softer GDP data. We are devoting significant resources to understanding this tension.
RBA No Change To Cash Rate — Again!
At its meeting today, the Board decided to leave the cash rate unchanged at 1.50 per cent.

The global economy grew above trend in 2018, although it slowed in the second half of the year. The slower pace of growth has continued into 2019. The outlook for the global economy remains reasonable, although downside risks have increased. The trade tensions remain a source of uncertainty. In China, the authorities have taken further steps to ease financing conditions, partly in response to slower growth in the economy. Globally, headline inflation rates have moved lower following the earlier decline in oil prices, although core inflation has picked up in a number of economies. In most advanced economies, unemployment rates are low and wages growth has picked up.
Overall, global financial conditions remain accommodative. They have eased recently after tightening around the turn of year. Long-term bond yields have declined, consistent with the subdued outlook for inflation and lower expectations for future policy rates in a number of advanced economies. Also, equity markets have risen, supported by growth in corporate earnings. In Australia, short-term bank funding costs have moderated, although they remain a little higher than a few years ago. The Australian dollar has remained within the narrow range of recent times. While the terms of trade have increased over the past couple of years, they are expected to decline over time.
The Australian labour market remains strong. There has been a significant increase in employment and the unemployment rate is at 5 per cent. A further decline in the unemployment rate to 4¾ per cent is expected over the next couple of years. The vacancy rate is high and there are reports of skills shortages in some areas. The stronger labour market has led to some pick-up in wages growth, which is a welcome development. The improvement in the labour market should see some further lift in wages growth over time, although this is still expected to be a gradual process.
Other indicators suggest growth in the Australian economy slowed over the second half of 2018. The central scenario is still for the Australian economy to grow by around 3 per cent this year. The growth outlook is being supported by rising business investment, higher levels of spending on public infrastructure and increased employment. The main domestic uncertainty continues to be the strength of household consumption in the context of weak growth in household income and falling housing prices in some cities. A pick-up in growth in household income is nonetheless expected to support household spending over the next year.
The adjustment in the Sydney and Melbourne housing markets is continuing, after the earlier large run-up in prices. Conditions remain soft in both markets and rent inflation remains low. Credit conditions for some borrowers have tightened a little further over the past year or so. At the same time, the demand for credit by investors in the housing market has slowed noticeably as the dynamics of the housing market have changed. Growth in credit extended to owner-occupiers has eased further. Mortgage rates remain low and there is strong competition for borrowers of high credit quality.
Inflation remains low and stable. Underlying inflation is expected to pick up over the next couple of years, with the pick-up likely to be gradual and to take a little longer than earlier expected. The central scenario is for underlying inflation to be 2 per cent this year and 2¼ per cent in 2020. Headline inflation is expected to decline in the near term because of lower petrol prices.
The low level of interest rates is continuing to support the Australian economy. Further progress in reducing unemployment and having inflation return to target is expected, although this progress is likely to be gradual. Taking account of the available information, the Board judged that holding the stance of monetary policy unchanged at this meeting would be consistent with sustainable growth in the economy and achieving the inflation target over time.
Preview: The RBA’s Crumbling Claims About Australia’s Gold
John Adams and Martin North discuss the latest evidence relating to Australia’s Gold, following recent RBA testimony.
The full episode in available on “In The Interests Of The People”.
What evidence is there to confirm the Gold exists and why is it still in London with the Bank of England? Who should we believe?
Non Banks Get A Legup
We look at the latest credit stats from the RBA and APRA. The credit impulse is slowing. Its at the slowest rate since 1974. So what does that really mean?
Non Bank Home Lending Rising
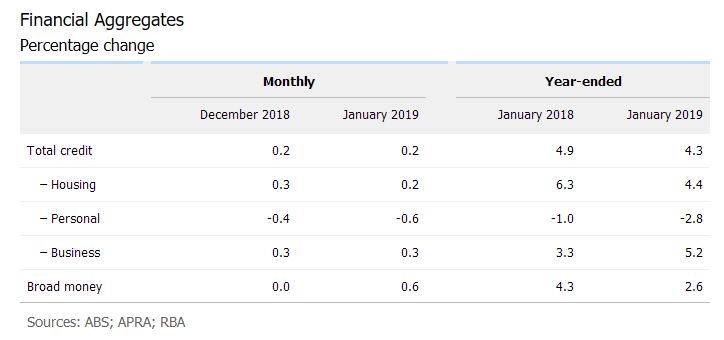
The RBA released their credit aggregates to end January 2019 today, and the data confirms that lending growth continues to slow across home lending and personal credit.
We will get to the detail shortly, but I want first to head to a comparison between the APRA data for the banks, also released today, and the total credit from the RBA.
The gap between the two relates to the non-bank sector, and the fact is, despite all the funnies in the numbers, lending from the non-bank credit sector is booming. Owner occupied non-bank lending is growing at an annualised rate of 17.2% and lending for investment housing is 4%. Both well above the bank sector. This is unsurprising, given the different funding arrangements, and restrictions between the banks and non-banks. Of course both have responsible lending obligations, but evidence suggests non-banks are more willing to lend, at a price. APRA sort of has responsibility for the non-bank sector, but do not seem to be doing much to stem the tide.
Meantime, the RBA lending aggregates shows that annual owner home lending now stands at 6.2%, investment lending at 1% and overall credit growth is 4.4%. There was a considerable drop off in personal credit, and a rise in business lending.
The monthly trends are more noisy, as expected.
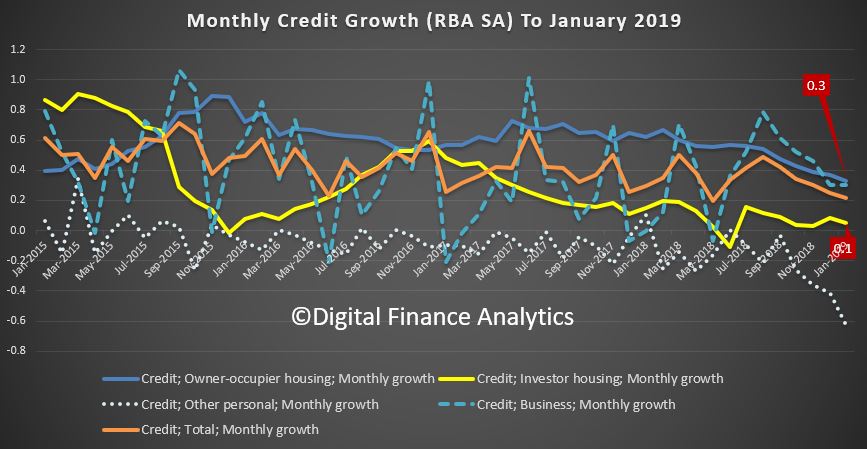
Turning to the credit stock, and using the seasonally adjusted figures, we see that overall credit still advanced. Total loans for owner occupation rose by $4 billion dollars to $1.22 trillion dollars, up 0.33% while loans for investors rose $0.3 billion seasonally adjusted to $594.6 billion dollars, up just 0.04%. Investment loans were 32.8% of the total, down slightly from last month.
Business credit rose by $3.1 billion to $956 billion, up 0.33% and comprised 32.8% of all lending, up a little from last month.
Personal credit fell by $0.9 billion dollars to $147.5 billion, down 1.15%,
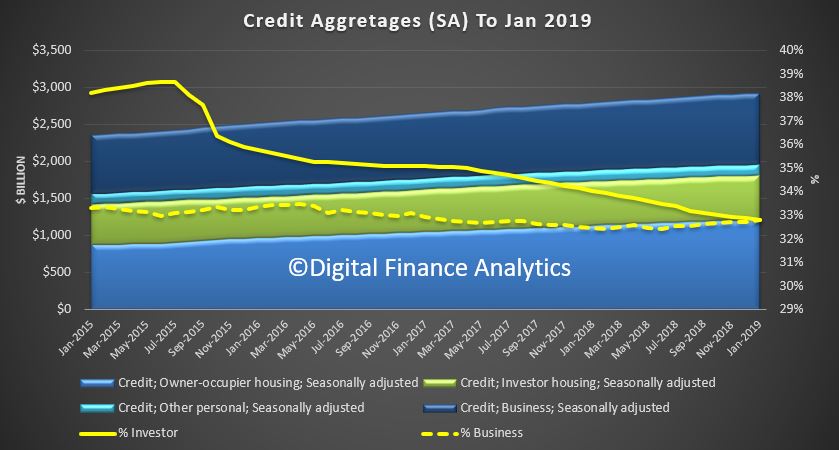
Its also worth noting the seasonally adjusted figures overstates the investment lending by a net $0.6 billion dollars.
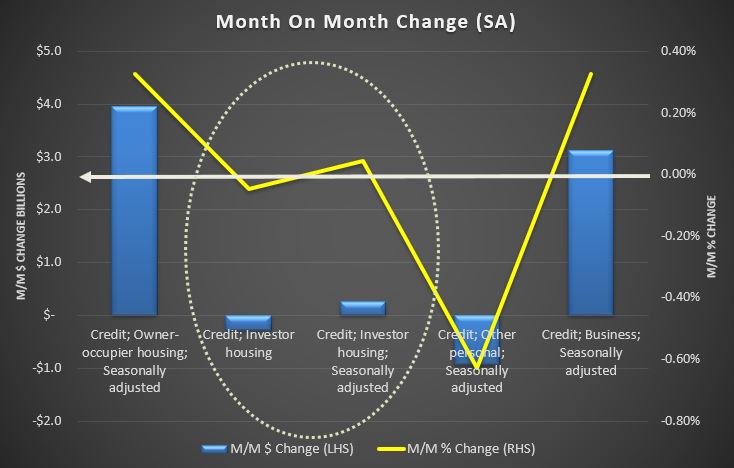
To me the slowing credit impulse is clear, as is the worrying rise in non-bank lending. Adopt the brace position!
RBA Minutes, Long But Little Sense
The RBA released their minutes today, probably the longest ever! But I am not sure they see the obvious. Slowing consumption, lower growth = slowing economy. Wages growth later won’t save the day!

International Economic Conditions
Members commenced their discussion of the global economy by noting that growth in Australia’s major trading partners had been above trend, despite moderating in the second half of 2018. Growth in major trading partners was forecast to be around trend in 2019 and 2020. However, the downside risks to the global outlook had increased in the preceding few months. Members noted that it was difficult to predict the effectiveness of recent policy measures in China and how the authorities would balance their objectives of supporting growth and containing financial risks. Trade tensions and signs of slowing domestic demand had also increased the risks to the outlook for China. More broadly, trade tensions remained a material risk to the global growth outlook.
US exports to China and Chinese exports to the United States had fallen sharply in late 2018 as a result of earlier tariff increases. There had been ongoing speculation that the United States might impose tariffs on automotive imports, which would affect imports from Germany and Japan. Some economies, particularly in the east Asian region, had been affected by the trade tensions because they provide inputs to Chinese exports as part of global supply chains. A number of economies had also faced a moderation in export growth because Chinese domestic demand had slowed. However, members noted that there had also been reports of firms accelerating existing plans to shift production from China to other low-cost producers in the east Asian region.
Labour markets had tightened further in most advanced economies and wages growth had increased. Core inflation had picked up to be close to target in some advanced economies, but remained low in others. Headline inflation had declined towards the end of 2018 because oil prices had fallen by almost 30 per cent from their peak in October.
GDP growth in the United States had remained strong over 2018. Fiscal stimulus and strong employment growth had supported consumption growth. The labour market had continued to tighten in early 2019 and wages growth had picked up. However, the outlook for investment had softened. Some measures of business and consumer confidence had fallen sharply in January. However, members noted that it was difficult to determine whether this reflected uncertainty associated with volatility in financial markets or a genuine deterioration in the circumstances facing businesses and consumers.
GDP growth in Japan was expected to recover after the sharp slowing in the September quarter, which had mainly reflected disruptions from natural disasters. Growth in consumption had been supported by a strong labour market and a pick-up in wages growth. Members noted that consumption would receive a short-term boost as consumers brought forward spending ahead of an increase in the consumption tax in October. Recent data suggested that business conditions in Japan had also remained positive. By contrast, growth in output in the euro area had slowed over 2018, reflecting a combination of weaker external demand, especially from China, and some localised factors that could have persistent effects, particularly if they were not resolved quickly. Investment intentions and surveyed business conditions had fallen recently in the euro area.
GDP growth in China had slowed in 2018, as had been expected given the earlier tightening in financial conditions. However, there were signs that underlying momentum in the Chinese economy had slowed by more than suggested by the GDP data. The authorities had responded with further targeted policy measures. Many of these measures were aimed at encouraging spending on infrastructure, which had led to a lift in growth in public infrastructure investment and an upgrade to the outlook for steel demand. In India, crude steel production had remained high in 2018, despite an easing in GDP growth overall.
The improved outlook for steel demand and stockpiling ahead of the Chinese New Year had supported prices for iron ore at the end of 2018, and earlier increases in oil prices had boosted liquefied natural gas (LNG) prices. As a result, Australia’s terms of trade were expected to have increased in the December quarter. Iron ore prices had increased further in 2019, following the collapse of a tailings dam at an iron ore mine in Brazil and the subsequent closure of a number of other similar mines. Members observed that iron ore prices could remain high for some time, but prices were still expected to decline over the medium term. Looking ahead, the effect of higher iron ore prices on the terms of trade was expected to be offset by the effect of lower prices for LNG, as the decline in oil prices since October gradually feeds through.
Domestic Economic Conditions
The September quarter national accounts had been released the day after the December meeting. Members noted that growth in real GDP of 0.3 per cent in the quarter and 2.8 per cent over the year had been noticeably below expectations. There had also been downward revisions to GDP growth in previous quarters, which had subtracted around ¼ percentage point from the year-ended growth rate. Taking account of this and other information, the Bank had revised down its forecast for growth in the Australian economy by around ¼ percentage point for both 2019 and 2020. This primarily reflected a modest downgrading of the outlook for household consumption and residential construction. The outlook had also become more uncertain over the preceding few months.
Growth in GDP was expected to be around 3 per cent over 2019, supported by accommodative monetary policy and ongoing strength in public spending and business investment. Further gradual tightening in the labour market was expected to support growth in household income and consequently growth in household consumption. GDP growth was expected to moderate to 2¾ per cent over 2020 because LNG output was expected to reach targeted levels of production and would therefore no longer materially add to growth. Dwelling investment was also expected to decline more sharply than previously expected, consistent with the decline in residential building approvals and the fall in housing prices.
Growth in consumption had slowed to 2½ per cent over the year to the September quarter. Revisions to previously published data made it difficult to assess the underlying momentum of consumption over the preceding year. On balance, the slower reported growth in consumption, together with subdued growth in retail sales in the December quarter and the likely effect of lower housing prices and reduced housing market activity on consumption, warranted a downward revision to the outlook for consumption. As a result, year-ended growth in consumption was expected to pick up only a little over the forecast period. Members noted that uncertainty about the recent momentum of consumption and factors affecting households’ future consumption decisions remained a key risk for the domestic economic outlook.
Dwelling investment was likely to have been close to its peak in the second half of 2018. Although there was still a large pipeline of residential work to be done and few signs that projects already under way were being cancelled, it had become more difficult for new apartment projects to obtain finance, and building approvals were the lowest they had been for five years. As a result, dwelling investment was expected to remain at a high level in the near term, but then to decline faster than previously expected. Members noted the uncertainty about the extent and speed of the downturn in the dwelling investment cycle.
Non-mining investment had been flat in the September quarter. Non-residential construction had declined, but the pipeline of work yet to be done had remained relatively high, suggesting that non-residential construction would recover in coming quarters. Investment in machinery & equipment and computer software had grown solidly in the September quarter. A reasonably positive outlook for investment was supported by continued growth in corporate profits and accommodative financial conditions for larger firms, although conditions for smaller firms had been more constrained. While information from liaison implied that the economy had reasonable momentum around the turn of the year, surveyed business conditions had declined to around their long-run average. A large pipeline of projects was expected to support growth in public investment over the following year.
Mining investment had fallen in the September quarter. Liaison had suggested that very little additional spending was needed to bring the remaining LNG projects on line. Mining investment was expected to increase over the forecast period as mining firms invest to maintain production; this outlook was supported by mining firms’ profitability having remained strong. Members noted that the declines in mining investment that had weighed on growth for the previous six years were close to an end, and instead mining investment was expected to make a small contribution to output growth in the forecast period. Recent trade data suggested that supply disruptions had continued to affect resource exports in the December quarter.
Farm output had fallen by 8 per cent over the year to the September quarter, subtracting around ¼ percentage point from year-ended GDP growth. Members noted that the outlook for the farm sector continued to depend on the timing and magnitude of rainfall; drier-than-average conditions in key farming areas were expected to continue in the near term. Recent trade data suggested that rural exports had fallen in the December quarter, and the Australian Bureau of Agricultural and Resource Economics and Sciences had revised down its forecast for farm production in 2018/19.
Members noted the continued improvement in conditions in the labour market and that the labour market data had been stronger than other data on economic activity. Employment had continued to grow faster than the working-age population in the December quarter, with most of this growth in full-time employment. Forward-looking indicators had been consistent with above-average employment growth over the first half of 2019. The unemployment rate had declined to 5 per cent, which was the lowest rate since 2011 and lower than had been expected a year earlier. Labour market conditions had been particularly strong in New South Wales and Victoria, where unemployment rates had fallen to be between 4 and 4½ per cent. The national unemployment rate was expected to edge a little lower to around 4¾ per cent over the following few years. Tightening labour market conditions were expected to put upward pressure on wages, although to date wages growth in Australia and elsewhere had been slower to pick up than in previous expansions.
Turning to the latest data on inflation, members noted that inflation had remained low in the December quarter, with both headline and underlying inflation a little under ½ per cent in the quarter and around 1¾ per cent over the year. Headline inflation had been lower than forecast, largely because fuel prices had been lower than expected in the quarter. Domestic cost pressures had been relatively subdued, partly because wages growth had remained low. More recently, utilities prices had increased only modestly, after substantial increases in previous years, and inflation in the prices of other administered services had declined noticeably as a result of government pricing decisions.
Strong competition in the retail sector had continued to dampen inflation, although deflationary pressures in the retail sector appeared to have eased somewhat in the December quarter. This could have reflected some pass-through of the modest depreciation of the Australian dollar over 2018. The drought had also contributed to higher retail inflation for food, particularly meat.
Inflation in rents had remained subdued and data on newly advertised rents suggested there was little prospect of a pick-up in the near term. Rent inflation had started to trend lower in Sydney, where the rental vacancy rate had risen and was expected to rise further in the near term as more supply becomes available. Rents in Perth had fallen further, although the pace of deflation had eased. Inflation in the cost of new housing construction had trended lower, despite the high level of dwelling investment.
Members noted that the inflation outcome for the December quarter had been fairly close to expectations. However, the forecast pick-up in underlying inflation was now expected to occur a little later than previously expected, mainly as a result of the lower forecast for growth in GDP and downside risks to utilities and administered price inflation in the near term. Underlying inflation was expected to increase to 2 per cent by the end of 2019 (previously by mid 2019) and to reach 2¼ per cent by the end of 2020. Headline inflation was expected to fall to 1¼ per cent in mid 2019 as a result of the fall in fuel prices since the December quarter, on the assumption the lower oil price is sustained.
Members spent some time considering a paper on the implications of recent developments in housing markets for the economic outlook. After rising by almost 50 per cent over the five years to September 2017, national housing prices had fallen by around 8 per cent to be back around mid-2016 levels. Members noted the significantly different developments in housing prices across the country. Housing prices had fallen by 12 per cent in Sydney and by 9 per cent in Melbourne from their peaks in 2017. There had also been significant falls in housing prices in Perth and Darwin over recent years. By contrast, housing prices in Hobart and Canberra had increased over 2018, while housing prices in Adelaide, Brisbane and many regional centres had been flat. Members noted that the cumulative falls in housing prices in Sydney and Melbourne were relatively large by historical standards, and that it was unusual for housing prices to fall significantly in an environment of low mortgage interest rates and a declining unemployment rate.
Members noted that some of the dynamics in housing prices could be explained by the fact that the supply of housing does not respond quickly to changes in demand. In particular, the run-up in housing prices had occurred during a period when housing supply had not picked up sufficiently to match higher demand from more rapid population growth. Over time, higher housing prices had eventually led to a sizeable increase in supply, but this had taken longer than in previous cycles. Another factor weighing on prices was a noticeable decline in demand from foreign buyers in recent years, which had also been apparent in housing markets in some other economies.
Rental vacancy rates are one key indicator of the balance of supply and demand in the housing market. In most states, rental vacancies had been around or somewhat below average at the end of 2018, suggesting supply and demand for housing had been roughly balanced. In Melbourne, despite the fall in prices and large increase in supply, the vacancy rate had declined. By contrast, rental vacancies in Sydney had been increasing and advertised rents had fallen.
Members also noted that housing credit growth had declined further in preceding months and that there had been a notable drop in loan approvals by the major banks. Growth in lending to investors had slowed sharply since mid 2017 to be close to zero, while growth in lending to owner-occupiers had moderated to around 5½ per cent in six-month-ended annualised terms.
The slower growth in lending for housing over the preceding year appeared to reflect weaker demand. Nevertheless, credit conditions for some borrowers had remained tighter than they had been for some time following the strengthening of lending policies and practices over recent years. Liaison with mortgage brokers suggested that the increased public scrutiny associated with the Royal Commission into Misconduct in the Banking, Superannuation and Financial Services Industry may have led some individual loan assessors at banks to apply stricter criteria than specified in official lending requirements. However, banks reported that while loan assessors had been referring more approvals to credit officers, final loan approval rates had remained high. Moreover, lenders had continued to compete for borrowers of high credit quality by offering new loans at lower interest rates than those offered on existing loans.
From a longer-run perspective, members assessed that, following such large increases in housing prices, the effect of the recent price falls on overall economic activity was expected to be relatively small. However, members observed that if prices were to fall much further, consumption could be weaker than forecast, which would result in lower GDP growth, higher unemployment and lower inflation than forecast. From a financial stability perspective, tighter lending standards, an improving labour market and low interest rates were all likely to support households’ capacity to service their debt. Few households were in negative equity positions despite the falls in housing prices, implying that banks’ losses would be limited even if household financial stress were to become more widespread.
Financial Markets
Turning to other financial market developments, members observed that while housing credit growth had declined, business credit growth had strengthened over 2018, with contributions from the foreign banks and the major banks. However, this growth had been driven by increased lending to large businesses.
Members observed that conditions had tightened somewhat in a number of Australian financial markets, in line with global developments. Spreads of bank bond yields to Australian government bonds had widened a little, reflecting a global rise in risk premiums. Nevertheless, yields on bank bonds were little changed around the level of the preceding few years, given the decline in Australian government bond yields. Australian equity prices had declined in the December quarter along with global equity markets, but had recovered in January to be back around their October levels. Members noted that share prices of Australian banks had risen on the morning of the meeting, following the release of the final report of the royal commission and the Government’s response the preceding afternoon.
Money market interest rates had remained higher than a year earlier, contributing to a small increase in banks’ funding costs over the period since then. In response, most lenders had increased their standard variable mortgage interest rates a little since mid 2018. However, the effect of rising standard variable rates had been partly offset by borrowers refinancing at lower rates, given the strong competition for low-risk borrowers. Members noted that, overall, mortgage interest rates remained relatively low.
Turning to global financial markets, members observed that financial conditions had tightened somewhat in recent months in most advanced economies, with increased volatility and a general rise in equity and credit risk premiums. Nevertheless, there had been a partial retracement of the tightening in recent weeks and financial conditions remained accommodative.
At its January meeting, the US Federal Open Market Committee (FOMC) had left the federal funds rate unchanged and removed its forward guidance for further interest rate increases. The FOMC had emphasised that it would be patient in making any future adjustments to the federal funds rate, and that future monetary policy decisions would be more closely guided by the incoming data because interest rates were closer to estimates of neutral. The FOMC had also indicated that it would be open to slowing the pace of its planned balance sheet reduction if warranted by economic or market developments. Financial market pricing had shifted to imply that the next move in the federal funds rate was expected to be down, although this was not expected to occur until at least late 2020. Elsewhere, the European Central Bank and the Bank of Japan were expected to maintain their stimulatory policy settings for an extended period.
Members noted that government bond yields had declined across the major global markets over the preceding two months, reflecting the downward shift in expectations for future policy rates, along with a fall in compensation for future inflation following falls in oil prices. These changes had also reflected increased concerns about downside risks to the outlook for global growth. Australian government bond yields had declined broadly in line with global developments, with long-term government bond yields in Australia remaining around 50 basis points below those in the United States.
There had been a modest depreciation of the US dollar in nominal trade-weighted terms since late 2018, reflecting the more noticeable shift in the outlook for monetary policy in the United States than in other major economies. Members noted that the depreciation had been more pronounced against the Japanese yen, which had appreciated to around its highest level in two years on a trade-weighted basis. The Chinese renminbi had also appreciated modestly over the preceding month, reflecting the depreciation of the US dollar as well as signs of some progress on US–China trade negotiations.
The Australian dollar had depreciated a little further in nominal trade-weighted terms over the preceding two months, largely reflecting the appreciation of the yen and renminbi. However, overall, the Australian dollar had remained within the range observed over the preceding few years. Members observed that there had been two broadly offsetting influences on the Australian dollar exchange rate over the preceding year: the increase in commodity prices and the terms of trade had been supporting the Australian dollar over this period, while the relative decline in Australian government bond yields had been working in the opposite direction.
In global capital markets, corporate bond spreads had risen in recent months and bond issuance had eased, particularly for lower-rated borrowers. There had been some retracement of the increase in corporate borrowing costs in early 2019. Similarly, global equity markets had declined sharply in late 2018, before recovering somewhat since. The widening in credit spreads and decline in equity prices had reflected lower expectations for corporate earnings growth, as well as a rise in the risk premium demanded by investors. However, members observed that overall borrowing costs for corporations had remained low as a result of low government bond yields, and the corrections in these markets had followed an extended period of elevated valuations, particularly in the United States.
In China, the authorities had implemented further targeted measures to support lending to private firms, particularly small-sized enterprises, in the context of slowing economic growth. These firms’ access to finance had been tightened over the course of 2018 as a result of earlier measures by the authorities to reduce risks in the financial system by restricting the availability of ‘shadow finance’. Since the latter part of 2018, the authorities had been encouraging banks to increase their lending to these types of firms, although members noted that larger banks were less accustomed to lending to this sector.
Members noted that conditions in other emerging markets had stabilised in recent months, following a tightening in conditions during 2018. Currencies had appreciated, equity prices had risen, bond spreads had narrowed and capital outflows had moderated across a number of emerging market economies. These developments had reflected policy adjustments in some countries, lower policy rate expectations in the United States and the associated depreciation of the US dollar, and, for oil-importing countries, the decline in oil prices. However, members noted that there remained a risk that financial conditions in emerging markets could tighten further. Concerns about trade tensions and a slowdown in growth, particularly in China, remained particularly important for emerging markets in Asia.
Financial market pricing implied that the Australian cash rate was expected to remain unchanged for a considerable period, with some expectation of a decrease by late 2019.
Considerations for Monetary Policy
In considering the stance of monetary policy, members observed that the global economy had continued to grow at an above-trend pace in 2018, although growth had moderated in some economies in the second half of the year. In particular, growth in China had slowed further and the authorities had continued to ease policy in a targeted way to support growth, while continuing to pay close attention to risks in the financial sector. Labour markets in the advanced economies had continued to tighten and wages growth had picked up. Core inflation had picked up in a number of economies, including the United States. Globally, lower oil prices had led to a decline in headline inflation.
Growth in Australia’s major trading partners was expected to be around trend over the following year or so, but the downside risks had increased. Slowing growth in China and ongoing trade tensions had led to lower growth in global trade. Forecasters had lowered their outlook for global growth and market participants no longer expected a further tightening of monetary policy in the United States. Government bond yields had also declined in most countries, including Australia. More broadly, however, financial conditions had tightened somewhat in most major advanced economies, but remained accommodative. The terms of trade had remained above their trough in early 2016 and the Australian dollar had remained within its narrow range of recent times.
Domestically, growth in output had been weaker than expected in the September quarter. Nevertheless, growth was expected to be a little above trend over the forecast period. The outlook for business investment and spending on public infrastructure was positive. Growth in consumption was expected to be supported by a pick-up in growth in household disposable income, although recent data had prompted a downward revision to the consumption outlook. The outlook for consumption continued to be one of the key uncertainties for the forecasts for the domestic economy, given the environment of declining housing prices, low growth in household income and high debt levels.
Following a significant increase in construction activity and a large run-up in housing prices, housing markets were going through a period of adjustment. Housing prices in Sydney and Melbourne had declined further and the outlook for dwelling investment had been revised lower. In Sydney, rental vacancy rates had been increasing and rent inflation remained low across the country. Credit conditions had tightened for some borrowers and the demand for credit in the housing market, particularly by investors, had slowed noticeably as the dynamics of the housing market had changed. But housing lending rates had remained low and there was strong competition for borrowers of high credit quality.
The labour market had tightened further over 2018 and there had been some pick-up in wages growth. The unemployment rate had declined by ½ percentage point to 5 per cent, its lowest level in over seven years, and employment growth had been above average. The Bank’s forecast was for the unemployment rate to decline a little further over the following few years. The vacancy rate was high and there were reports of skills shortages in some areas. Wages growth was expected to pick up gradually over the following year or so.
Inflation had remained low and stable in both headline and underlying terms over 2018. Underlying inflation was expected to pick up gradually over the forecast period, although headline inflation was expected to decline in the near term because of lower petrol prices.
Members noted that the sustained low level of interest rates over recent years had been supporting economic activity and had allowed for gradual progress to be made in reducing the unemployment rate and returning inflation towards the midpoint of the target. While the labour market had continued to strengthen over the preceding year, less progress had been made on inflation. Taking account of the available information on current economic and financial conditions, as well as the revised forecasts, members assessed that the current stance of monetary policy should continue to allow for further gradual progress on both unemployment and inflation to be made. However, members noted that there were significant uncertainties around the forecasts, with scenarios where an increase in the cash rate would be appropriate at some point and other scenarios where a decrease in the cash rate would be appropriate. Moreover, the probabilities around these scenarios were now more evenly balanced than they had been over the preceding year, when an eventual increase in the cash rate had appeared more likely.
Members would continue to assess the outlook carefully. However, given that further progress in reducing unemployment and lifting inflation was a reasonable expectation, members agreed that there was not a strong case for a near-term adjustment in monetary policy. Rather, they assessed that it would be appropriate to hold the cash rate steady and for the Bank to be a source of stability and confidence while further progress unfolds. Members judged that holding the stance of monetary policy unchanged at this meeting would be consistent with sustainable growth in the economy and achieving the inflation target over time.
The Decision
The Board decided to leave the cash rate unchanged at 1.5 per cent.