
John Adams and I discuss the RBA Governor’s recent speech on “In The Interests Of The People“. This is a brief extract. See the full show by following this link.
Tag: RBA
RBA “Even Money” On Rate Rise Or Rate Fall
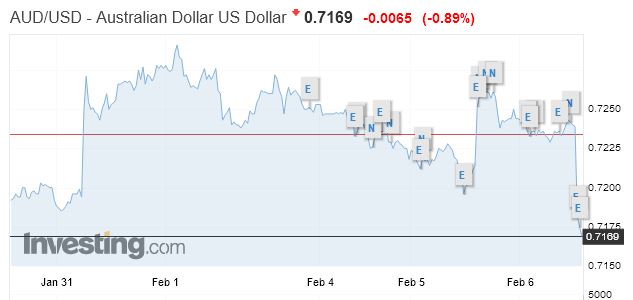
RBA Governor Philip Lowe, addressed the National Press Club today, providing an upbeat assessment of the economy. He was even money on the next rate move, but interestingly he blamed lack of supply of housing not credit supply, or low interest rates for high home prices. He believes wages will rise, eventually. And finally he down rated the international risks, such asset price bubbles, in favour of a arrange of more political risks. Mr optimistic.
And regulators are not be blamed for the poor outcomes from the finance sector, as highlighted by the Royal Commission.
The Aussie slid on the remarks.
Thank you for the opportunity to address the National Press Club. It is an honour to have been invited.
The media and the RBA have a special relationship. Most people in the community hear the RBA’s messages through the media. You report on what we say, you filter it and you critique it. We also help you with your work. The RBA is a reliable source of information and analysis on issues that your audiences care about, including interest rates, housing prices and jobs. This means we have a strong mutual interest in understanding one another. I hope that today will help strengthen that understanding.
This is my first public speech for 2019, so I would like to talk about the year ahead and some of the key issues that the RBA will be focusing on. I will first discuss the global economy and then turn to the Australian economy and particularly the outlook for household spending. I will finish with a few remarks on the outlook for monetary policy.
At the outset, I want to emphasise that we don’t have a crystal ball that allows us to see the future with certainty. I know many of you are looking for definitive answers to questions like, ‘Where will the cash rate be this time next year?’, ‘How much will housing prices fall?’, ‘When will wages growth reach 3 per cent?’. They are all good questions. The reality, though, is that the future is uncertain. None of us can say with certainty what will happen.
What the RBA can do, though, is highlight the issues that are likely to shape the future, explain how we are thinking about those issues, and discuss how they fit into our decision-making framework. That is what I hope to do today.
The Global Economy
I will start with the global economy, because what happens overseas has a major bearing on what happens in Australia. My main point here is that while some of the downside risks have increased, the central scenario for the world economy still looks to be supportive of growth in Australia.
It is worth recalling that 2018 was a good year for the world economy. Growth in the advanced economies was above trend in the first half of the year, unemployment rates reached their lowest levels in many decades, inflation was low and financial systems were stable (Graph 1). These are positive outcomes. We should not lose sight of this.
There was, though, a change in momentum in the global economy late in the year. This change was particularly evident in Europe and it was also evident in China. It has been widely reported in the media, but it is important to keep things in perspective.
Some slowing in global growth was expected, given that labour markets are fairly tight and the policy tightening in the United States was aimed at achieving a more sustainable growth rate. So, I have been a little surprised at some of the reaction to the lowering of forecasts for global growth, which has been quite negative. We need to remember that the IMF’s central forecast is still for the global economy to expand by 3.5 per cent in 2019 and by 3.6 per cent in 2020 (Graph 2). If achieved, these would be reasonable outcomes and not too different from the recent past.
What is of more concern, though, is the accumulation of downside risks. Many of these risks are related to political developments: the trade tensions between the United States and China; the Brexit issue; the rise of populism globally; and the reduced support from the United States for the liberal order that has supported the international system and contributed to a broad-based rise in living standards. One could add to this list the adjustments in China as the authorities rein in shadow financing.
The origins of these diverse issues are complex, but there is a common economic element to some of them: that is, the extended period of little or no growth in real incomes for many people. In a number of countries, growth in real wages has been weak or negative for years. Advances in technology and greater competition as a result of globalisation also mean that many people worry about their own future and that of their children. Politicians, understandably, are responding to these concerns. Time will tell, though, whether the various responses help or not. I suspect that some of them will not.
Over recent months, the accumulation of downside risks has been evident in business and consumer surveys. It was also evident in increased volatility in financial markets around the turn of the year, with declines in equity prices and an increase in credit spreads (Graph 3). Since then, though, markets have been more settled and some of the earlier decline in equity prices has been reversed. This has been partly on the back of a reassessment of the path of monetary policy in the United States, with markets no longer pricing in further increases in US interest rates. There has also been a noticeable fall in long-term government bond yields.
The adjustments in financial markets over our summer sometimes generated reporting that, to me, seemed overly excitable. I lost count of how many times I read the words ‘crash’, ‘plunge’ and ‘dive’. Yet there is a positive side to some of these adjustments, which gets less reported on. The risks associated with stretched valuations in some equity markets have lessened. So, too, have concerns that very low credit spreads could lead to an excessive build-up of risk. And risks in many emerging market economies have also receded, helped by the lower global interest rates and lower oil prices. So it is important to look at the whole picture.
For Australia, what happens in China is especially important. Growth there has slowed. From a medium-term perspective, this has a positive side, as it mainly reflects efforts to rein in risky financial practices and stabilise debt levels. But the slowing is probably faster than the government had hoped for, with the economy feeling the effects of the trade dispute with the United States and the squeezing of finance to the private sector. The authorities have responded by easing policy in some areas, but they are walking a fine line between supporting the economy and addressing the debt problem. There is also the question of how the economy responds to the policy easing.
More broadly, we cannot insulate ourselves completely from the global risks, but keeping our house in order can go a long way to assist. Our floating exchange rate and the flexibility we have on both monetary and fiscal policies provide us with a degree of insulation. So, too, does our flexible labour market. Ensuring that we have predictable and consistent economic policies, credible public institutions and a reform agenda that supports a strong economy can also help in an uncertain world.
The Domestic Outlook
I would now like to turn to the outlook for the Australian economy. Much as is the case globally, the downside risks have increased, although we still expect the Australian economy to grow at a reasonable pace over the next couple of years.
The Australian economy is benefiting from strong growth in infrastructure investment and an upswing in other areas of investment. The labour market is also strong, with many people finding jobs. This year, we will also benefit from a further boost to liquefied natural gas (LNG) exports. The lower exchange rate and a lift in some commodity prices are also assisting. Against this generally positive picture, the major domestic uncertainty is the strength of consumption and the housing market.
We will be releasing a full updated set of forecasts in the Statement on Monetary Policy (SMP) on Friday. Close readers of the SMP will notice that we will now be publishing forecasts for a wider set of variables than has previously been the case.[1] We hope that this helps people understand the various forces shaping the economy.
Today, I can give you a summary of the key numbers.
Our central forecast is for the Australian economy to expand by around 3 per cent over 2019 and 2¾ per cent over 2020 (Graph 4). For 2018, the outcome is expected to be a bit below 3 per cent. This type of growth should be sufficient to see further gradual progress in lowering unemployment.
These forecasts are lower than the ones we published three months ago. For 2018, the outcome is affected by the surprisingly soft GDP number in the September quarter and the ABS’s downward revisions to estimates of growth earlier in the year. We are expecting a stronger GDP outcome in the December quarter, with other indicators of economic activity painting a stronger picture than suggested by the September quarter national accounts.
For 2019 and 2020, the forecasts have been revised down by around ¼ percentage point, largely reflecting a modest downgrading of the outlook for household consumption and residential construction. I will talk more about this in a moment.
The outlook for the labour market remains positive. The national unemployment rate currently stands at 5 per cent, the lowest in over seven years (Graph 5). In New South Wales and Victoria, the unemployment rate is around 4¼ per cent. You have to go back to the early 1970s to see sustained lower rates of unemployment in these two states. The forward-looking indicators of the labour market also remain positive. The number of job vacancies is at a record high and firms’ hiring intentions remain strong. Our central scenario is that growth will be sufficient to see a modest further decline in unemployment to around 4¾ per cent over the next couple of years.
The other important element of the labour market is how fast wages are increasing. For some time, we have been expecting wages growth to pick up, but to do so gradually. The latest data are consistent with this, with a turning point now evident in the wage price index (Graph 6). Through our discussions with business we are also hearing more reports of firms finding it difficult to find workers with the necessary skills. In time, this should lead to larger wage rises. This would be a positive development.
Given this outlook, we continue to expect a gradual pick-up in underlying inflation as spare capacity in the economy diminishes (Graph 7). However, the lower forecast for growth means that this pick-up is expected to occur a bit later than we’d previously thought. Underlying inflation is now expected to increase to about 2 per cent later this year and to reach 2¼ per cent by the end of 2020. The latest CPI data were consistent with this outlook. The headline CPI number was, however, a bit lower than we had previously expected, reflecting the decline in petrol prices that started late last year. We expect headline inflation to decline further this year as the full effect of lower petrol prices shows up in the figures.
So that is the summary of the key numbers.
As always, there is a range of uncertainties, many of which will be discussed in the SMP on Friday. Today, though, I would like to focus on the outlook for household spending, which is closely linked to the housing market and the prospects for growth in household income.
Before I do that, I would like to touch on one related uncertainty that we have been paying attention to – that is the supply of credit. This is because a strong economy requires access to finance on reasonable terms. Over recent years there has been a needed tightening of credit standards. But the right balance needs to be struck. As lenders have sought to find that balance, we have had some concerns that the pendulum may have swung too far the other way, especially for small business.
In that context, I welcome the report of the Royal Commission and the Government’s response. The Commission’s recommendations that bear on credit provision are balanced and sensible, and should remove some uncertainty. I also welcome the Commission’s focus on: the importance of service – as opposed to sales – in the financial sector; the necessity of dealing properly with conflict of interest issues; and the importance of accountability when things go wrong. These are all issues I have spoken about on previous occasions. Addressing them is central to rebuilding the all-important trust in our financial system.
Housing Prices and Household Income
But back to household consumption and the housing market.
You might recall that 18 months ago, one of the most talked about issues in the country was the high and rising cost of housing. This was understandable. In some of our cities, purchasing a home had become a very difficult stretch for many people, and this had become a major social issue.
Today, the talk is about prices falling in our two largest cities. We have moved almost seamlessly from worrying that prices were going up, to worrying that they are going down.
There is no single reason for this change, but, rather, it is the result of a number of factors coming together.
One is that housing prices simply increased to the point in Sydney and Melbourne where demand tailed off, as purchasing a home had become very expensive and less attractive as an investment.
A second is that the building boom over recent times significantly increased the supply of dwellings. It took a number of years before the rate of home construction picked up in response to faster population growth, but eventually it did pick up. This explains much of the cycle.
A third factor is that the demand from overseas investors softened, partly in response to the Chinese authorities making it more difficult to move money out of China.
And a fourth factor is that lending standards have been tightened and credit has become more difficult to obtain.
Importantly, unlike most other housing price corrections, this one has not been associated with rising unemployment or higher interest rates. Instead, mainly structural factors – relating to the underlying balance of supply and demand – in our largest cities have been at work.
The question is: what effect will this change have on household spending?
Here, my earlier observation about not having a crystal ball is relevant. At this point, though, what we are seeing looks to be a manageable adjustment in the housing market. It is not expected to derail economic growth. The previous trends in debt and housing prices were becoming unsustainable and some correction was appropriate. We recognise that this correction will have an effect on parts of the economy. But our economy should be able to handle this, and it will put the housing market on a more sustainable footing.
There are a few considerations here.
The first is that the recent housing price declines follow very large increases in prices (Graph 8). Even after the recent declines in Sydney, prices are still 75 per cent higher over the decade. In Melbourne, they are 70 per cent higher. While the price falls are no doubt difficult for some, including people who purchased in the past couple of years, there are many people sitting on very significant capital gains and there are others who now will find it easier to purchase a home. And of course, in a number of cities and much of regional Australia, things have been more stable.
A second consideration is that most households do not change their consumption in response to short-term changes in their wealth. Sensibly, many people tend to take a longer-term perspective. During the recent upswing in housing prices, the strategy of borrowing against the extra equity in your home looked less sensible than it once was, especially as debt levels rose. Some home-owners also see themselves as being part of the ‘bank of mum and dad’. This meant that they refrained from spending the extra equity so that they were able to help their children purchase their own property.
A third and perhaps the most important consideration, is that household income growth is expected to pick up and income growth usually matters more for consumption than changes in wealth.
For some years, growth in nominal aggregate household income has been unusually slow, averaging just 2¾ per cent since 2016 (Graph 9). For some home-owners, rising housing prices have provided an offset to this, even though the effect may have been smaller than in the past. As a result, aggregate consumption has grown faster than income for the past few years. But a shift is now taking place. Over the next year, we are expecting a pick-up in household disposable income to provide a counterweight to the wealth effects of lower housing prices.
Labour market outcomes are key to this assessment. Continued employment growth and higher wages growth should boost disposable incomes. The announced tax cuts should also help here. In our central scenario, consumption is expected to grow at around 2¾ per cent over the next couple of years, broadly in line with expected growth in disposable income. This is a bit lower than our earlier forecast for consumption.
There are, of course, other possible outcomes. Continued low income growth, together with falling housing prices, would be an unwelcome combination and would make for a softer outlook for the economy. Some Australian households have high levels of debt, so there is a degree of uncertainty about how they would respond to this combination. So we are monitoring things closely.
The adjustment in the housing market is also affecting the economy through residential construction activity and the spending that occurs when people move homes. Residential construction activity is currently around its peak level and the large pipeline of approved projects is expected to support activity for a while. Developers, though, are finding it more difficult to sell apartments off the plan, and lenders are less willing to provide finance. Sales of new detached dwellings have also slowed. The central forecast is for dwelling investment to decline by about 10 per cent over the next two and a half years.
Putting all this together, our economy is going through an adjustment following the turn in the housing markets in our largest cities. It is important that we keep this in perspective though.
The correction in the housing market follows an extended period of strength. It is largely due to structural supply and demand factors, and is occurring against the backdrop of a robust economy and an expected pick-up in income growth. Our financial institutions are also in a strong position to deal with the adjustment. Indeed, lending standards were strengthened as the upswing went on. From this perspective, the adjustment in the housing market is manageable for the financial system and the economy. This adjustment will also help increase the affordability of housing for many people. Even so, given the uncertainties, we are paying very close attention to how things evolve.
Monetary Policy
This brings me to monetary policy.
The cash rate has been held steady at 1½ per cent since August 2016. This setting has helped support the economy. The Reserve Bank Board has sought to be a source of stability and confidence while our economy adjusted to the end of the mining investment boom and responded to the shifting sands of the global economy.
Over the past couple of years, economic conditions have been moving in the right direction. The labour market has strengthened, and the unemployment rate has fallen and a further decline is expected. Inflation is also above its earlier trough, although it has not changed much over the past year. Our expectation has been – and continues to be – that the tighter labour market and reduced spare capacity will see underlying inflation rise further towards the midpoint of the target range. Given this, we have maintained a steady setting of monetary policy while the labour market strengthens and inflation increases.
Looking forward, there are scenarios where the next move in the cash rate is up and other scenarios where it is down. Over the past year, the next-move-is-up scenarios were more likely than the next-move-is-down scenarios. Today, the probabilities appear to be more evenly balanced.
We will be monitoring developments in the labour market closely. If Australians are finding jobs and their wages are rising more quickly, it is reasonable to expect that inflation will rise and that it will be appropriate to lift the cash rate at some point. On the other hand, given the uncertainties, it is possible that the economy is softer than we expect, and that income and consumption growth disappoint. In the event of a sustained increased in the unemployment rate and a lack of further progress towards the inflation objective, lower interest rates might be appropriate at some point. We have the flexibility to do this if needed.
The Board will continue to assess the outlook carefully. It does not see a strong case for a near-term change in the cash rate. We are in the position of being able to maintain the current policy setting while we assess the shifts in the global economy and the strength of household spending.
It has long been the Board’s approach to avoid reacting to the high-frequency ebb and flow of news. Instead, we have sought to keep our eye on the medium term and put in place a setting of monetary policy that helps deliver on our objectives of full employment, an inflation rate that averages between 2 and 3 per cent, and financial stability.
Thank you for listening. I look forward to answering your questions.
RBA Holds, Of Course
At its meeting today, the Board decided to leave the cash rate unchanged at 1.50 per cent.
I think they are living in a parallel universe!
The global economy grew above trend in 2018, although it slowed in the second half of the year. Unemployment rates in most advanced economies are low. The outlook for global growth remains reasonable, although downside risks have increased. The trade tensions are affecting global trade and some investment decisions. Growth in the Chinese economy has continued to slow, with the authorities easing policy while continuing to pay close attention to the risks in the financial sector. Globally, headline inflation rates have moved lower due to the decline in oil prices, although core inflation has picked up in a number of economies.
Financial conditions in the advanced economies tightened in late 2018, but remain accommodative. Equity prices declined and credit spreads increased, but these moves have since been partly reversed. Market participants no longer expect a further tightening of monetary policy in the United States. Government bond yields have declined in most countries, including Australia. The Australian dollar has remained within the narrow range of recent times. The terms of trade have increased over the past couple of years, but are expected to decline over time.
The central scenario is for the Australian economy to grow by around 3 per cent this year and by a little less in 2020 due to slower growth in exports of resources. The growth outlook is being supported by rising business investment and higher levels of spending on public infrastructure. As is the case globally, some downside risks have increased. GDP growth in the September quarter was weaker than expected. This was largely due to slow growth in household consumption and income, although the consumption data have been volatile and subject to revision over recent quarters. Growth in household income has been low over recent years, but is expected to pick up and support household spending. The main domestic uncertainty remains around the outlook for household spending and the effect of falling housing prices in some cities.
The housing markets in Sydney and Melbourne are going through a period of adjustment, after an earlier large run-up in prices. Conditions have weakened further in both markets and rent inflation remains low. Credit conditions for some borrowers are tighter than they have been. At the same time, the demand for credit by investors in the housing market has slowed noticeably as the dynamics of the housing market have changed. Growth in credit extended to owner-occupiers has eased to an annualised pace of 5½ per cent. Mortgage rates remain low and there is strong competition for borrowers of high credit quality.
The labour market remains strong, with the unemployment rate at 5 per cent. A further decline in the unemployment rate to 4¾ per cent is expected over the next couple of years. The vacancy rate is high and there are reports of skills shortages in some areas. The stronger labour market has led to some pick-up in wages growth, which is a welcome development. The improvement in the labour market should see some further lift in wages growth over time, although this is still expected to be a gradual process.
Inflation remains low and stable. Over 2018, CPI inflation was 1.8 per cent and in underlying terms inflation was 1¾ per cent. Underlying inflation is expected to pick up over the next couple of years, with the pick-up likely to be gradual and to take a little longer than earlier expected. The central scenario is for underlying inflation to be 2 per cent this year and 2¼ per cent in 2020. Headline inflation is expected to decline in the near term because of lower petrol prices.
The low level of interest rates is continuing to support the Australian economy. Further progress in reducing unemployment and having inflation return to target is expected, although this progress is likely to be gradual. Taking account of the available information, the Board judged that holding the stance of monetary policy unchanged at this meeting would be consistent with sustainable growth in the economy and achieving the inflation target over time.
RBA Says Credit Hits New High, But Growth Is Lower Again
The December 2018 data from the RBA has been released today, and credit growth continues to slow, led down by both housing and business finance. That said total credit is still expanding, and housing credit reached a new record, $1.8 trillion dollars. Within that Owner occupied loans were reported at $ 1.21 trillion dollars and Investment loans $0.59 trillion, accounting for 32.9% of all housing lending. Credit to business was up a little to 32.8% of all lending stock. Personal credit shrank again.
The share of lending for housing investment fell again, while the business mix was up just a little.
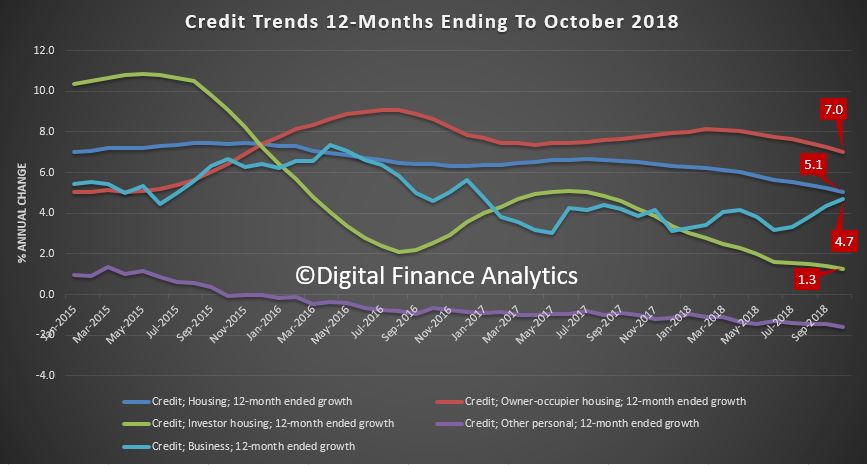
Total credit for housing was an annualised 4.7% compared with 6.3% a year ago. Personal credit was down again, to -2.0% over the past year, compared with -1.1% a year before, and business credit was at 4.8% compared with 3.1% a year back.
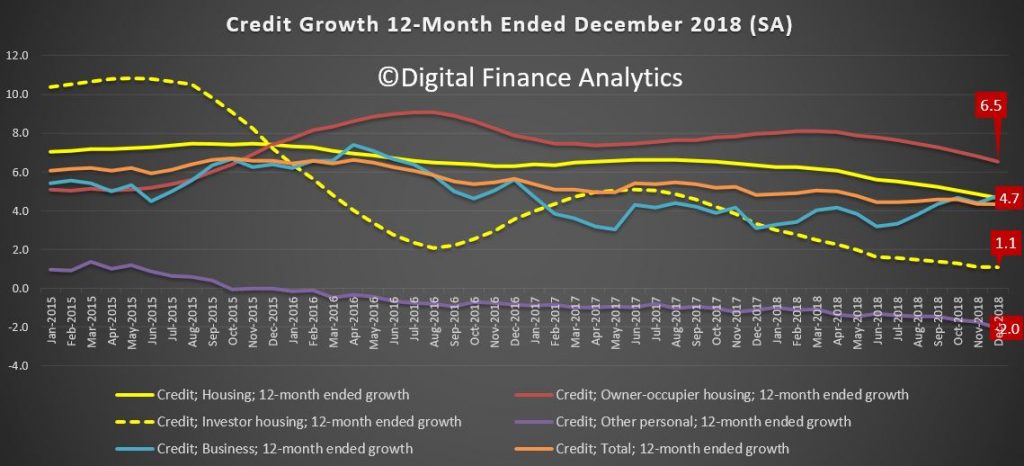
Within the housing sector, home lending for investment purposes was at 1.1% and for owner occupation a (still massive) 6.5%. Still way higher than inflation and wages, so household debt ratios will continue to deteriorate.
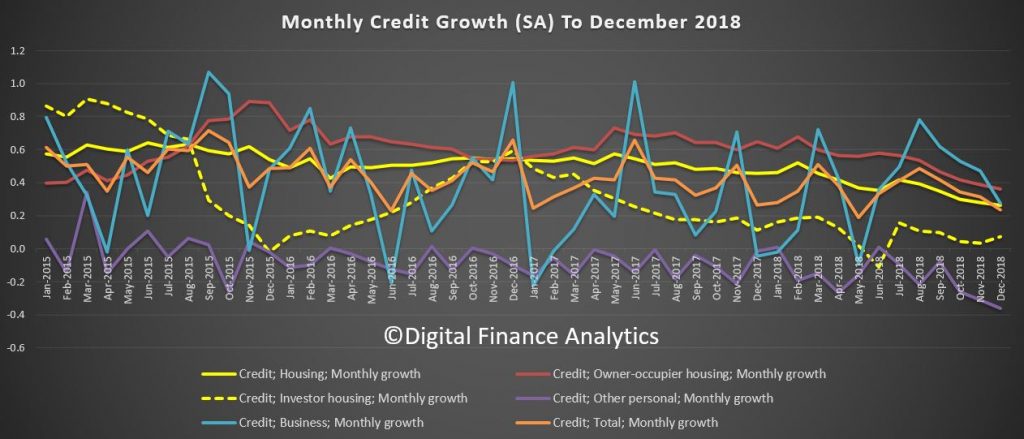
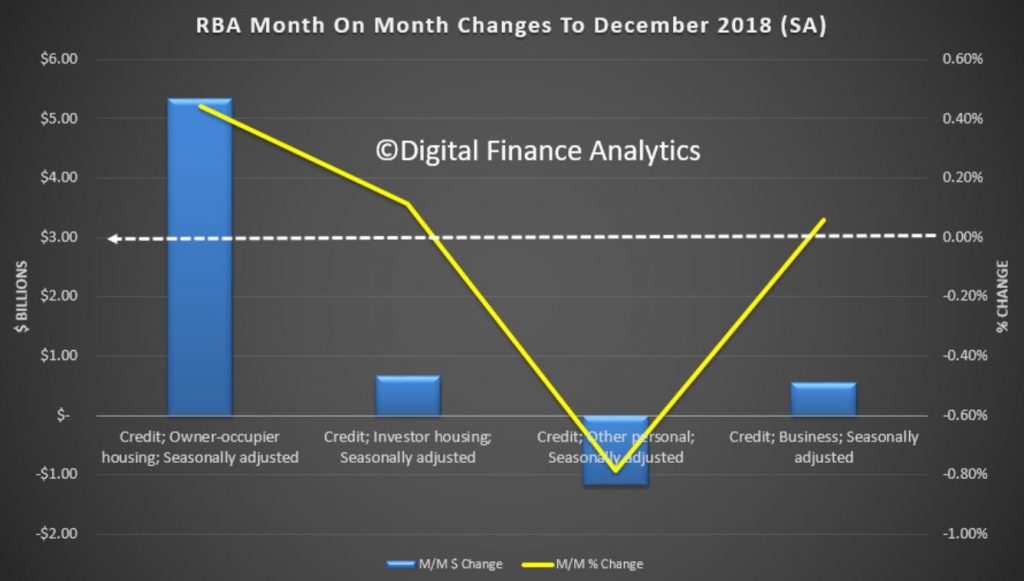
The monthly movements show a fall in business lending momentum and owner occupied lending, though a small uptick in investor loans, if from a low base.
The APRA data is also out today, so we will look at this later… But we can conclude the overall growth in housing lending is still building more risks in the market, despite all the hype. Credit loosening should be resisted.
Pressure mounts on RBA to cut rates
Another blowout in bank funding costs is adding to the pressure for an RBA rate cut, according to a leading forecaster, via InvestorDaily.
AMP Capital chief economist Shane Oliver is confident that the Reserve Bank will be forced to cut the cash rate by 50 basis points to 1 per cent this year.
He explained that Australian economic data has been soft in recent weeks with weak housing credit, sharp falls in home prices in December, another plunge in residential building approvals pointing to falling dwelling investment, continuing weakness in car sales, a loss of momentum in job ads and vacancies and falls in business conditions for December.
“Retail sales growth was good in November but is likely to slow as home prices continue to fall,” Mr Oliver said.
“Income tax cuts will help support consumer spending, but won’t be enough so we remain of the view that the RBA will cut the cash rate to 1 per cent this year.”
Meanwhile, another spike in funding costs has seen a number of lenders hike their mortgage rates in the first few weeks of 2019.
Bank of Queensland lifted rates by 18 basis points, while home loan providers Virgin Money and HomesStart Finance have also announced interest rate rises.
“The gap between the 3-month bank bill rate and the expected RBA cash rate has blown out again to around 0.57 per cent compared to a norm of around 0.23 per cent,” Mr Oliver said.
“As a result, some banks have started raising their variable mortgage rates again. This is bad news for households seeing falling house prices. The best way to offset this is for the RBA to cut the cash rate as it drives around 65 per cent of bank funding.”
Digital Finance Analytics principal Martin North believes even small rate rises could see more households pushed into mortgage stress and increase the risk of default among those already under pressure to meet their monthly repayments.
“The other point is that it will actually tip more borrowers into severe stress, that’s when you’ve got a serious monthly deficit. That’s the leading indicator for default 18 months down the track,” he said.
Decoding The Australian Economy
We review the RBA’s latest chart pack and discuss the key themes in the economy, including household debt, home prices, credit growth and international debt exposure.
The Debt Machine Is Alive And Well
As we approach the end of the year, we got some stats from the RBA on credit to the end of November. Whilst the debt is growing the value of the housing assets are falling, this is a nasty pincer movement!
Their credit aggregates reveals that in seasonally adjusted terms total credit rose by 0.34% or $9.9 billion dollars, to a new record of $2.9 trillion dollars.
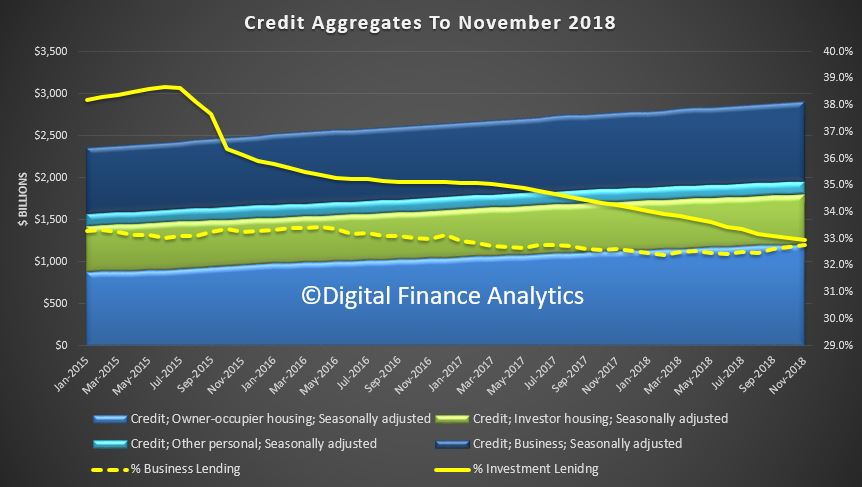
Within that credit for owner occupied housing rose 0.38%, or $4.63 billion to a new record $1.21 trillion dollars, lending for property investment was flat, standing at $0.59 trillion dollars and lending for business rose 0.56%, or $5.32 billion to $0.95 trillion dollars, another record. The proportion of business lending to all lending rose to 32.8%, while the share of residential property lending for investment property fell to 32.9%, the lowest in years (but still too high in my book!). Credit growth is too fast.
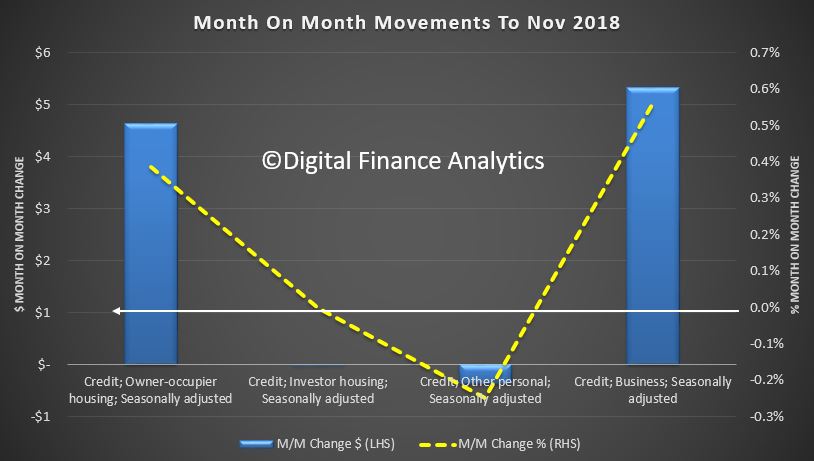
The trend charts show that on a 12 month basis, investment lending has now only growth 1.1%, while owner occupied lending is still running at 6.8%, still faster than business lending. Personal credit continues to fall.
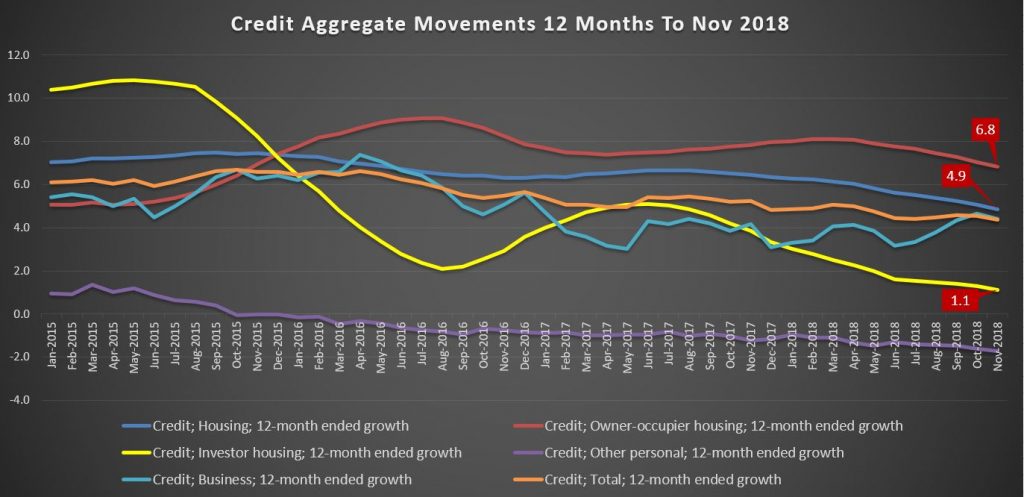
This indicates that despite all the hype about tight lending, loans are still being written, at a growth rate which is well above inflation and income. As a result the total debt burden is still rising. RBA please note.
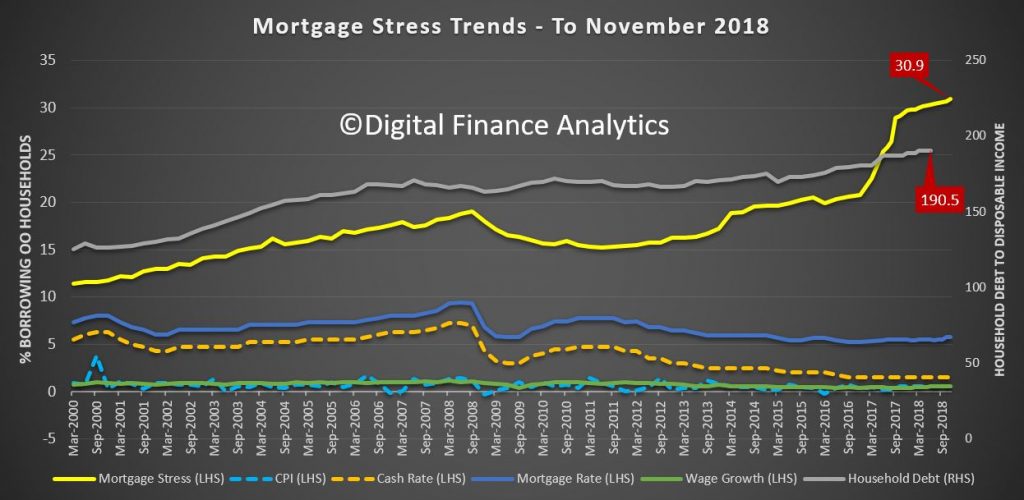
We can see the consequences working out by looking at the latest Household Finance Ratios from the RBA, using ABS data
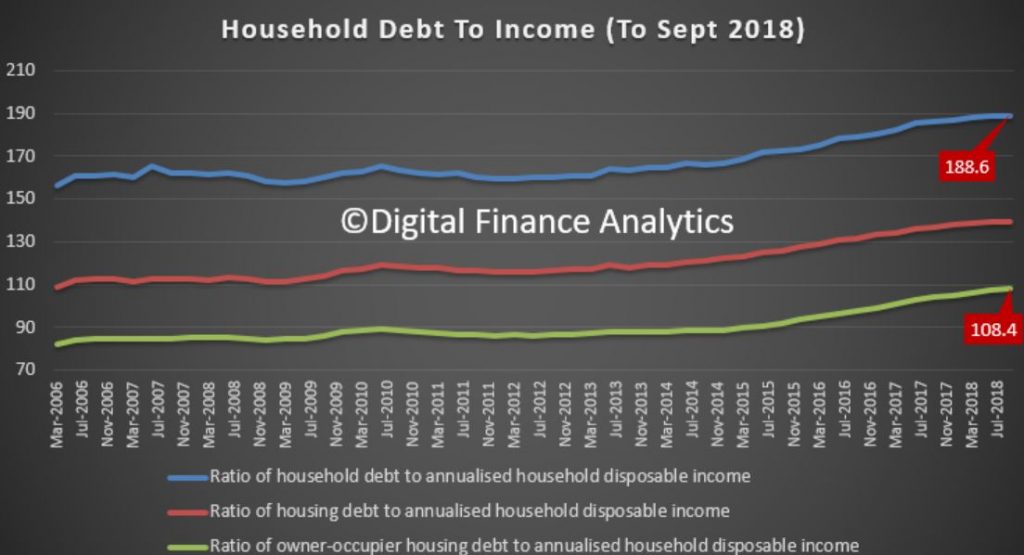
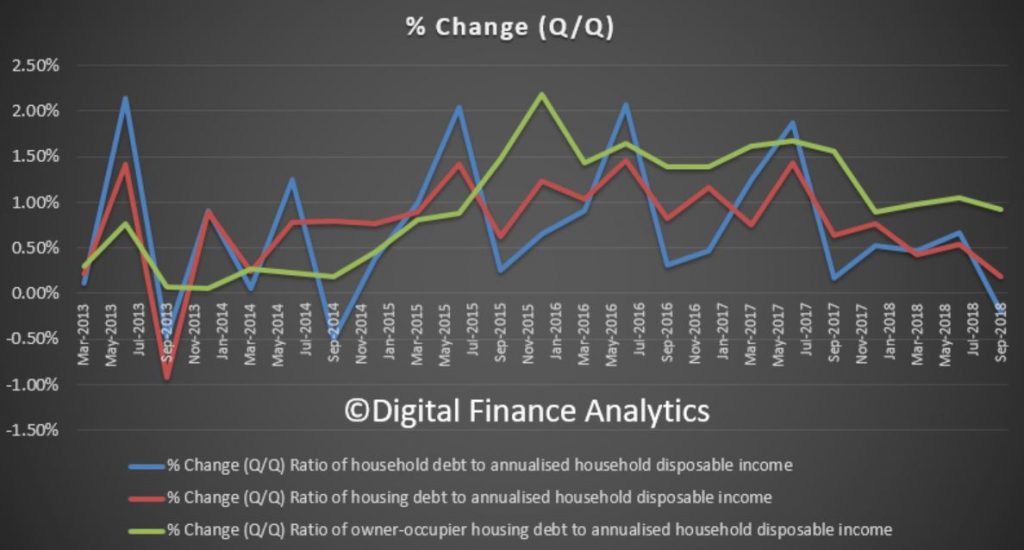
This shows that total household debt to income to September 2018 fell from 189 to 188.6, whilst the housing debt to income rose from 139.4 to 139.6 and the owner occupied ratio rose from 107.4 to 108.4. Now this ratio includes households and unincorporated businesses – small businesses essentially. So we see the continued consolidation of debt around housing, while other forms of debt, such as credit cards, diminished. In fact, the change quarter on quarter for owner occupied housing debt is close to 1%, so have no doubt, debt relative to income for housing is still rising.
The assets to income data in the same series fell, thanks to the fall in value of housing.
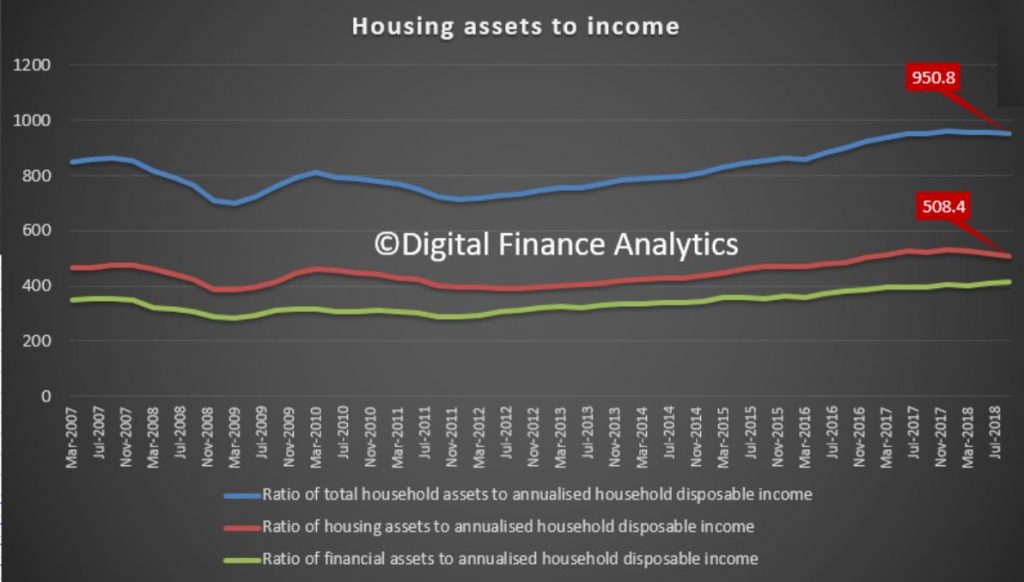
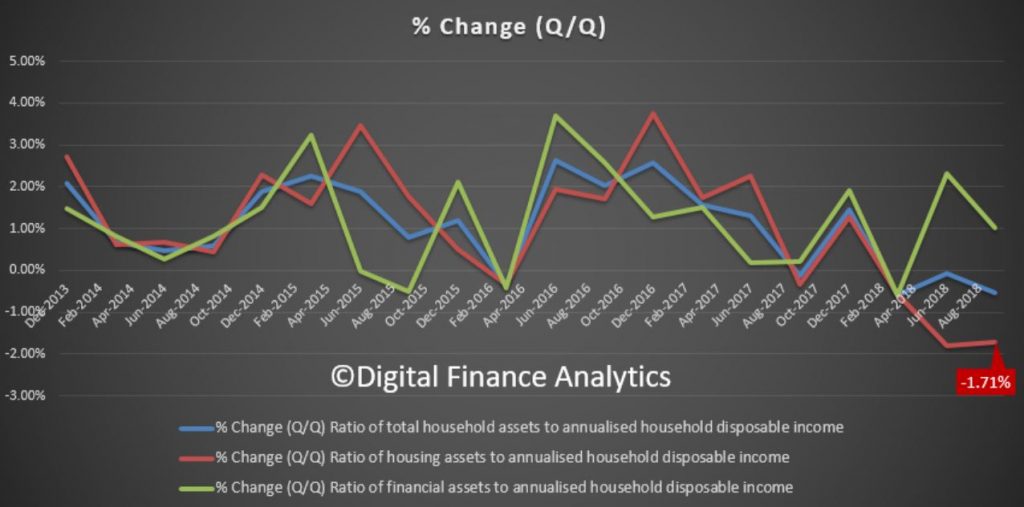
The ratio of household assets to income fell from 956.0 to 950.8, the ratio of housing assets to income fell from 517.3 to 508.4, down 1.7% in the quarter and 2.7% for the year to date, while the ratio of financial assets (stocks etc.) lifted from 410.3 to 414.5 (though will be lower now thanks to the recent market falls). In other words, whilst the debt is growing the value of the housing assets are falling – a double whammy.
The final dimension is interest payments to debt, both of which are higher (thanks to bigger loans and only small changes in mortgage rates).
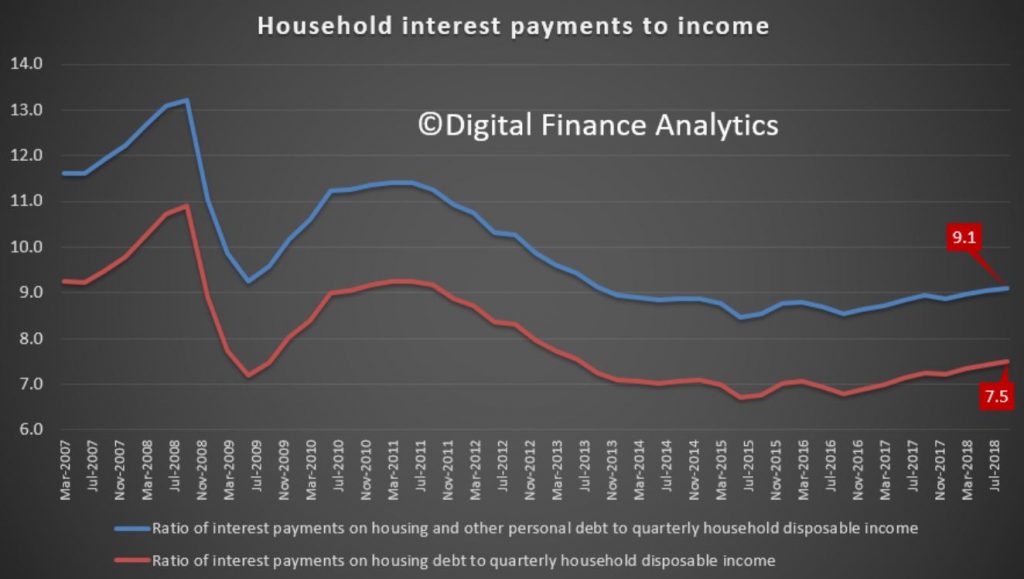
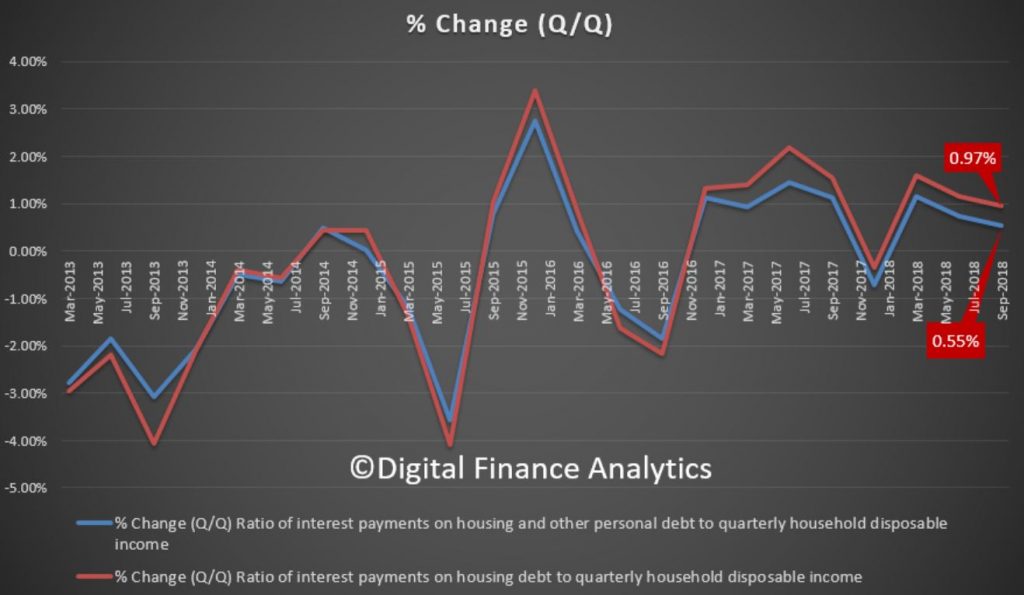
The ratio of housing debt interest repayments to income rose from 7.4 to 7.5 per cent and interest payments on all debt rose from 9.0 to 9.1 percent. This is confirming the growth trend since 2016, where the out of cycle interest repayments hit.
The point to note here is that the one third of households with mortgage debt are seeing a rise in the share of income going to support the interest repayments – at these extremely low, emergency interest rates. And that is the point, the averages mask the marginal borrower who remains under extreme pressure, which is why mortgage stress continues to rise. We will report on the December data in a week or so.
So the key take away as we move into 2019 is the debt machine is still working, more households are being encouraged to get deeper into debt, despite the clear evidence of massive over borrowing. A strategy applauded by the RBA, the Treasury and the Banks!
We really need a change in strategy because debt fueled household consumption and property speculation will be one of the nails in the economies coffin down the track. Interest rates will rise. The other is sporty corporate borrowing, but that is a story for another day!
Finally, seasons greetings to all our followers, and our best wishes for (a debt free) 2019!
The Establishment’s New Attempts To Escape Blame For Economic Armageddon
Economist John Adams and I discuss the moves by APRA and the RBA to loosen credit. What is really going on?
The John Adams And Martin North DFA Page
Please consider supporting our work via Patreon
Or make a one off contribution to help cover our costs via PayPal
Please share this post to help to spread the word about the state of things….
Caveat Emptor! Note: this is NOT financial or property advice!!
RBA Begs The Banks To Relent
Following the recent minutes from the Council of Financial Regulators, which is chaired by the RBA, now according to the Australian, the RBA has been lobbying the banks to lend more.
“Reserve Bank governor Philip Lowe is understood to have met with the big bank chiefs in recent weeks to caution them against an overzealous tightening of credit supply in response to lending rules and the Hayne royal commission”.
The RBA is of the view that lenders are turning good business away, and need to take risk on.
Some SME’s are getting caught in the cross fire, and its clear that business is finding it harder to get funding. This was covered in the RBA’s minutes, released yesterday.
Of course the responsible lending obligations have not changed, but now the meaning and obligations are front of mind. Thus banks need to examine income and expenses etc and cannot necessarily rely on HEM or mortgage brokers. So all this is in direct opposition to the RBA’s wishes, and we suspect the risk of legal action, or worse will continue to limit bank lending.
The ASIC Westpac case will be back before the courts in the new year, though as yet is not clear whether HEM will be tested in court, or whether its more about reaching a settlement. And the royal commission recommendations will be out in February
Is the RBA really condoning the bad behaviour and law breaking exposed in the past year?
And remember that currently mortgage lending is still running at more than 5% on an annualised basis, according to RBA data.
The fundamental problem is the RBA has been responsible for the growth of credit to the point where households in Australia are some of the most leveraged in the world, home prices have exploded and bank balance sheets have inflated. But all this “growth” is illusory. Mortgage stress continues to build and the wealth effect is reversing as home prices slide.
Thus, as we anticipated, we will see a number of “unnatural acts” by the RBA and the Government to try and stop the debt bomb from exploding, by trying to get credit to expand. But this is irresponsible behaviour, in the light of rising global interest rates, high market volatility and building systemic risks.
RBA Minutes For December 2018
The RBA minutes today highlighted slowing global growth, GDP growth expectations were stronger than in MYEFO, a decline in the demand for off-the-plan apartments, and average earnings had increased at roughly the same rate as consumer prices over the previous five years or so, leaving real average earnings relatively unchanged despite moderate productivity growth. In addition, there was a pick-up in business lending (mainly to large corporates) by the major bank as growth in their housing lending had continued to slow. The outlook for household consumption continued to be a source of uncertainty because growth in household income remained low, debt levels were high and housing prices had declined. They are still suggesting the next cash rate move is up!

International Economic Conditions
Members commenced their discussion of the global economy by noting that conditions had remained positive, particularly in the major advanced economies, where growth had remained around or above potential and labour markets had continued to tighten. However, growth in a number of economies had slowed this year; softer external demand, at least partly related to trade tensions and the associated uncertainty, had been a common driver of the slowdown. Bilateral US–China trade had contracted following the increase in import tariffs between the two countries, while indicators of external demand, such as new export orders, had softened in the euro area, Japan and other parts of Asia.
In the major advanced economies, GDP growth outcomes had diverged further in the September quarter, although there had been some loss of momentum in external demand in all regions. In the United States, growth had remained strong in the September quarter, driven in part by fiscal stimulus. In Japan, the pronounced slowing in year-ended GDP growth had been at least partly the result of disruptions in the wake of natural disasters. One-off factors had weighed on growth in some parts of the euro area, and business conditions and investment intentions there had also declined.
Employment growth had remained higher than growth in working-age populations across the major advanced economies and unemployment rates had edged lower from already low levels. Wages growth had continued to increase, but, with the exception of the United States, this had not yet translated into higher inflation in underlying terms. Core inflation had remained below target in the euro area and Japan. Members noted that headline inflation was likely to ease in coming months following the recent decline in oil prices.
Members noted that it had continued to be difficult to gauge the underlying momentum in the Chinese economy. Conditions had remained subdued in a number of sectors, including machinery & equipment production and food & clothing. By contrast, the central authorities’ direction to local governments to bring forward public spending had contributed to a rebound in infrastructure investment, and the production of construction-related products had strengthened further. Infrastructure investment was expected to continue to support growth in coming months. Growth in investment in the real estate sector had continued to be driven by land purchases.
Elsewhere in east Asia, surveyed business conditions had remained around average and growth in domestic demand had generally maintained its momentum. However, new export orders had declined and growth in industrial production and export volumes had also eased somewhat in recent months. Growth in the Indian economy had eased in the September quarter, but had remained strong in year-ended terms.
The slowing in global trade and concerns about Chinese demand had been reflected in lower commodity prices over preceding weeks. Iron ore prices had followed the recent decline in Chinese steel prices, returning to levels previously seen in mid 2018. Coking coal prices had increased over the previous month despite the fall in steel prices. Thermal coal prices had declined slightly, while prices of rural commodities and base metals had been little changed.
Members noted that oil prices had declined by more than 30 per cent since their peak in early October, mainly reflecting recent and prospective increases in global supply. Oil supply from the United States had increased rapidly since the trough in oil prices in early 2016 and was expected to increase further, while production from Saudi Arabia and Russia was expected to be sustained at high levels. Members observed that the nature of US oil production allowed supply flexibility in response to changes in oil prices.
Domestic Economic Conditions
Members noted that the national accounts for the September quarter would be released the day after the meeting. Based on the partial data that were available, GDP was expected to have increased by more than 3 per cent over the year to the September quarter, above most estimates of potential growth and in line with the most recent set of Bank forecasts.
In relation to household consumption, members noted that liaison with retailers suggested that underlying trading conditions had been stable and surveys suggested that households’ views about their financial situation had remained around average.
Conditions in established housing markets had continued to ease. In Sydney, housing prices had fallen by around 9 per cent since their peak in July 2017, to be around September 2016 levels. In Melbourne, housing prices had returned to levels prevailing around March 2017, having fallen by a little under 6 per cent since their peak in November 2017. Members observed that housing prices had fallen across all price segments in Sydney, but housing prices had been fairly flat at the lower end of the market in Melbourne. Auction clearance rates and indicators of private-treaty activity had also declined a little further in both cities. Housing prices in Perth and Darwin had returned to levels seen a decade earlier. At the same time, price rises were being recorded in some other cities.
Preliminary data suggested that dwelling investment had continued around its recent high level in the September quarter. Given the substantial amount of work outstanding and recent data on dwelling approvals, dwelling investment was expected to remain around this level for at least the following year or so before moderating. Liaison with developers indicated that demand for new detached housing in eastern Australia had eased over the previous year or so and some developers had reported that this decline in demand had become more pronounced. Demand for off-the-plan apartments had declined significantly since mid 2017.
Partial indicators, including the Australian Bureau of Statistics (ABS) capital expenditure (Capex) survey, suggested that both mining and non-mining business investment had declined in the September quarter. Investment intentions for 2018/19 in the non-mining sector, as reported in the Capex survey, had been revised higher. Members noted that these revised expectations were consistent with surveyed business conditions, which had remained above average, and with the relatively high levels of non-residential building approvals and work yet to be done on non-residential construction projects.
Members observed that labour market conditions had continued to improve. Employment had increased solidly in October to be 2.5 per cent higher over the year. This was well above growth in the working-age population and had been driven largely by growth in full-time employment. Leading indicators of labour demand had continued to point to employment growth being above average over the following couple of quarters. The unemployment rate had remained at 5 per cent in October, following the sharp decline in the previous month. Unemployment rates had fallen in almost all states and territories over 2018. In trend terms, the unemployment rates in Victoria and New South Wales were both at their lowest levels in a decade, at around 4½ per cent. Members noted that youth employment (those aged between 15 and 24 years) had increased significantly over the previous year and the youth unemployment rate had declined.
Wages growth had picked up a little in the September quarter. The wage price index (WPI) had increased by 0.6 per cent in the September quarter to be 2.3 per cent higher over the year. This pick-up had built on the small, gradual increases in WPI growth recorded over the previous two years. The 3.5 per cent increase in minimum and award wages had contributed to growth in the September quarter. Joint Reserve Bank–ABS analysis suggested that wages growth for jobs covered by the other two wage-setting methods, namely enterprise agreements and individual agreements, had also been stronger than a year earlier. This job-level analysis had also shown that, although there had been little change over the preceding year in the size of a typical wage increase, the share of the workforce receiving an increase in any given quarter had increased. Year-ended growth in the WPI had picked up compared with the previous year across most industries and in all states and territories.
Even so, average earnings had increased at roughly the same rate as consumer prices over the previous five years or so, leaving real average earnings relatively unchanged despite moderate productivity growth. This had followed an extended period during the resources boom when real average earnings had consistently risen faster than productivity. As a result, the gap between real average earnings and productivity that had opened up during the resources boom had been largely closed.
Members also discussed a paper on some longer-term trends in the division of aggregate income between labour and capital. In Australia, the share of total income paid to workers in wages and salaries (the ‘labour share’) had risen over the 1960s and 1970s but had gradually declined since then. Over the same period, the share of income accruing to profits (the ‘capital share’) had risen. Abstracting from fluctuations associated with the terms of trade cycle, the labour and capital shares had been fairly stable for at least the previous decade. Although the Australian experience appeared to have been similar to that observed in other advanced economies, the factors driving the trends had been somewhat different. Members noted that the long-run increase in the capital share in Australia had stemmed almost entirely from higher profits accruing to financial institutions (since financial deregulation in the 1980s) and from higher rents paid to landlords and imputed to home owners (particularly before the 1990s). Members observed that the increasing use of technology to replace manual effort in the finance sector and long-run increases in the quality and size of homes, as well as a greater number of dwellings per capita, were likely to have contributed to these trends. Members also noted the measurement challenges associated with both financial services and housing services in the national accounts.
Financial Markets
Members commenced their discussion of financial market developments by noting the pick-up in business credit growth in Australia in the second half of 2018. While foreign banks had been the main driver of growth in business lending for some time, the major Australian banks had also made a noticeable contribution to business credit growth in recent months. The pick-up in business lending by the major banks had occurred as growth in their housing lending had continued to slow. Members observed that lending to large businesses had accounted for the bulk of the growth in business credit over preceding years and all of the pick-up in business credit growth in the most recent few months.
By contrast, lending by banks to small businesses had increased only modestly over the preceding few years and had been flat in 2018. Moreover, small businesses’ perceptions of their access to finance had deteriorated sharply over the year, according to the Sensis survey. Members noted that the Australian Government had recently announced a number of initiatives to support lending to small businesses.
Turning to housing credit, members noted that growth in lending to investors had remained very weak and growth in lending to owner-occupiers had continued to ease, to be 5–6 per cent in annualised terms. The slowing in housing credit growth had been almost entirely accounted for by the major banks, where the rate of growth in lending had been the slowest in many years. Housing lending by other financial institutions had continued to grow more strongly.
Members observed that the slowing in housing credit growth appeared to reflect both tighter lending conditions and some weakening in demand. On the demand side, declining housing prices in some markets had reduced investor demand. In this context, lenders had continued to compete for borrowers of high credit quality by offering new loans at lower interest rates than those offered on outstanding loans. On the supply side, credit conditions were tighter than they had been for some time. Members noted that the focus on responsible lending obligations in response to the Royal Commission into Misconduct in the Banking, Superannuation and Financial Services Industry was likely to have reduced some lenders’ appetite for lending to both households and small businesses.
Mortgage interest rates remained low by historical standards, but had risen a little for many borrowers in previous months, as most lenders had passed on the increase in their funding costs resulting from the rise in bank bill swap rates earlier in 2018.
Members noted that financial market pricing implied that the cash rate was expected to remain unchanged for a considerable period.
Turning to global financial conditions, members noted that financial conditions in the advanced economies remained accommodative, although they had become less so over the course of the year. A few central banks had continued gradually to remove monetary policy stimulus and more recently global equity prices had declined and credit spreads had widened a little (although spreads remained relatively low).
Expectations regarding policy paths of the major central banks implied by financial market pricing had been generally little changed over the previous month. However, in the United States the path for the federal funds rate over 2019 implied by market pricing had moved further below that implied by the median of Federal Open Market Committee (FOMC) members’ projections published following the September FOMC meeting. Recent public comments by senior Federal Reserve officials had emphasised that further withdrawal of monetary stimulus would increasingly depend on how the economy evolves.
Members noted that 10-year government bond yields in major markets had declined in November. In part, this was likely to have reflected the lowering of market expectations for the federal funds rate in 2019, as well as the recent sharp decline in oil prices and some easing in expectations for global economic growth. In the United Kingdom, uncertainty surrounding the approval of a Brexit deal was also likely to have weighed on long-term bond yields.
Over the year as a whole, diverging central bank policy paths and economic outlooks had seen bond yields in the United States rise relative to those in Europe and Japan. Consistent with this, the US dollar had appreciated by 5 per cent over 2018 on a trade-weighted basis.
Global equity prices had declined in October reflecting a range of factors, including US–China trade tensions, building cost pressures in some countries and a moderation in earnings growth expectations for 2019. Also, equity valuations in the United States had earlier been somewhat elevated. Members noted, however, that the US equity market continued to be supported by strong growth in underlying corporate earnings, with analysts’ expectations for earnings growth in 2019 having been revised down only a little recently. In Europe, ongoing concerns about Italian fiscal policy settings, as well as the moderation in growth in the euro area in 2018, had weighed on equity prices, particularly for companies in the financial sector. Chinese equity prices had been declining throughout 2018, although they had not fallen further in November. The decline over the year was likely to have reflected concerns over US–China trade tensions and an easing in growth in economic activity.
Members observed that US corporate credit spreads had widened a little recently, although they remained low by historical standards. Members noted that this modest tightening in credit market conditions had occurred against a background of increased corporate leverage, with US non-financial corporations having increasingly sourced funding from securities markets over the preceding decade or so. Issuance of investment-grade bonds and, to a lesser extent, leveraged loans had been strong. Members also observed that securities markets had been increasingly facilitating lending to lower-rated corporations. While Europe and Australia had also seen increases in investment-grade bond financing by corporations, banks remained the predominant source of corporate funding in these markets.
Members noted that, although overall corporate leverage in the United States had increased over preceding years, it was not high compared with levels in other economies. Nevertheless, high and rising debt-servicing burdens and the relative increase in debt owed by borrowers of lower credit quality were likely to have increased the vulnerability of the corporate sector to adverse future shocks. On the lending side, the non-bank institutional investors that had recently provided most of the debt financing for corporations tended to have more stable funding and less leverage than banks. Members discussed implications of this for financial stability, given that, by itself, the reduced lending role of banks means that the US financial system would be better placed to withstand a deterioration in credit conditions than in the past. Overall, members agreed that developments in these markets warranted continued monitoring.
In China, growth in total social financing had slowed through much of 2018, mostly due to a contraction in non-bank lending, which had previously been a key source of funding for private firms. This followed earlier measures by the authorities to restrict the availability of credit provided by non-bank entities in order to reduce risks in the financial system. By contrast, growth in bank lending, which historically had been disproportionately directed towards state-owned enterprises, had been stable at a solid rate for a number of years. In recent months, the authorities had been taking steps to encourage banks to increase their lending to the private sector (especially smaller enterprises), although members noted that, relative to smaller banks and non-bank lenders, larger banks were less accustomed to lending to this sector.
Considerations for Monetary Policy
Globally, the economic expansion had continued, although there had been some signs of a slowing in global trade in the September quarter. In China, the authorities had continued to ease policy in a targeted way to support growth, while paying close attention to the risks in the financial sector. Members noted that balancing these considerations remained a key challenge for the Chinese authorities. Globally, inflation remained low, although wages growth had picked up in economies where labour markets had tightened significantly. Core inflation had picked up in the United States, which had experienced a sizeable fiscal stimulus against the background of very tight labour market conditions, but core inflation had remained low elsewhere. Members noted that the significant fall in oil prices was likely to reduce global headline inflation over the following year or so, should it be sustained.
Financial conditions in the advanced economies remained expansionary but had tightened somewhat because of lower equity prices, higher credit spreads and a broad-based appreciation of the US dollar over 2018, as the gradual withdrawal of US monetary policy accommodation had continued. In Australia, there had been a generalised tightening of credit availability. There had been little net growth in credit to small businesses in prior months. Standard variable mortgage rates were a little higher than a few months earlier, while the rates charged to new borrowers for housing were generally lower than for outstanding loans. The Australian dollar remained within its range of recent years on a trade-weighted basis. Australia’s terms of trade had increased over recent years, which had helped to boost national income.
Members noted that the Australian economy had continued to perform well. GDP growth was expected to remain above potential over this year and next, before slowing in 2020 as resource exports were expected to reach peak production levels around the end of 2019. Business conditions were positive and non-mining business investment was expected to increase. Higher levels of public infrastructure investment were also supporting the economy. The drought had led to difficult conditions in parts of the farm sector.
The outlook for household consumption continued to be a source of uncertainty because growth in household income remained low, debt levels were high and housing prices had declined. Members noted that this combination of factors posed downside risks. Notwithstanding this, the central scenario remained for steady growth in consumption, supported by continued strength in labour market conditions and a gradual pick-up in wages growth. The unemployment rate was 5 per cent, its lowest level in six years, and further falls in the unemployment rate were likely given the expectation that the economy would continue to grow above trend. The vacancy rate was high and there were reports of skills shortages in some areas.
Conditions in the Sydney and Melbourne housing markets had continued to ease and nationwide rent inflation was low. Growth in housing credit was very weak for investors and had also eased for owner-occupiers, reflecting both tighter lending conditions and some softening in demand. Mortgage rates remained low, and competition was strongest for borrowers of high credit quality.
Taking account of the available information on current economic and financial conditions, members assessed that the current stance of monetary policy would continue to support economic growth and allow for further gradual progress to be made in reducing the unemployment rate and returning inflation towards the midpoint of the target. In these circumstances, members continued to agree that the next move in the cash rate was more likely to be an increase than a decrease, but that there was no strong case for a near-term adjustment in monetary policy. Rather, members assessed that it would be appropriate to hold the cash rate steady and for the Bank to be a source of stability and confidence while this progress unfolds. Members judged that holding the stance of monetary policy unchanged at this meeting would be consistent with sustainable growth in the economy and achieving the inflation target over time.
The Decision
The Board decided to leave the cash rate unchanged at 1.5 per cent.