One In Three Households Have No Mortgage Buffer – RBA

The latest Financial Stability Review from the RBA has a different tone to it, compared with previous edition, because whereas they have previously played up the “cushion” some households have by paying their mortgages ahead, now they say one third of households have no buffer and are exposed to potential interest rate rises. What has changed is not the underlying data, but how it is being presented. Here are some key extracts.

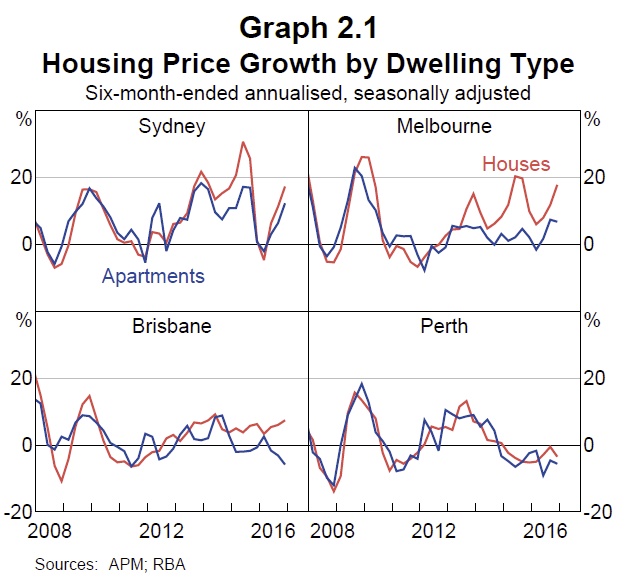
In Australia, vulnerabilities related to household debt and the housing market more generally have increased, though the nature of the risks differs across the country. Household indebtedness has continued to rise and some riskier types of borrowing, such as interest-only lending, remain prevalent. Investor activity and housing price growth have picked up strongly in Sydney and Melbourne. A large pipeline of new supply is weighing on apartment prices and rents in Brisbane, while housing market conditions remain weak in Perth.

Nonetheless, indicators of household financial stress currently remain contained and low interest rates are supporting households’ ability to service their debt and build repayment buffers.

The Council of Financial Regulators (CFR) has been monitoring and evaluating the risks to household balance sheets, focusing in particular on interest-only and high loan-to‑valuation lending, investor credit growth and lending standards. In an environment of heightened risks, the Australian Prudential Regulation Authority (APRA) has recently taken additional supervisory measures to reinforce sound residential mortgage lending practices. The Australian Securities and Investments Commission has also announced further steps to ensure that interest-only loans are appropriate for borrowers’ circumstances and that remediation can be provided to borrowers who suffer financial distress as a consequence of past poor lending practices. The CFR will continue to monitor developments carefully and consider further measures if necessary.

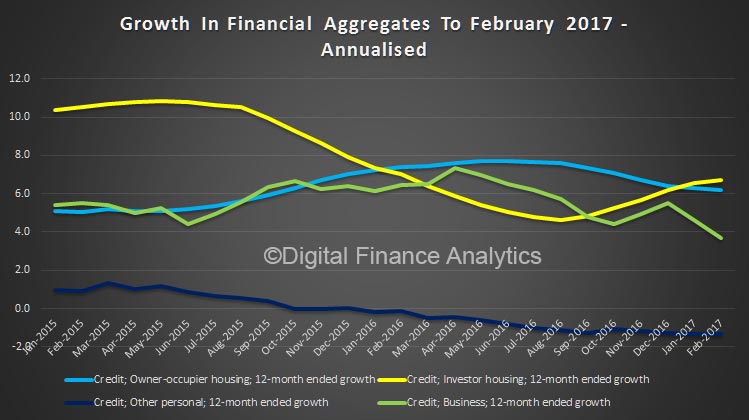
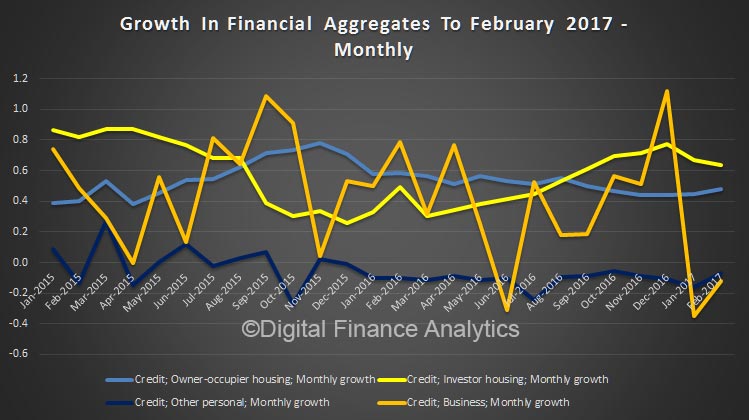
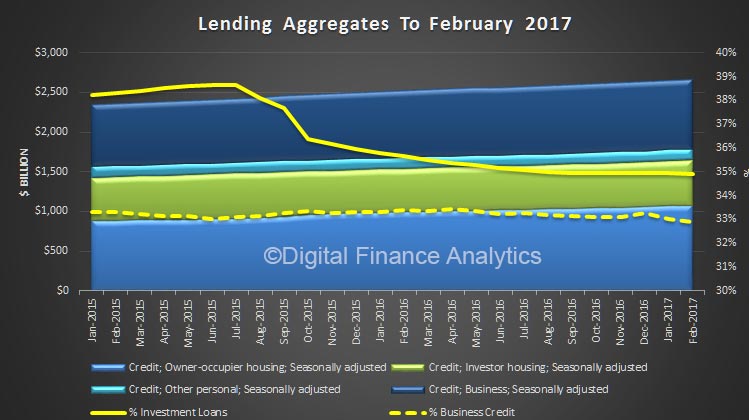
Investor credit has also risen noticeably over the past six months, with investor demand particularly strong in Sydney and Melbourne (Graph 2.3).

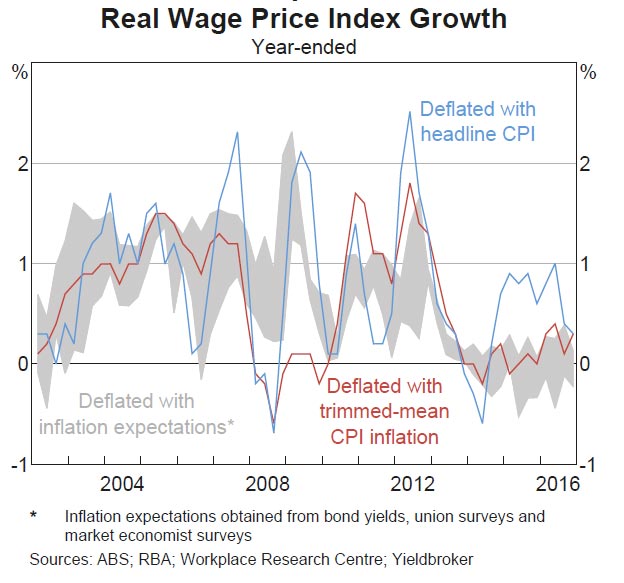
Overall household indebtedness has increased while income growth has remained weak. Some types of higher-risk mortgage lending, such as IO loans, also remain prevalent and have increased of late.

The risks associated with strong investor credit growth and increased household indebtedness are primarily macroeconomic in nature rather than direct risks to the stability of financial institutions. Indeed, some evidence suggests that investor housing debt has historically performed better than owner-occupier housing debt in Australia, though this has not been tested in a severe downturn. Rather, the concern is that investors are likely to contribute to the amplification of the cycles in borrowing and housing prices, generating additional risks to the future health of the economy. Periods of rapidly rising prices can create the expectation of further price rises, drawing more households into the market, increasing the willingness to pay more for a given property, and leading to an overall increase in household indebtedness. While it is not possible to know what level of overall household indebtedness is sustainable, a highly indebted household sector is likely to be more sensitive to declines in income and wealth and may respond by reducing consumption sharply.

A further risk during periods of strong price growth is that it may be accompanied by an increase in construction that could result in a future overhang of supply for some types of properties or in some locations. In this environment, as well as amplifying the upswing for such properties, any subsequent downswing is likely to be larger and more likely to see prices and rents fall if the vacancy rate rises. This poses risks to the whole housing market and household sector, not just to the recent investors.

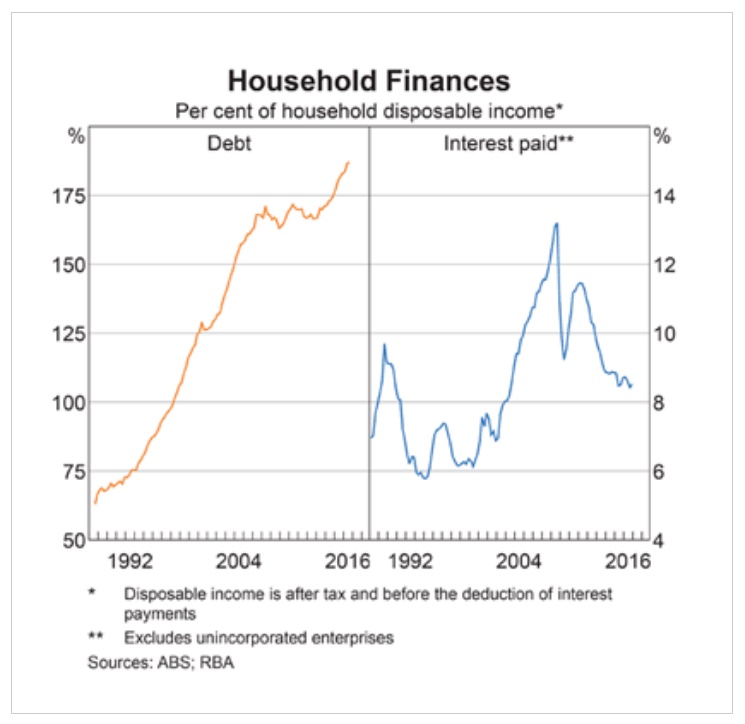
While the financial position of households has been fairly resilient, vulnerabilities persist for some highly indebted households, especially those located in the resource-rich states. Household indebtedness (as measured by the ratio of debt to disposable income) has increased further, primarily due to rising levels of housing debt, although weak income growth is also contributing. Rising indebtedness can make households more vulnerable to potential income declines and higher interest rates. This is of most concern for households that have very high levels of debt.

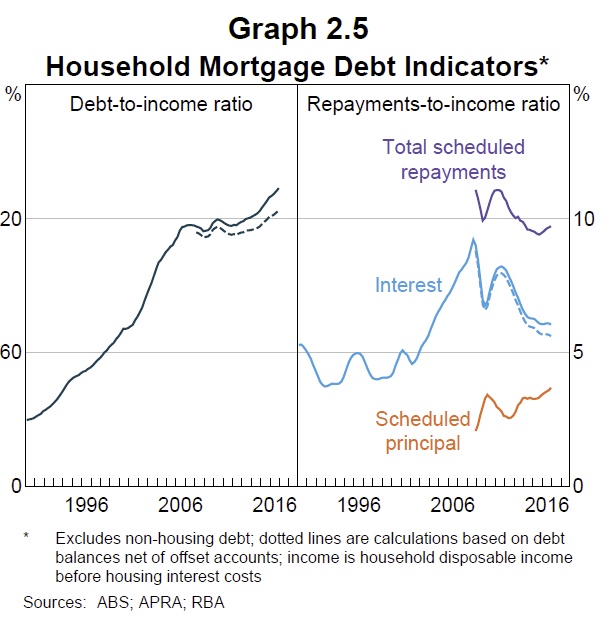
Low interest rates are helping to offset the cost of servicing larger amounts of debt and hence total mortgage servicing costs remain around their recent lows (Graph 2.5). In this regard, lenders have tightened mortgage serviceability assessments in recent years to include larger interest rate buffers, which should provide some protection against the potential effects of higher interest rates.

Prepayments on mortgages increase the resilience of household balance sheets. Aggregate mortgage buffers – balances in offset accounts and redraw facilities – are high, at around 17 per cent of outstanding loan balances or around 2½ years of scheduled repayments at current interest rates. However, these aggregate figures mask significant variation across borrowers, with available data suggesting that around one-third of borrowers have either no accrued buffer or a buffer of less than one month’s repayments. Those with minimal buffers tend to have newer mortgages, or to be lower-income or lower-wealth households.

Interest-only (IO) loans account for a sizeable and growing share of total housing credit in Australia, now representing around 23 per cent of owner‑occupier lending and 64 per cent of investor lending (Graph B1). IO lending has the potential to increase households’ vulnerability in part due to the higher average level of indebtedness over the life of an IO loan compared with a regular principal-and-interest (P&I) loan.

For some time regulators have highlighted the potential risks associated with IO compared with P&I loans. Because IO loans allow borrowers to remain more indebted for longer, there may be greater credit risks associated with such loans. When loan balances stay high, there is an increased risk of borrowers falling into negative equity should housing prices decline.

Another risk is that borrowers may find it difficult to service higher required payments at the end of the IO period, which increases the chance of default. For example, repayments on a $400 000 loan with a 4 per cent interest rate and a five-year IO period would typically increase by around 60 per cent at the end of the IO period. While some borrowers may have planned to refinance into another IO loan at the end of the IO period, this may be difficult if circumstances have changed.

Borrowers who anticipate future price rises can use IO loans to maintain a higher level of leverage for a given servicing payment, thereby magnifying their returns from rising housing prices but also magnifying any losses. More generally, at an aggregate level this behaviour could induce a more pronounced cycle in housing prices than would otherwise occur, amplifying the size of any subsequent downswing in housing prices.

Why The Gap Between Bank Serviceability And Real Life?

Following the recent coverage of our mortgage stress analysis (light it seems is now dawning on regulators, industry commentators and others that household debt is a real and growing issue), one question we get asked is – yes, but surely the banks have guidelines on affordability and serviceability, minimum assumed rate 2%+ above current rates, or 7%+?

So surely, households should have buffers as rates rise?

This is a great question, with a long history attached to it. A couple of years ago the regulators got a shock when them looked at bank practice, and started putting out more specific expectations on lending standards. Back in 2015, Wayne Byres made this point in a speech on lending standards.  At its core was the observation that borrowers appeared to be able to get very different loan amounts from a selection of lenders, using the same base financial profile.

One significant factor behind differences in serviceability assessments, particularly for owner occupiers, was how ADIs measured the borrower’s living expenses (Chart 2a and 2b). As a regulator, it is hard to understand the rationale for large differences in what should be a relatively objective, and extremely critical, metric.4

Chart 2a: Minimum living expense assumptions shows percentage of owner-occupier borrower pre-tax salary income between 20%-35%
Chart 2b: Minimum living expense assumptions shows percentage of investor borrower pre-tax salary income between 0%-25%

Of major concern were a few ADIs who opted to make their credit assessment based on a lower level of living expenses than that declared by the borrower. That is obviously a practice that should not continue, and ADIs should be making reasonable inquiries about a borrower’s living expenses. In fact, best practice (and intuition) would be to apply minimum living expense assumptions that increase with borrower incomes; this was a practice adopted by only a minority of ADIs in our survey.

In 2014, the RBA made this statement in their Financial Stability Report.

Although aggregate bank lending to these higher-risk segments has not increased, it is noteworthy that a number of banks are currently expanding their new housing lending at a relatively fast pace in certain borrower, loan and geographic segments. There are also indications that some lenders are using less conservative serviceability assessments when determining the amount they will lend to selected borrowers. In addition to the general risks associated with rapid loan growth, banks should be mindful that faster-growing loan segments may pose higher risks than average, especially if they are increasing their lending to marginal borrowers or building up concentrated exposures to borrowers posing correlated risks. As noted above, the investor segment is one area where some banks are growing their lending at a relatively strong pace. Even though banks’ lending to investors has historically performed broadly in line with their lending to owner-occupiers, it cannot be assumed that this will always be the case. Furthermore, strong investor lending may contribute to a build-up in risk in banks’ mortgage portfolios by funding additional speculative demand that  increases the chance of a sharp housing market downturn in the future.”

“A build-up in investor activity may also imply a changing risk profile in lenders’ mortgage exposures. Because the tax deductibility of interest expenses on investment property reduces an investor’s incentive to pay down loans more quickly than required, investor housing loans tend to amortise  more slowly than owner-occupier loans. They are also more likely to be taken out on interest-only terms. While these factors increase the chance of investors experiencing negative equity, and thus generating loan losses for lenders if they default, the lower share of investors than owner-occupiers who have high initial loan-to-valuation ratios (LVRs; that is an LVR of 90 per cent or higher) potentially offsets this. Indeed, the performance of investor housing loans has historically been in line with that of owner-occupier housing loans.

The trouble is that the basis on which banks have been assessing available income has been too optimistic. This is because they are based their calculations on historic mortgage book performance, when incomes were rising strongly, and loan losses were very low.

But we are now in a new normal. We have flat incomes. We have rising costs. We have underemployment. We have low growth. But costs of living are rising (and higher for many than the ABS CPI figure would suggest).  Affordability is not what it was. Lenders need to adjust, hard to do when home prices are so high.

Combined, many households are stretched, and the prospect of rising interest rates in these conditions are making things harder.

In addition, households have been willing to gear up with the prospect of future capital growth, so reach for the largest mortgage they can get. Perhaps sometimes they exaggerate their incomes, and understate their costs. This is true we think for households with larger incomes, and lifestyles. Some of these are now under pressure.

So, the root cause of the gap between theoretical affordability and real life is a serious one. Banks often set and forget loans, so do not revisit households finances unless there is a reset or a crisis.  But for many, available incomes are falling (and bracket creep is not helping).  Ongoing financial health-checks might be in order.

ASIC is rightly looking at this issue anew, but we fear the horse may have already bolted. APRA will tighten capital. Both will put upward pressure on mortgage rates, and test affordability further. This is a paradigm shift.

Capital Flows to the Banking Sector

Deputy RBA Governor Guy Debelle, spoke at the Australian Financial Review Banking & Wealth Summit on “Recent Trends in Australian Capital Flows“. He highlights that Australian banks are still reliant on US funding sources, and this includes exposure to US commercial paper.

We therefore highlight that events there will impact banks here, especially changes in market rates (which are likely to be impacted by FED policy as we discussed earlier).

For more than a century, Australia’s high level of investment relative to saving has been supported by capital inflows from the rest of the world. These net capital inflows are the financial counterpart to Australia’s current account deficit. Foreign investment has been instrumental in expanding our domestic productive capacity and has been attracted by the favourable risk-adjusted returns on offer here.

Although net capital inflows have been a consistent feature of Australia’s balance of payments, the composition of both the inflows, as well as the outflows when Australians invest offshore, has varied substantially over time.

When I spoke about capital flows a few years ago, I discussed the significant changes in the composition of capital flows that had taken place since 2007. At that time, I highlighted three noteworthy developments: a marked increase in foreign direct investment in the mining sector associated with the mining investment boom; the significant change in flows to the Australian banking sector from sizeable inflows pre-crisis to around zero; and a substantial increase in foreigners’ purchases of Australian government debt.

Graph 1: Net Capital Inflows


To a large degree, these trends have continued over the past three years. But under the surface, there have been some significant changes in the composition of these flows in recent years.

The aggregate pattern of capital flows to the banking sector has not changed materially since I last spoke on this topic. Since 2014 – and indeed over the period since the financial crisis – there have been minimal net capital flows to or from the banking sector. Following the shift away from offshore wholesale debt towards domestic deposits that took place in the wake of the global financial crisis, the funding composition of banks has remained relatively stable. But notwithstanding this stability, recently there have been two noteworthy developments relating to short-term debt, both stemming from regulatory reforms.

Firstly, over the past year or so, Australian banks have reduced their short-term debt issuance in preparation for the introduction of the Net Stable Funding Ratio (NSFR) next year. The NSFR provides an incentive for banks to shift to sources of funding considered to be more stable and away from sources such as short-term wholesale liabilities.

Graph 3: Net Foreign Purchases of Australian Bank Debt


Secondly, the composition of Australian banks’ short-term offshore funding has also changed following the implementation of US Money Market Fund (MMF) reforms by the Securities and Exchange Commission in October 2016. As a result of these reforms, the value of assets under management of prime MMFs (those that lend to banks) has fallen by US$1 trillion or around 70 per cent over the past couple of years. Some prime funds have switched to become government-only funds, that is, funds that invest only in US government debt. At the same time, investors have allocated away from prime funds to government-only funds. Although prime MMFs have maintained their exposure to Australian banks relative to banks globally (at around 8 per cent of total MMF exposures to banks), their holdings of Australian bank debt have declined from around US$100 billion to under US$30 billion currently.

However, in aggregate, Australian banks have continued to raise almost as much short-term funding from US commercial paper markets, despite the decline in MMFs. They have been able to tap other investors, in particular US corporates with large cash holdings, such as those in the technology sector.

The RBA on Housing and Debt

Remarks at tonights Reserve Bank Board Dinner by Philip Lowe, RBA Governor included the level of household debt and the housing market.

This is something we have been focused on for some time. The level of household debt in Australia is high and it is rising. Over the past year the value of housing-related debt outstanding increased by 6½ per cent. This compares with growth of around 3 per cent in aggregate household income. The result has been a further rise in the ratio of household debt to income, from an already high level.

In aggregate, households are coping reasonably well with the higher debt levels. Arrears rates remain low and many households have built up sizeable buffers in mortgage offset accounts. At the same time, though, slow growth in wages is making it harder for some households to pay down their debt. For many people, the high debt levels and low wage growth are a sobering combination.

In the housing market, conditions continue to vary considerably across the country. The Melbourne and Sydney markets are very strong and prices are increasing briskly. In contrast, conditions are more subdued in most other cities and, in some areas, most notably Perth, prices have declined. Nationally, growth in rents is the lowest for some decades.

So it’s a complex picture and there is not a single story that applies across the country. But, as is often the case in economics, it largely comes down to supply and demand. On the demand side, population growth in Australia – especially in our largest cities – picked up unexpectedly in the mid 2000s and it is only in the past couple of years that the rate of home building has responded. This imbalance was compounded by insufficient investment in the transport infrastructure needed to support our growing population. Nothing increases the supply of well-located land like good transport links. Underinvestment in this area is one of the factors that has pushed housing prices up. Put simply, the supply side simply did not keep pace with the stronger demand side. The result has been higher prices.

Not surprisingly, the rising prices have encouraged people to buy residential property as an investment in the hope of ongoing capital gains. With global interest rates so low, many investors have found it attractive to borrow money to invest in appreciating residential property. This has reinforced the upward pressure on prices.

This configuration of ongoing increases in indebtedness and rising housing prices has been discussed at length by the Council of Financial Regulators. This council, which I chair, brings together the heads of the RBA, APRA, ASIC and the Australian Treasury. The concern has not been that these developments have posed a risk to the stability of our financial system. Our banks are resilient and they are soundly capitalised. Instead, the concern has been that the longer the recent trends continued, the greater the risk to the future health of the Australian economy. Stretched balance sheets make for more volatility when things turn down.

Given this, over the past couple of years there has been a concerted effort by APRA to encourage lenders to strengthen their lending standards. This followed deterioration in these standards a few years ago. Also, at the end of 2014, when growth in investor lending was accelerating, APRA announced that it would pay very close attention to lenders whose investor loan portfolios were growing faster than 10 per cent. It did so with the full support of the RBA. This guidance helped pull the whole system back and has made a positive contribution to overall financial stability. So too has ASIC’s focus on responsible lending. These measures constrained some higher-risk lending and reinforced the message to lenders that they need to take a system-wide focus in their risk assessments.

Notwithstanding this, given recent trends and the heightened risk environment, APRA announced some further measures last Friday. Again, it did this with the full support of the Council of Financial Regulators.

There are two parts of APRA’s announcements that I would like to draw your attention to.

The first is the need for lenders to have a very strong focus on serviceability assessments. Despite the focus on this area over recent times, too many loans are still made where the borrower has the skinniest of income buffers after interest payments. In some cases, lenders are assuming that people can live more frugally than in practice they can, leaving little buffer if things go wrong. So APRA quite rightly has said that lenders can expect a strong supervisory focus on loans with a very low net income surplus.

The second area is interest-only lending. Over the past year, close to 40 per cent of the housing loans made in Australia have not required the scheduled repayment of even one dollar of principal at least in the first years of the life of the loan; only interest payments are required. This is unusual by international standards. In some countries, repayment of at least some principal is required on all housing loans for the entire life of the loan. In other countries, interest-only loans are available only if the borrower has already contributed a fair degree of equity. So this is one area where Australia stands out. We are not unique in this area, but we are unusual.

There are a couple of factors that help explain the popularity of interest-only loans in Australia. One is the flexible nature of Australian mortgages. Many people with interest-only loans make significant payments into offset accounts rather than explicitly paying down principal. This flexibility, which is of value to many people, isn’t available in most countries. A second factor is the taxation arrangements that apply to investment in residential property in Australia.

Last week APRA stated that it expected that new interest-only loans should account for no more than 30 per cent of the flow of new loans. It also stated that institutions should place strict limits on interest-only loans with high loan-to-valuation ratios.

Like the earlier ‘speed limits’ on investor lending, these new requirements should help the whole system pull back to a more sustainable position. A reduced reliance on interest-only loans in Australia would be a positive development and would help improve our resilience. With interest rates so low, now is a good time for us to move in this direction. Hopefully, the changes might encourage a few more people to think about the merit of taking out very large interest-only loans when interest rates are near historical lows.

So the RBA welcomes these latest changes.

It is important, though, that we are all realistic about what these and other prudential measures can achieve. As I said before, the underlying driver in our housing market is the balance between supply and demand. The availability of credit is undoubtedly a factor that can amplify demand, but it is not the root cause. This assessment is consistent with the observation that housing market dynamics currently differ significantly across the country, despite Australia having nationwide financial institutions and the level of interest rates being the same across the country. It is hard to escape the conclusion that we need to address the supply side if we are to avoid ever-rising housing costs relative to our incomes and to avoid the attendant incentive to borrow that is created by rising housing prices.

The various prudential measures do not address the underlying supply-demand issues. But they can reduce the risk from the financial side of the housing market while the underlying issues are addressed. These prudential measures help lessen the amplification of the cycle we get from borrowing and reduce the risk of developments on the financial side weakening the resilience that our economy has exhibited for many years. Ideally, this would be achieved by financial institutions acting themselves, without the need for prudential guidance. But sometimes prudential guidance can help the whole system adjust.

The calibration of this guidance is not precise or straightforward so we need to keep matters under review. The Council of Financial Regulators will continue to assess how the system responds to the various measures so far. It would consider further measures if needed. As I have said, though, in the end addressing the supply side of the housing market is likely to prove a more durable way of dealing with the concerns that people have about debt and housing prices than detailed supervisory guidance.

So that is enough on debt and housing.

RBA Holds Rates (Yes, Again!)

The RBA has left the cash rate unchanged today, as widely expected. There were further references to risks in the housing sector though little indication of whether additional macroprudential measures are likely.

At its meeting today, the Board decided to leave the cash rate unchanged at 1.50 per cent.

Conditions in the global economy have improved over recent months. Both global trade and industrial production have picked up. Labour markets have tightened in many countries. Above-trend growth is expected in a number of advanced economies, although uncertainties remain. In China, growth is being supported by higher spending on infrastructure and property construction. This composition of growth and the rapid increase in borrowing mean that the medium-term risks to Chinese growth remain. The improvement in the global economy has contributed to higher commodity prices, which are providing a significant boost to Australia’s national income.

Headline inflation rates have moved higher in most countries, partly reflecting the higher commodity prices. Core inflation remains low. Long-term bond yields are higher than last year, although in a historical context they remain low. Interest rates have increased in the United States and there is no longer an expectation of additional monetary easing in other major economies. Financial markets have been functioning effectively.

The Australian economy is continuing its transition following the end of the mining investment boom. Recent data are consistent with ongoing moderate growth. Most measures of business confidence are at, or above, average and non-mining business investment has risen over the past year. At the same time, some indicators of conditions in the labour market have softened recently. In particular, the unemployment rate has moved a little higher and employment growth is modest. The various forward-looking indicators still point to continued growth in employment over the period ahead. Wage growth remains slow.

The outlook continues to be supported by the low level of interest rates. Lenders have recently announced increases in mortgage rates, particularly those paid by investors. Financial institutions remain in a good position to lend. The depreciation of the exchange rate since 2013 has also assisted the economy in its transition following the mining investment boom. An appreciating exchange rate would complicate this adjustment.

Inflation remains quite low. Headline inflation is expected to pick up over the course of 2017 to be above 2 per cent. The rise in underlying inflation is expected to be a bit more gradual with growth in labour costs remaining subdued.

Conditions in the housing market continue to vary considerably around the country. In some markets, conditions are strong and prices are rising briskly. In other markets, prices are declining. In the eastern capital cities, a considerable additional supply of apartments is scheduled to come on stream over the next couple of years. Growth in rents is the slowest for two decades.

Growth in household borrowing, largely to purchase housing, continues to outpace growth in household income. By reinforcing strong lending standards, the recently announced supervisory measures should help address the risks associated with high and rising levels of indebtedness. Lenders need to ensure that the serviceability metrics that they use are appropriate for current conditions. A reduced reliance on interest-only housing loans in the Australian market would also be a positive development.

Taking account of the available information, the Board judged that holding the stance of monetary policy unchanged at this meeting would be consistent with sustainable growth in the economy and achieving the inflation target over time.

Housing Credit Climbs In February

The February 2017 data from the RBA today shows that overall credit grew 0.3% in the month, with housing up 0.6% to an annual 6.4% whilst personal credit and business lending both fell.

On a 12 month annualised basis, lending for investment housing grew the fastest at 6.7%, whilst owner occupied lending grew by 6.2% and there was a fall in business lending, down to 3.7%.

The monthly series showed that investor lending grew faster (0.6%) than lending for owner occupation (0.5%). Business lending took a dive and other personal credit was lower.

Turning to the month on month movements, (not RBA adjusted), owner occupied housing grew faster than investment lending.  In the month, owner occupied loans grew $9.3 billion whilst investment loans grew $2.6 billion, seasonally adjusted.

Finally, here is the total value lent by category. Total seasonally adjusted balances for housing was $1.64 trillion, of which investment lending comprised 32.9%, or $575 billion. Lending for owner occupation was $1.071 billion.

Lending for business, as a proportion of all lending fell again.

The RBA notes:

Following the introduction of an interest rate differential between housing loans to investors and owner-occupiers in mid-2015, a number of borrowers have changed the purpose of their existing loan; the net value of switching of loan purpose from investor to owner-occupier is estimated to have been $50 billion over the period of July 2015 to February 2017, of which $1 billion occurred in February 2017. These changes are reflected in the level of owner-occupier and investor credit outstanding. However, growth rates for these series have been adjusted to remove the effect of loan purpose changes.

We will discuss the APRA data which is also out today, in a separate post.  We doubt the changes by APRA announced today will have much impact on the market, although the continuing out of cycle rate hikes by the banks might.

ABC The Business Does Mortgage Rate Rises

A segment from The Business last night which discussed the rising mortgage rate environment.

The big four banks and many of their smaller competitors have raised interest rates in step with each other but out of step with the Reserve Bank. Investors will experience the biggest rises, as banks seemingly heed the warning of regulators to cool the heated property market.

They referred the to Trump effect on funding costs, the differential repricing of investment loans, and suggested that more rises are due, irrespective of what the RBA might do.


RBA Minutes Touch On Property Risks

The RBA minutes, out today, talks to risks in the housing sector.

Recent data continued to suggest that there had been a build-up of risks associated with the housing market. In some markets, conditions had been strong and prices were rising briskly, although in other markets prices were declining. In the eastern capital cities, a considerable additional supply of apartments was scheduled to come on stream over the next few years. Growth in rents had been the slowest for two decades. Borrowing for housing by investors had picked up over recent months and growth in household debt had been faster than that in household income. Supervisory measures had contributed to some strengthening of lending standards.

Dwelling investment had rebounded in the December quarter; much of the strength had been concentrated in New South Wales. Even though building approvals had fallen significantly in recent months, the substantial amount of building work in the pipeline suggested that dwelling investment would continue to contribute to growth in coming quarters. Conditions in established housing markets had continued to differ significantly across the country. Over recent months, conditions appeared to have strengthened in Sydney and had remained strong in Melbourne; these cities had continued to record brisk growth in housing prices, and auction clearance rates had remained high. Housing loan approvals and credit growth had picked up for investors, primarily in New South Wales and Victoria. In contrast, housing prices and rents had fallen in Perth for two years or so, and apartment prices had declined in Brisbane.

Rural exports had grown strongly in the December quarter, reflecting strong farm production following favourable weather conditions in many areas over the second half of 2016. As a result of this and the higher prices for bulk commodity exports, there had been a trade surplus in the December quarter for the first time in almost three years. The current account deficit had narrowed to less than 1 per cent of GDP, the smallest deficit since 1980; the trade surplus was partly offset by a widening in the net income deficit as some of the increase in mining profits had accrued to foreign owners.

Household consumption growth, which had been relatively subdued in mid 2016, picked up in the December quarter, consistent with retail sales. Liaison with retailers suggested that recent trading conditions had been around average and household perceptions of their personal finances had also been around average.

The pick-up in consumption growth stood in contrast to the ongoing weakness in labour incomes, with the household saving ratio declining in the December quarter. Members noted that over the past two decades movements in the Australian household saving ratio had been much larger than those in other similar economies. One contributing factor was likely to have been that Australia had experienced a much larger terms of trade cycle than other developed economies with significant commodity exports. Differences in the evolution of household saving ratios across the states suggested that the terms of trade had played an important role in households’ saving and spending decisions.


Wage Growth Continues To Slow

The latest edition of the RBA Bulletin included a section of wage growth and this chart. Inflation adjusted wage growth is close to zero. Not good for households with large mortgages.  Interestingly they did not separate public and private sector growth, out data suggests public sector employees are doing better than those in the private sector!

The RBA says the job-level micro WPI data provides further insights into the slowing of wage growth in Australia over recent years. Following the
decline in the terms of trade, there has been a reduction in the average size of wage increases.

This has been particularly pronounced in mining and mining-related wage industries. The increasing share of wage outcomes around 2–3 per cent also provides further support for the hypothesis that inflation outcomes and inflation expectations influence wage-setting.

The Bank’s expectation is that wage growth will gradually pick up over the next few years, as the adjustment following the end of the mining boom runs its course. The extent of the recovery will, in large part, depend on how wage growth will respond to improving labour market conditions, including the level of underutilisation.

They observe that wage growth across all pay-setting methods has declined. Wage growth in industries that have a higher prevalence of individual agreements has declined most significantly over recent years,
following strong growth in the previous few years. This may reflect the fact these industries have been influenced by the large terms of trade
movements, but may also indicate that wages set by individual contract can respond most quickly to changes in economic conditions.

Wage growth in industries with a higher share of enterprise bargaining agreements have the lowest wage volatility, as the typical length of an
agreement is around two and a half years. While changes in wage growth and labour market outcomes by pay-setting may reflect differences in wage flexibility or bargaining power, these can be difficult to distinguish from a wide range of other determinants of wages, including variation
in industry performance, the balance of demand and supply for different skills, and productivity.

The share of wage rises between 2–3 per cent has increased to now account for almost half of all wage changes. This may indicate some degree of anchoring to CPI outcomes and/or the Bank’s inflation target. Decisions by the Fair Work Commission, which sets awards and minimum wage outcomes, are heavily influenced by the CPI. A little over 20 per cent of employees have their pay determined directly by awards, and it is estimated pay outcomes for a further 10–15 per cent of employees
(covered by either enterprise agreements or individual contracts) are indirectly influenced by awards.