Interest Rates Should Fall No Further: RBA Shadow Board

The RBA’s decision to cut the cash rate to 2% last month went against the recommendation of the CAMA RBA Shadow Board  according to The Conversation. Since then economic data continues to show signs of weakness. Unemployment is up slightly, investment down, and consumer and business confidence remain fragile.

The international economy continues to pose a threat to the Australian economy and inflation remains comfortably within the RBA’s target band. But asset prices, Sydney house prices in particular, continue to post high gains.

The CAMA RBA Shadow Board on balance prefers to hold firm but believes the cash rate has bottomed and an increase is due in the near future. In particular, the Shadow Board recommends the cash rate be held at its current level of 2%; it attaches a 60% probability to this being the appropriate policy setting. The confidence attached to a required rate cut equals a mere 2%, while the confidence in a required rate hike stands at 38%.

According to the Australian Bureau of Statistics, Australia’s jobless rate edged up to 6.2% in April. Worryingly, in the same month full-time employment, total employment and the participation rate have fallen. Wage growth remains at a record low: the Australian wage price index increased by 2.3% in the last quarter, well below the average of 3.5% for the period 1998-2015.

The Australian dollar remains range-bound between US76¢ and US80¢. Yields on Australian 10-year government bonds have increased further, to 2.84%, from its recent low of 2.59%, implying a steepening of the yield curve, normally a bullish sign.

Regional housing markets, particularly Sydney and Melbourne, and domestic share prices remain buoyant. This remains a primary concern for many Shadow Board members as the asset price increases coincide with an increase in private sector leverage, leading to misallocated investment and opening up the possibility of a costly price correction. According to the Reserve Bank of Australia total housing credit grew by 7.2% (year-ended) in April 2015, compared to 6% in April 2014.

The international economy remains subdued. For Europe, a noticeable pickup in growth is not on the horizon, at least not until the Greek debt crisis is resolved. Recent revisions of US data indicate that US growth this year has been slower than initially thought, with some analysts suggesting the US economy actually contracted in the first quarter. Without a string of good news about the US economy, the Federal Reserve Bank’s increase of the cash rate is likely to be pushed back ever more. Commodity prices are likely to remain soft and possibly fall further.

Consumer and producer confidence measures continue to be mixed. However, of particular concern is the outlook for domestic investment. The ABS survey of chief financial officers conducted in April and May of this year reveals that total capital expenditure is still expected to fall significantly, with the current estimate for fiscal year 2015-16 being 24% less than the corresponding estimate for fiscal year 2014-15. The trend volume estimate for total new capital expenditure fell 2.3% in the March quarter 2015 while the seasonally adjusted estimate fell 4.4%.

What the Shadow Board believes

The Shadow Board’s confidence that the cash rate should remain at its current level of 2% equals 60%. The confidence that a rate cut is appropriate is a mere 2%, whereas the Shadow Board considers it much more likely (38%) that a rate increase, to 2.25% or higher, is the appropriate policy decision for this month.

The probabilities at longer horizons are as follows: six months out, the estimated probability that the cash rate should remain at 2% equals 23%. The estimated need for an interest rate increase lies at 76%, while the need for a rate decrease is estimated at 3%.

A year out, the Shadow Board members’ confidence in a required cash rate increase equals 81%, in a required cash rate decrease 2% and in a required hold of the cash rate 17%.

Total Housing At Record $1.46 Trillion in April

The latest data from the RBA, Credit Aggregates to end April 2015, shows that lending for investment property pushed higher again, whilst lending to business went backwards. Looking at the splits, overall housing credit was up 0.54% seasonally adjusted to $1.46 trillion, with owner occupied lending up 0.41% to $954 billion and investment lending up 0.79% to $503 billion. Personal credit fell 0.84% to $141 billion and lending to business fell 0.04% to $790 billion. As a result, the percentage of lending devoted to housing rose to 61% of total (excluding lending to government), up from 56% in 2010.

RBACreditAggretagesApril2015Tracking the relative monthly movements, highlights the concentration in the housing, and specifically the investment housing sector. We will see if recent moves by APRA and the banks tames the beast in the months ahead.

RBAAggregateMovementApril2015Looking at the housing data, the proportion of the portfolio in the more risky housing investment sector rose again, to 34.6%.

RBAAggregatesApril2015HousingFurther evidence of the unbalanced state of the economy.

Bank Capital And Liquidity

Philip Lowe, RBA Deputy Governor gave a speech entitled “The Transformation in Maturity Transformation“. He provided a useful summary of the current picture of bank funding. Banks capital has been increasing, as part of this global trend to higher and better quality capital, with an increase in common equity lifting the aggregate capital ratio from around 10½ per cent prior to the crisis to around 12½ per cent at end 2014. The recent capital announcements by some of the large banks will see this ratio rise further.

http://www.rba.gov.au/speeches/2015/images/sp-dg-2015-05-27-graph2.gif

In terms of liquidity management he discussed two main initiatives.

The first is the introduction of a Liquidity Coverage Ratio (LCR) which, from the start of this year, has required banks to hold enough high-quality liquid assets to meet a stress scenario that lasts for 30 days. The challenge for the Australian banking system has been that the supply of such assets is limited due to the stock of government bonds on issue being small relative to the overall size of the financial system. To overcome this challenge, the RBA has provided banks with a Committed Liquidity Facility (CLF) under which it will make available sufficient liquidity (against eligible collateral) to address the shortfall in required holdings of high-quality liquid assets. The pricing of the CLF is aimed at replicating the cost of holding a sufficient volume of these assets, were they to be available in the marketplace. APRA administers the decisions as to which banks access the program, and the maximum amount available to each bank.

The second initiative is the Net Stable Funding Ratio (NSFR), which has a longer-term focus. It will establish a minimum amount of stable funding based on the liquidity characteristics of an institution’s assets and activities over a one-year horizon. The new requirement here will not come into effect until January 2018.

This increased focus on liquidity is clearly evident in the balance sheets of the Australian banks. On the assets side, holdings of liquid assets have increased substantially, after they declined for many years. Australian dollar denominated liquid assets are now equivalent to about 7 per cent of banks’ total assets, up from around 1 per cent in early 2008. If the CLF is added in, the current figure is around 15 per cent.

http://www.rba.gov.au/speeches/2015/images/sp-dg-2015-05-27-graph3.gif

There have also been significant changes on the liabilities side of the balance sheet.  The most noticeable has been a shift away from short-term wholesale debt towards deposits. In early 2008, deposits accounted for around 40 per cent of the Australian banks’ total funding. Today, that figure is just a little below 60 per cent. In part, this switch has been driven by the judgement that the risk of a run by depositors is less than the risk of a run by investors in short-term wholesale debt. To the extent that this judgement is correct, this switch has increased the effective maturity of banks’ liabilities in a stress event, even if it has not increased the contractual maturity.

http://www.rba.gov.au/speeches/2015/images/sp-dg-2015-05-27-graph4.gif

There has also been some lengthening in the average contractual maturity of the various types of liabilities. The share of deposits at the major banks with a maturity of less than three months has declined since 2007, although this share has increased a little more recently as competition for term deposits has waned. Similarly, there has been a noticeable increase in the maturity of banks’ other debt liabilities since 2007. Of particular note, the share of other debt liabilities with maturities of less than three months has declined substantially.

http://www.rba.gov.au/speeches/2015/images/sp-dg-2015-05-27-graph5.gif

He made that point that taken as a whole, these measures have made the system more resilient. But they have increased the cost of financial intermediation somewhat. They have also increased the likelihood that such intermediation will take place outside the banking sector. After all, to some extent this is what was intended. So we need to keep a close eye on how the overall system responds and make sure that in addressing the very real risks associated with maturity transformation, that we don’t create a new set of risks. This is likely to be an ongoing challenge for us all.

It is also important to point out that while the various measures have made the system more resilient, they do not guarantee stability.  Because of the very nature of the business that banks undertake, they can still find themselves in a liquidity crisis. Here the role of the central bank acting as a lender of last resort is critically important.

Card Payments Regulation

A speech was delivered today by Malcolm Edey, at the Cards & Payments Conference in Melbourne following on from the Murray Inquiry and the Reserve Bank Payments System Board (the PSB) own review following on from the Murray recommendations. As the PSB’s review process is still underway, Edey did not pre-empt any conclusions that might come from that. Instead he over viewed the PSB’s general approach to retail payments since it first entered the field. His comments on more recent developments does give some clues to issues ahead however, with specific reference to NPP, interchange arrangements and surcharging.

The PSB more recently undertook its Strategic Review of Innovation in the Payments System, the results of which were published in 2012. That review was conducted over a two year period and involved extensive consultations with both the payments industry and with users of payments services. It found a number of areas where there was scope for system improvements that could be achieved through coordinated action.

The key areas were:

  • same-day settlement of direct entry transactions;
  • faster payments and out-of-hours payments to be made generally available;
  • capacity for richer information with payments; and
  • an easy addressing solution for electronic payments.

The first one of these was delivered at the end of 2013 and essentially involved an acceleration of existing direct entry processes. The remaining three form a more ambitious agenda and are together being taken up as part of the industry’s New Payments Platform (the NPP project).

The NPP is a successful example of what can be done through collaboration between the industry and its regulator. It is also a good example of the catalyst role for the PSB in promoting system innovation that was envisaged by Wallis. While it is an industry-led project, it is strongly supported by the PSB, and the Board continues to encourage commitment to the project and to its timely completion.

The project was launched in early 2013 and is now well advanced. On current scheduling the NPP will deliver a fast payments service with rich information and addressing capabilities in the second half of 2017. It will be linked to a fast settlement service provided by the Reserve Bank, which will allow transactions to be cleared and settled 24/7 in close to real time. All of this will amount to a world-class payments infrastructure.

It will also be a platform for further innovation. One of the key decisions made at an early stage of the project was to separate the basic clearing and settlement infrastructure from the commercially based overlay services that would use it. The industry is committed to an initial overlay that is intended to provide an attractive service and drive early volume growth. But it is important to note that access to the overlay space has always been intended to be open and competitive. Over time, this structure will allow new and specialist providers to make use of the rich capabilities provided by the core infrastructure.

Before moving on to some more detailed regulatory matters, I will mention one more initiative to have come out the 2012 Strategic Review, and that is the establishment of new industry coordination and consultation arrangements. In line with a recommendation from the 2012 Review, a new industry coordination body, the Australian Payments Council, was launched last year. The Council is a high-level body representing a diverse range of industry participants including banks, payment schemes and other service providers. It will have the capacity to give strategic direction to the industry as well as engaging in dialogue with the PSB. At the same time, it is important that the policy process engages with users and not just suppliers of payment services. To facilitate that, the Reserve Bank has also set up a Payments User Consultation Group which began meeting late last year.

In summary then, the policy work of the PSB has been very much consistent with the philosophy and objectives of the original Wallis reforms. A good deal of that work has been what might be termed ‘co-regulatory’ in nature, in the sense that it involved promoting industry-led solutions rather than using formal regulatory powers.

But of course the PSB does have a regulatory mandate, and it has used its powers to regulate a number of aspects of card payments where it judged that there was a public interest case to do so. Probably the aspects of this regulation that have attracted the most attention have been those related to interchange and surcharging, and I would like to make some general comments about each of these.

First, interchange. The commercial function of interchange fees is a very interesting one. They serve as a device for shifting the benefit-cost balance between issuers and acquirers in a four-party scheme and therefore, indirectly, between cardholders and merchants. Payment schemes argue that this can be an important competitive device that can promote innovation, for example by being structured to encourage network growth or the take-up of new products. Typically, interchange flows from the acquirer to the issuer, and hence the fee structure tends to encourage issuance and use of a card, but may discourage acceptance by merchants if the fee is too high. For mature schemes, however, the capacity of merchants to refuse acceptance may be quite limited. As a result, it has been frequently observed that competition between schemes can have the effect of pushing fees up rather than down, in order to maximise incentives to issuers and cardholders.

The reason that this kind of outcome is possible is that there is a misalignment between the incidence of these fees and the structure of decision-making power in a typical transaction. In a nutshell, the cardholder chooses the payment instrument but the merchant pays the fee.

In designing its card payment reforms, both for credit and debit, the PSB concluded that competition of this nature was distorting price signals in a way that inefficiently encouraged the use of high cost cards and added to merchant costs. Hence, it judged that there was a case for interchange fees to be capped by regulation. A number of other jurisdictions have since taken a similar view.

The second aspect that I want to talk about is surcharging. The PSB has consistently taken the view that merchants should not be prevented from surcharging for higher-cost payment methods. Scheme rules that prohibited surcharging had the effect of reinforcing the distortive effects of interchange fees by preventing costs from being passed on to cardholders. They also reduced the flexibility of merchants in deciding how to respond to high-cost payment instruments. The ability to surcharge improves merchants’ bargaining position by allowing them a greater range of responses, rather than just being faced with a binary decision to accept or reject a particular card.

Efficient surcharging should of course reflect the underlying payment cost. The PSB’s initial reforms to credit and debit gave merchants the right to surcharge, while effectively relying on competition to ensure that surcharging would not be excessive. This regulation was revised in 2013 in response to concerns about practices that had developed since the initial reforms, particularly about surcharging that appeared excessive or unrelated to costs. The amended regulation still prevents schemes from imposing no-surcharge rules, but it allows them to limit surcharging to the reasonable cost of acceptance. In doing so it strikes a balance, at least in principle, between the rights of merchants and schemes. Merchants cannot be prevented from recovering reasonable acceptance costs, but they can be prevented by scheme rules from going beyond that. More on that in a moment.

The PSB’s reforms to surcharging and interchange have formed part of a broader package that also included rules relating to access and transparency. I don’t have time to cover all of that today. But taken together, the effects have been beneficial. The system has continued to innovate, and merchants’ card payment costs have fallen.[3] It is also notable that these costs are significantly lower in Australia than in a jurisdiction like the United States, where reforms to card systems have been much more limited.

The Murray Report last year broadly endorsed the PSB’s reform approach while flagging a number of areas for further consideration, particularly in relation to surcharging and interchange. These have now been taken up as part of the PSB’s card payments review.

The issue of surcharging remains contentious. Instances of apparently excessive surcharging have persisted. While they acknowledge arguments for what might be called a ‘no excessive surcharge’ regime, the schemes have argued that the current formulation is too complicated and difficult for them to enforce.

The card payments review is looking at several possible mechanisms for addressing this. One option proposed by Murray is a tiered approach that would allow tougher surcharging constraints to be placed on low-cost cards. A number of other options are available to strengthen enforcement and disclosure practices, for example allowing schemes to cap surcharges that are not percentage based at some low fixed amount.

On interchange fee regulation there are a number of issues to consider. These include the overall level of the interchange cap, the complexity and proliferation of interchange categories, the phenomenon of interchange ‘drift’ with the three-year compliance cycle, and the wide disparity between interchange rates for preferred merchants and those applying to others.

While it broadly endorsed the PSB’s regulatory approach to date, the Murray Report recommended that consideration be given to tightening existing interchange regulations in some significant respects. These included lowering the overall interchange cap, and broadening its coverage to include other incentive payments that serve a similar function. It argued that this would help to prevent circumvention and, in the case of companion card arrangements, would improve competitive neutrality.

Latest RBA Minutes Deliberately Gives No Forward Indication

The RBA released their board minutes from the Monetary Policy Meeting held earlier in May. They continue to balance generally weaker indicators with the risks of stoking the housing market in Sydney and Melbourne with a rate cut. They also agreed that, as at the time of the reduction in the cash rate in February, the statement communicating the decision would not contain any guidance on the future path of monetary policy.

International Economic Conditions

Members noted that growth of Australia’s major trading partners had eased a little in the early months of 2015, but was forecast to remain close to its long-run average in 2015 and 2016. Minor revisions to the outlook largely reflected weaker growth in China in the March quarter, which had also been reflected in lower bulk commodity prices and hence a slightly lower terms of trade than previously forecast by staff. Monetary conditions remained very accommodative across the globe and low oil prices were also supporting growth of Australia’s trading partners. Core inflation rates were below central banks’ targets in many economies.

Economic growth in China had eased further in the March quarter across a broad range of indicators. The Chinese property market had continued to be a source of weakness in the economy and represented a key source of uncertainty for the outlook, both through the effects on demand for industrial products and on the finances of local governments that relied on land sales to fund infrastructure projects. Members noted that residential property prices had continued to fall, albeit at a more gradual pace, and sales were lower than in the previous year. Chinese demand for steel had eased and had been accompanied by a fall in Chinese iron ore production and relatively flat imports of iron ore, although Australian iron ore exports to China continued to grow. Members noted that the authorities had introduced several measures to address the overhang of housing supply, while the People’s Bank of China (PBC) had lowered the reserve requirement ratio for banks.

Although the prices of iron ore, thermal coal and oil prices had rebounded somewhat from recent lows, members observed that the slowing in the growth of Chinese demand for steel had contributed to declines in the prices of bulk commodities since the start of 2015. As a result, the terms of trade had declined and were expected to continue doing so as lower spot prices gradually fed their way into contract prices for commodities, including liquefied natural gas (LNG). Notwithstanding this, members noted that the forecast terms of trade were considerably higher than they had been prior to the mid 2000s.

Growth in the US economy had moderated in the March quarter, largely reflecting the temporary effects of disruptions related to severe weather and industrial action in West Coast ports. Over the same period, conditions in the labour market had continued to improve. Non-farm payrolls employment had continued to grow strongly over the past six months and the unemployment rate had declined further. The Federal Open Market Committee (FOMC) had indicated that it was likely to begin the process of normalising interest rates in the second half of the year as long as economic conditions continued to evolve as expected.

Growth in the Japanese economy looked to have been modest in the March quarter and there were signs that tight labour market conditions were generating stronger wage growth. In the rest of east Asia, growth of both exports and domestic activity appeared to have slowed a little in the March quarter. Economic activity in the euro area had continued to recover gradually over past few months.

Domestic Economic Conditions

Members observed that the forces underpinning developments in the domestic economy were much as they had been for some time. The available data suggested that growth in the domestic economy had continued at a pace a bit below average in the March quarter. Members noted that growth was expected to continue at a similar pace over the coming year before picking up gradually to an above-average pace over the course of 2016/17.

Household consumption growth had picked up late in 2014 and recent indicators were consistent with expectations that consumption would continue to rise gradually, supported by very low interest rates, relatively strong population growth and a gradual decline in the saving ratio. Members noted that if households respond to very low interest rates and higher asset prices to a similar degree as they had in the period prior to the global financial crisis, expected outcomes would include a lower saving ratio and higher consumption growth than embodied in the forecasts. Alternatively, if households were less inclined to bring forward their consumption than had been factored into the forecasts, perhaps to limit the increase in their leverage, consumption growth would be likely to be weaker and the saving ratio higher than forecast.

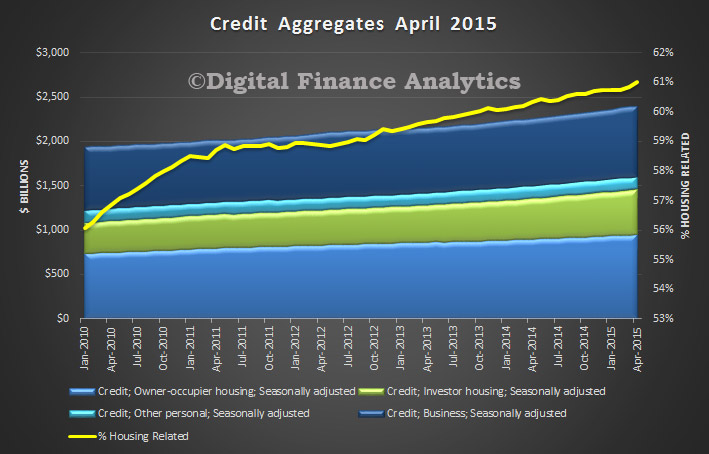
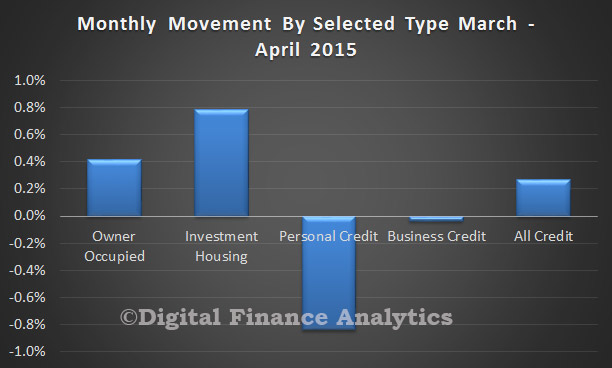
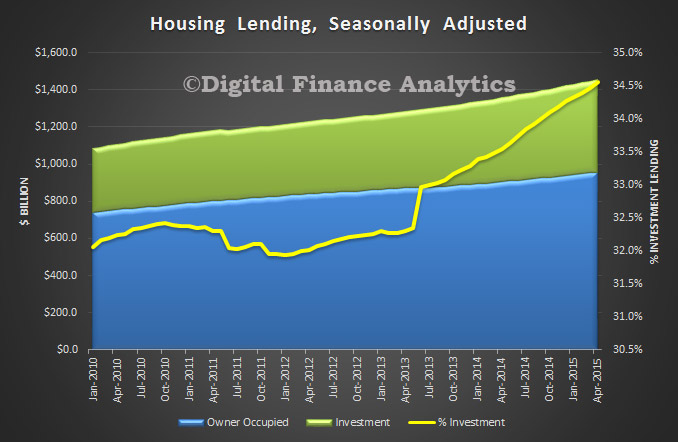
Conditions in the established housing market had remained strong in Sydney and Melbourne. However, across the rest of the country, which accounts for around 60 per cent of Australia’s dwelling stock, housing price growth had declined. The available data suggested that dwelling investment had grown strongly in the March quarter, supported by low interest rates and above-average population growth. Forward-looking indicators, including residential building and loan approvals, suggested that dwelling investment would continue to grow strongly in the next few quarters. Members noted that growth of housing credit for both owner-occupiers and investors had remained relatively stable in recent months, with overall credit growth broadly in line with longer-term income growth.

Survey data had suggested that business conditions in the non-mining sector were around average and that business credit had picked up of late. However, forward-looking measures of business confidence had remained a little below average and non-residential building approvals had also been running at a relatively low level. Members noted that non-mining business investment was expected to recover later than had been thought at the time the forecasts for the February Statement on Monetary Policy had been prepared. This reassessment was consistent with the weak reading on investment intentions for 2015/16 from the December quarter ABS capital expenditure survey as well as business liaison by the Bank, which had suggested for some time that businesses would commit to increasing investment only after observing a durable improvement in the growth of demand. Members noted that exchange rate developments were also likely to remain important for investment decisions. Uncertainty about both the timing and speed of the recovery in non-mining business investment remained key risks to the forecasts. Mining investment was still expected to decline sharply, but the speed of that decline continued to be uncertain.

Resource export volumes had grown strongly in the March quarter, in part reflecting the absence of substantial weather-related disruptions across the country. Resource exports were expected to continue making a strong contribution to growth as new production, particularly of LNG, came on line over 2015. Members noted that the capacity to maintain production plans in the face of lower commodity prices had been enhanced by further cost-cutting by producers, and that this had been assisted by the decline in the price of oil (an input into production) over the past year.

Fiscal consolidation by the federal and state governments was expected to contribute to subdued growth of domestic demand over the forecast period. Members noted that the Commonwealth Budget, which would be announced the following week, would provide important information for updating these forecasts.

The most recent labour force data indicated that employment growth had been increasing over the past six months or more, to be a little above the rate of population growth. Members noted that the revised labour force data also indicated that the unemployment rate had been stable through most of this period at about 6¼ per cent, and observed that the extended period of slow wage growth may help to reconcile these data with the below-trend growth in the economy over 2014. Forward-looking indicators of labour demand had continued to point to modest growth of employment over coming months.

Members noted that the delayed pick-up in GDP growth in the revised outlook meant that the unemployment rate was forecast to rise further, before starting to decline gradually towards the end of the forecast period. Wage growth was not expected to increase from current low levels for some time. Members discussed the possibility that employment growth could grow fast enough such that the unemployment rate did not increase, especially if there was ongoing moderation in wage growth.

Inflation in the March quarter had been broadly as expected. CPI inflation had slowed over the past year, reflecting the large falls in fuel prices and repeal of the carbon price. Underlying inflation had remained around ½–¾ per cent in the quarter and 2¼–2½ per cent over the past year. Domestic inflationary pressures – as indicated by non-tradables inflation – had remained below average, consistent with the extended period of slower wage growth. Inflation in consumer prices related to housing was marginally above its historical average, driven by inflation in new dwelling costs reflecting the strength of the housing market. Tradables inflation (excluding volatile items and tobacco) had picked up in response to the depreciation of the Australian dollar over the past year or so.

Members noted that the inflation forecast had been revised down slightly since February, reflecting the expectation that growth of economic activity would remain below trend for a little longer than previously forecast. Domestic labour cost pressures were expected to remain well contained and underlying inflation was expected to remain consistent with the inflation target over the forecast period. Headline inflation was forecast to remain below 2 per cent in year-ended terms through to mid 2015, before picking up to be consistent with the inflation target thereafter.

Financial Markets

The Board’s discussion of financial markets commenced with the unusual trading in the Australian dollar in the period immediately prior to the announcement of the Board’s decisions in February, March and April. Members were briefed on the Australian Securities and Investment Commission’s preliminary finding, which had been announced the previous day, that each of those moves in the Australian dollar had been a result of ‘normal market operations in an environment of lower liquidity immediately ahead of the RBA announcement’.

Members observed that financial markets continued to focus on the situation in Greece and monetary policy developments in the major economies.

Negotiations between the Greek Government and its official sector creditors remained at an impasse. Greece appeared to have sufficient funds to meet its scheduled payments in May only after the introduction of further stopgap measures. The next Eurogroup meeting was scheduled for 11 May and at least partial agreement would be needed on Greece’s reform agenda before further assistance funds were released. Overall, Greek banks’ reliance on emergency liquidity assistance had increased significantly recently and total Eurosystem lending to Greek banks now exceeded one-quarter of their total liabilities.

Members noted that the apparent deadlock in Greece had had little impact on broader financial markets until recently, when spreads on the debt of other euro area periphery countries – including Portugal and Spain – had increased as concerns surrounding Greek finances continued to rise.

In contrast, yields on German and other highly rated European sovereign debt fell to new lows in April following the continued expansion of the European Central Bank’s balance sheet, with the 10-year Bund yield declining to 8 basis points. In recent days, however, there had been a marked retracement, with 10 year yields rising by more than 30 basis points in Germany and the United States.

In the United States, market pricing continued to suggest that the first increase in the US policy rate could be closer to the end of the year, and the subsequent pace of policy tightening could be slower than that envisaged by members of the FOMC as published in mid March.

In China, the PBC had taken steps to boost liquidity by reducing the reserve requirement ratio. This step had partly sought to offset the reduction in liquidity resulting from sales of foreign reserves by the PBC in recent months. Equity prices had continued to record particularly large rises in mainland China, leading to prices more than doubling since mid 2014. Members noted that the rally in the Chinese share market had coincided with rapid growth in retail financial investments funded by debt, which raised concerns about the sustainability of the rise in share prices and the potential effects of any decline.

The appreciation of the US dollar since mid 2014 had continued its modest reversal over the past month, resulting in a depreciation of the US dollar against most currencies. Reflecting that, together with recent domestic data, the Australian dollar had appreciated by 3 per cent against the US dollar and by 2½ per cent on a trade-weighted basis over the past month. Nevertheless, compared with its level in mid 2014, the Australian dollar remained around 17 per cent lower against the US dollar and around 10 per cent lower on a trade-weighted basis. In contrast, the Chinese renminbi had been little changed against the US dollar over the past month and in trade-weighted terms remained around 12 per cent above its level in mid 2014.

Members noted that equity prices in the major developed economy markets had risen during April, with the exception of Europe, where equity prices fell a little after large rises earlier in the year. In Australia, equity prices also recorded a small decline in April, although the resources sector had outperformed, with energy sector share prices rising following an increase in the oil price.

Corporate bond issuance by Australian entities remained robust in both domestic and international markets amid favourable pricing conditions. In the money market, pricing on money market instruments pointed to around an 80 per cent chance of a reduction in the cash rate target at the present meeting.

Considerations for Monetary Policy

Members assessed that the outlook for global economic growth had been revised only marginally lower in the near term and would continue to be supported by stimulatory monetary policies and the low price of oil. They noted that growth appeared to have slowed in China and that the weakness in the Chinese property market continued to represent a significant risk both for Chinese growth and demand for construction-related commodities. Lower growth in the demand for commodities had contributed to the lower prices of Australia’s key commodity exports since the beginning of the year. As a result, Australia’s terms of trade were expected to decline a little more than was forecast three months ago.

In their discussion of the appropriate course for monetary policy, members noted the revised staff forecasts for the domestic economy. Although the recent flow of data had been generally positive, there had also been indications that future capital spending in both the mining and non-mining sectors would be weaker than expected. Overall, compared with the previous set of forecasts, growth was now expected to take longer to strengthen and the unemployment rate was likely to remain elevated for longer. This change, and generally subdued growth of domestic costs, including wages, implied that inflation was expected to be slightly lower than in earlier forecasts though still consistent with the target. On the face of it, this meant that it would be appropriate to consider an easing of monetary policy.

Members also discussed the potential risk that low levels of interest rates could foster imbalances in the housing market. While concerned about the very strong pace of growth of housing prices in Sydney, and observing that conditions in Melbourne were strong, members saw much more muted trends in other capital cities. As at previous meetings, they acknowledged the risks that could accompany a sustained increase in leverage from already high levels, should that occur, and that the expansionary effects of lower interest rates could be less than in the past. On the data available for this meeting, however, it did not appear that the growth of housing credit, either for investment or owner-occupancy purposes, had been increasing over recent months. The Bank would continue to work with other regulators to assess and contain the risks arising from the housing market.

More broadly, members noted that the low levels of interest rates were helping to support demand in the face of a number of persistent headwinds and that a further reduction in the cash rate would provide some additional support to economic activity by reinforcing recent encouraging trends in household demand. In turn, this would support non-mining business investment insofar as demand conditions were the main factor constraining these decisions. Such outcomes would be expected ultimately to lead to stronger labour market conditions. Members also noted that further depreciation of the exchange rate seemed to be both likely and necessary, particularly given the significant declines in key commodity prices, and that such an outcome would help to achieve more balanced growth in the economy and assist with the transition to a lower terms of trade.

Members discussed the timing of any interest rate adjustment. They could see cases both for moving at this meeting or at the subsequent meeting. The latter course would bring the advantage of additional information on the economy, including details of the forthcoming Commonwealth Budget. On the other hand, with the revised staff forecasts scheduled to be released a few days after the meeting, members acknowledged that the challenges of communication might be more effectively met with a reduction in the cash rate at this meeting.

On balance, taking all these factors into account, the Board decided that the best course was to ease monetary policy further at this meeting. Members agreed that, as at the time of the reduction in the cash rate in February, the statement communicating the decision would not contain any guidance on the future path of monetary policy. Members did not see this as limiting the Board’s scope for any action that might be appropriate at future meetings.

The Decision

The Board decided to lower the cash rate by 25 basis points to 2.0 per cent, effective 6 May.

Managing Two Transitions

Philip Lowe, RBA Deputy Governor spoke at the Corporate Finance Forum and spoke about two transitions.

The first is a domestic one – that is, the transition in the Australian economy following a period of extraordinarily strong growth in investment in the resources sector combined with record high commodity prices.

The second is a much more international one – and that is what seems to be a transition to a world in which global interest rates are lower, at least for an extended period, than we had previously become used to.

He explored the impact of low rates:

The first is the challenge that low interest rates pose to anyone who is seeking to fund future liabilities. Low interest rates mean that the present discounted value of these liabilities is higher than it once was. In turn, this means that more assets are needed to cover these liabilities. For anyone managing a long-tail insurance business or a defined benefit pension scheme, this is a major challenge. It is also a challenge for retirees and those planning for retirement.

The second issue is the effect of low interest rates on asset prices. Just as low interest rates increase the value of future liabilities, they increase the value of a given stream of future revenue from any asset. The result is higher asset prices. Another way of looking at this is that faced with low returns on risk-free assets, investors have sought other assets, and in so doing they have pushed up the prices of these assets. A good example of this is commercial property, where investors have been attracted by the relatively high yields, pushing prices up even though rents are declining.

Graph 10: Prime office capital values and rents
A rise in asset prices is, of course, part of the monetary transmission mechanism. But developments here need to be watched very carefully. History is littered with examples of unsustainable asset price rises emerging on the back of perfectly justifiable increases in prices. In a number of cases, this has ended badly, especially if there is leverage involved. Also, we should not lose sight of the fact that interest rates and the returns generated from assets are ultimately linked to one another. So, interest rates may be structurally lower in part because the stream of future income generated from assets is also lower than in the past. This would have obvious implications for the sustainable level of many asset prices.

The third issue is the effect of low interest rates on firms’ investment decisions and hurdle rates of return. In today’s environment, it seems that many investors have, reluctantly, come to accept that they will earn lower yields on their existing assets. An open question though is whether the same acceptance of lower returns is flowing through to firms’ decisions about the creation of new assets – that is, their own investment plans.

The international evidence is that the hurdle rates of return that firms use for new investment are quite sticky and that they are not very responsive to movements in interest rates. There is less evidence of this issue in Australia, but a recent survey of CFOs by Deloitte hints at the same conclusion. The survey results suggest that hurdle rates of return on new investment are typically above 10 per cent and sometimes considerably so. The results also suggest that the average margin between the hurdle rate of return and the weighted-average cost of capital is about 3 percentage points. As part of the survey, firms were also asked how often they changed the hurdle rate, with the most frequent answer being ‘very rarely’. These findings are very similar to those reached through the Bank’s own extensive business liaison program.

Graph 11: Hurdle rates


Credit Losses At Australian Banks Are All About Lending Standards – RBA

A very timely paper from David Rodgers at the Economic Research Department RBA. An analysis of credit losses in the banking system highlights the importance of lending standards, and that although up to now higher risks lay in the business sector, lending standards in the household sector, especially with the concentration on housing lending,  are critically important (and we would add in the light of current household debt ratios, see the earlier post). A rise in unemployment on par with that in the early 1990s could be expected to have a more severe influence on household credit losses, given the large rise in household indebtedness over the intervening period. A corollary of this rise in household indebtedness is the greater share of banks’ lending now made up by housing and personal lending. These considerations suggest that any weakening in lending standards in these areas could have a larger systemic impact than in the past.

Credit risk – the risk that borrowers will not repay their loans – is one of the main risks that financial intermediaries (such as banks) face. Credit risk has been the underlying driver of most systemic banking crises in advanced economies over recent decades. As credit risk materialises and borrowers fail to make repayments, banks are forced to recognise the reduction in current and future cash inflows this represents. These ‘credit losses’ reduce a bank’s profitability and can affect capital. In extreme cases, credit losses can be large enough to reduce a bank’s capital ratio below regulatory requirements or minimum levels at which other private sector entities are willing to deal with a bank, so can cause banks to fail.

This paper explores the historical credit loss experience of the Australian banking system. It does so using a newly compiled dataset covering the bank-level credit losses of larger Australian banks over 1980 to 2013. Portfolio-level credit loss data – data that break losses down by type of lending (e.g. business, housing and personal lending) – are available for a broad range of banks only from 2008 onwards, so this paper mainly uses total loan portfolio data. This paper provides the first narrative account of banking system credit losses in Australia that includes both the early 1990s and global financial crisis episodes.

Credit losses in Australian banking in the post-deregulation period have been concentrated in two episodes: the very large losses around the early 1990s recession and the smaller losses during and after the global financial crisis. They have a close temporal relationship with the economic cycle, peaking close to troughs in GDP during downturns. A narrative account attributes the key roles indriving credit losses to business sector conditions such as business indebtedness and commercial property prices. The available data on portfolio-level losses indicate that elevated losses during these downturns stemmed from banks’ lending to businesses, rather than their lending to households. Data available from 2008 onwards indicate losses on housing loans barely rose (from very low levels) during the global financial crisis, even though housing prices and employment fell noticeably in some geographical areas.One of the main contributions of this paper is an econometric panel-data model that properly controls for bank-level portfolio composition. This model indicates business sector conditions, rather than household sector conditions, have been the driver of domestic credit losses over the period studied. The relevant business sector conditions – interest burden, profitability and commercial property prices – are indicators of the ability of this sector to service its debts and of the value of the collateral behind these debts. As a corollary, the model indicates that most losses over the past three decades were incurred on banks’ business lending, and household losses were largely unresponsive to economic conditions in that period. Unlike past work, these results are consistent with the narrative account of credit losses in Australian banking.

Descriptive accounts attribute the scale of losses during the early 1990s to poor lending standards, and the data support this. One piece of evidence, based on quantile regressions, indicates that changes in macro-level conditions have had very different impacts upon banks with similar portfolios (in terms of the shares of business, housing and personal lending). Most compellingly, standard models cannot explain the extremely high credit losses experienced at some state government-owned banks in the early 1990s. Given the anecdotal evidence that these banks had below-average lending standards, this is consistent with the conclusion that poor lending standards have caused the very worst credit loss outcomes over recent decades.

These conclusions have practical implications for stress testing. The credit loss models in this paper that use least squares estimation, and include bank-level variables, are unable to explain, and so unlikely to predict, the very worst credit loss outcomes. Many stress-testing exercises use similar (and in some cases simpler) econometric models (see, for example, IMF (2012)). As the worst credit loss outcomes are the most relevant when stress testing, this suggests that alternative models are needed. Covas, Rump and Zakrajsek (2013) show that a type of quantile regression (quite different to that in this paper) can provide out-of sample forecasts that encompass the credit losses experienced by the US banking system during the global financial crisis. In an Australian context, Durrani, Peat and Arnold (2014) show that allowing variation in credit risk outcomes across banks, rather than applying the same average risk parameters to all banks, can lead to significantly larger loss estimates. Stress-testing models could also be improved by incorporating better data on lending standards. The Federal Reserve collects and makes use of loan-level data on borrower characteristics in its annual stress tests of the largest US banks (Board of Governors 2014). This captures some aspects of the risk profile of borrowers; more work is probably needed to make it possible to systemise and accurately record banks’ lending standards.

The historical experience of credit losses at Australian banks this paper describes should help to guide overall understanding of the credit risk they currently face. It supports a continued focus on the analysis of the financial health of the business sector (one output of this work is a chapter of the Reserve Bank’s semiannual Financial Stability Review). As another example, credit loss measures appear to peak before asset performance measures, potentially providing an early signal of future improvement in financial system stability.

The lack of a historical relationship between household sector conditions and credit losses should be used cautiously in contemporary debates on the riskiness of housing lending. It indicates that the macroeconomic shocks experienced by the household sector during the past three decades have been small relative to the lending standards in place for housing lending over this period. Future macroeconomic shocks may, however, have a larger impact on households. There have been, for example, no large nationwide falls in house prices during recent decades. In addition, a rise in unemployment on par with that in the early 1990s could be expected to have a more severe influence on household credit losses, given the large rise in household indebtedness over the intervening period. A corollary of this rise in household indebtedness is the greater share of banks’ lending now made up by housing and personal lending. These considerations suggest that any weakening in lending standards in these areas could have a larger systemic impact than in the past.

Australian Mortgage Holders Sensitive to Interest Rate Movements – CoreLogic RP Data

An article by Cameron Kusher, CoreLogic RP Data senior research analyst highlights that according to data from the Reserve Bank the ratio of household debt to disposable income is 153.8% and the ratio of housing deb to disposable income is 140.3% both of which are record highs.

Each quarter the Reserve Bank (RBA) publishes selected household finance ratios which show some key statistics about the level of debt held by Australian households. Although Australia has relatively low levels of public debt, private debt is extremely high and unlike many other countries there hasn’t been a decline in that debt in the aftermath of the financial crisis.

The latest household finances data from the RBA shows that in December 2014, the ratio of household debt to disposable income was 153.8%, its highest level on record. Housing debt accounts for 91% of total household debt and is recorded at a record high ratio of 140.3%. The chart shows that the level of debt has been relatively unchanged since 2005 but is now heading higher.

Focussing on the housing component of this debt, of the 140.3% ratio, 92.2% of that figure was owner occupier housing and 48.0% was investor housing. Once again, both are currently at record high levels. As with total housing debt, both had been relatively unchanged over recent years but have lifted over the past couple of years. It is important to note that the gap between owner occupier debt and investor debt is at near record high levels too.

Although household debt is high, the value of household assets is much higher than the debt. According to the data from the RBA the ratio of household assets to disposable income is 813.8%, much higher than the ratio of household debt at 153.8%. From the housing perspective, the ratio of housing assets to disposable income is recorded at 444.0% compared to a ratio of 140.3% for housing debt to household income. The chart shows that the ratio for both household and housing assets had been higher before the financial crisis however, both are now clearly trending higher again.

The data also shows that the ratio of household debt to household assets is 16.7% while the ratio of housing debt to housing assets is 28%. This highlights that although household and housing debts are high, the value of those assets is substantially higher than the level of debt. While this may be true at a national level it doesn’t mean that everyone is immune from the effects of an economic and/or housing market downturn.

Although these figures would provide some comfort that most households have the ability to sell assets to repay debt if they hit trouble, it is important to remember that it is a national view. There are areas of the country where households are much more susceptible to housing and economic downturns. Some specific areas and household types are recent first home purchasers, areas where there has been very little home value growth in recent years, single industry townships and areas where households have re-drawn a large proportion of their home’s equity.

With regards to the recent increases in household and housing debt, obviously very low interest rates (which have just got lower) are encouraging increased borrowing, particularly for housing. On the other hand, saving is not attractive because there is virtually no returns available. While most households can comfortably meet their mortgage requirements with mortgage rates at these levels, it is important to remember that a mortgage is usually a 25 to 30 year commitment and mortgage rates can fluctuate significantly over that time. The fact that household debt levels merely flat-lined rather than reduced following the financial crisis creates some concerns about what will happen once mortgage rates start to normalise (whenever that may be). Furthermore, the rate cut delivered this week may encourage even further leveraging into the housing market.

These are of course average figures across all household. However, as we have shown already, if you segment the household base, you discover that household debt is concentrated in different segments. Some are well able to cover the debts they owe, even if rates were to rise, but others are, even in the current low rate environment close to the edge, and with incomes static, vulnerable even to small rises in interest rate.

RBA Statement on Monetary Policy Lowers Growth

The RBA released their statement on monetary policy May 2015, today. In it there is no signal about future interest rate movements, but growth forecasts were lowered, to 2% in June 2015. Beyond that, the economy is now expected to grow to 3.25% in the year ended December 2016 (previously 4%). They expect unemployment to rise further to a peak of 6.5%. Inflation is expected to rise later in 2015, a little, but still within the target band. In an investigation into the cycle of dwelling investment, they find that on balance, strength in dwelling investment is likely to be sustained, supported by low interest rates and relatively strong population growth. However, difficulties in obtaining the necessary production inputs, especially suitable land with development approval in some parts of the country, are likely to limit the extent of any further pick-up in dwelling investment growth above what is currently expected.

Growth of Australia’s major trading partners was around its long-run average in 2014. It appears to have eased slightly in the early months of 2015. Commodity prices have been quite volatile over recent months, notably iron ore and oil prices, which have rebounded somewhat from recent lows. Even so, prices of Australia’s key commodity exports overall have declined since the beginning of 2015 and are well down on levels of a year ago. In large part, the declines reflect growth in the supply of commodities globally, although an easing of growth in China’s demand for some key commodities has also played a role. While there has been a further fall in Australia’s terms of trade, the Australian dollar has appreciated by around 3 per cent against the US dollar and in trade-weighted terms since the previous Statement. In China, economic growth has eased further. The Chinese property market remains a source of weakness in the economy and this is flowing through to weaker demand for steel and other construction related products. Indicators for Japanese economic activity have been somewhat mixed early this year, though labour market conditions remain tight and there are tentative signs that wage growth will rise, which is expected to underpin a pick-up in domestic price pressures. Economic growth in the rest of east. Asia looks to have slowed a little in the March quarter.

Growth in the US economy moderated in the March quarter, largely reflecting the temporary effects of disruptions related to severe weather and industrial action in west coast ports. Meanwhile, the US labour market has continued to improve and wage growth has picked up. Economic activity in the euro area is recovering at a gradual pace.

Despite slightly weaker-than-expected conditions early in 2015, growth of Australia’s major trading partners is expected to remain around its long-run average pace in 2015 and 2016. Growth will continue to be supported by very stimulatory monetary policies in most parts of the world. Core inflation rates are below many central banks’ targets. The Federal Open Market Committee is not expected to start increasing the US policy rate until the second half of 2015, while the People’s Bank of China has recently taken steps to boost liquidity and has adopted a more accommodative monetary policy stance more generally. The European Central Bank and the Bank of Japan continue to expand their balance sheets in line with their previously announced policies. Accordingly, finance remains readily available amid very favourable pricing conditions, notwithstanding the sharp rise in sovereign yields in recent days. Also, the low oil price is providing support to Australia’s trading partners, most of which are net oil importers.

The available data suggest that the domestic economy continued to grow at a below-trend pace in the March quarter. Dwelling investment and resource exports appear to have continued growing strongly and there is evidence that the growth of household consumption has been gaining some momentum over the past six months or so. However, investment in the mining sector is declining noticeably and non-mining business investment remains subdued.  Moreover, indicators of nonmining business investment intentions suggest that a significant pick-up is not in prospect over the next year or so.

Conditions in the established housing market remain strong, especially in Sydney and to a lesser extent in Melbourne. Outside these cities, however, housing price growth has declined. Forward-looking indicators, including building approvals, suggest that dwelling investment overall will continue to grow strongly over coming quarters. Housing credit growth has been little changed at a pace that is around the long-term growth of household income. Growth of housing credit for investors remains close to 10 per cent on an annual basis, with no sign of growth either increasing or decreasing in the period ahead. Very low interest rates and increasing housing prices helped to support a pick-up in the growth of household consumption over 2014. More recent retail sales data suggest that consumption growth maintained its pace into the early months of 2015. Measures of consumer sentiment remain a little below average.

Export volumes continue to increase, aided in the March quarter by the absence of substantial weather-related disruptions to mining and shipping operations across the country. Resource export volumes are expected to continue growing as new production capacity for iron ore and liquefied natural gas comes on line over 2015. However, the decline in commodity prices in recent quarters has put pressure on higher-cost producers in the iron ore and coal sectors. While the substantial declines recorded in mining investment have been much as expected, producers have responded to lower  commodity prices with further cost-cutting. Some smaller, higher-cost producers of iron ore and coal in Australia have announced the curtailment of production, although the affected mines accounted for only a relatively small share of Australian production in 2014.

Non-mining business investment has remained subdued even though many of the conditions for a recovery have been in place for some time. Access to funding does not appear to be constraining business decisions; lending rates on the outstanding stock of business (and housing) loans have continued to edge lower and business credit growth has been picking up. Also, surveys suggest that business conditions in the non-mining sector are close to average. However, forward-looking measures of business confidence remain a bit below average and non-residential building approvals are relatively subdued. Business liaison suggests that firms have spare capacity and are still waiting to see a more substantial improvement in demand conditions before they commit to major new investment projects. In line with that, surveys of investment intentions do not indicate that there will be much of a pick-up in non-mining capital investment over the next year or so.

There continues to be excess capacity in the labour market, though the most recent labour force data suggest that employment growth has increased over the past six months or more, to be above the rate of population growth. The participation rate has picked up slightly, and the unemployment rate has been stable at about 6¼ per cent since mid 2014. Forward-looking indicators of labour demand, which had picked up somewhat over the past year, have been little changed over recent months and point to modest growth of employment over coming months.

Consumer price inflation declined over the past year, reflecting substantial falls in fuel prices and the repeal of the carbon price, although the recent rebound in fuel prices should add to headline inflation somewhat in the near term. Measures of underlying inflation remained around ½–¾ per cent in the March quarter and 2¼–2½ per cent over the past year. Domestic cost pressures are generally well contained, partly because of the extended period of low growth of wages, with the result that non-tradables inflation was about 1 percentage point below its decade average over the year to March. Consumer prices related to housing increased by marginally more than their historical average, driven by inflation in new dwelling costs, which in turn reflects the strength of dwelling investment. Tradables inflation (excluding volatile items and tobacco) has picked up in response to the depreciation of the Australian dollar over the past two years or so.

Growth in the Australian economy is expected to continue at a below-average pace for a little longer than earlier anticipated and to pick up gradually to an above-average pace over 2016/17. The key forces shaping the outlook are much as they have been for some time. Recent data suggest that consumption growth has continued to pick up gradually, supported by very low interest rates and relatively strong population growth. Forwardlooking indicators continue to suggest that dwelling investment will continue to grow strongly in the near term. The momentum building in household demand will, in time, provide some impetus to nonmining business investment, even though indicators of investment intentions suggest that non-mining business investment is not likely to pick up over coming quarters, as had been expected at the time of the February Statement. Export growth is also expected to continue making a substantial contribution to GDP growth. Mining investment, fiscal consolidation and the falling terms of trade are expected to impart an offsetting restraint on growth over the next couple of years at least. The profile for GDP growth implies that there will be excess capacity in the labour market for longer than previously thought. The unemployment rate is expected to rise gradually and peak a little later than envisaged in the February Statement, before gradually declining towards the end of the forecast period. Wage growth is not expected to increase much from its current low levels over the next two years or so. As a result, domestic labour cost pressures are likely to remain well contained and underlying inflation is expected to be consistent with the inflation target throughout the forecast period.

The risks to the outlook for the global economy appear roughly balanced, other than for China where risks remain tilted to the downside. Weakness in the Chinese property market and constraints on the ability of local governments to fund infrastructure projects continue to represent key sources of uncertainty for China’s economic growth and its demand for commodities. Any significant change in the demand for steel in China would affect the prices of iron ore and coking coal. Also, if high cost producers of iron ore in China were to curtail production significantly, this would place upward pressure on prices.  Developments in China and their impact on commodity prices are also likely to affect the outlook for the exchange rate, which is another important consideration for the forecasts for the domestic economy. Further depreciation of the exchange rate seems both likely and necessary, particularly given the significant declines in key commodity prices, although increasingly divergent monetary policies in the major economies are also likely to have an important bearing on exchange rate developments.

Domestically, the forecasts embody a further gradual pick-up in consumption growth and decline in the saving ratio. However, if households respond to changes in interest rates and asset prices to the same degree as they did prior to the global financial crisis, this would support higher consumption growth and imply a lower saving ratio than embodied in the forecasts. Alternatively, if households are less inclined to bring forward their consumption than has been factored into the forecasts, perhaps because they do not wish to increase their leverage, consumption growth would be weaker and the saving ratio higher than forecast.

Business investment remains a significant source of uncertainty. Mining investment is expected to fall significantly, but the size of the fall and the impact of lower-than-expected commodity prices remain uncertain. There are also significant risks to the forecasts for non-mining investment. While the latest capital expenditure survey implies a weaker profile for non-mining business investment over the next year than currently forecast, the first estimate of investment intentions for 2015/16 is subject to considerable uncertainty and the survey covers only about half of actual non-mining business investment. Moreover, many of the preconditions for a recovery in non-mining business investment are in place, so it is possible that the recovery could begin earlier or be stronger than currently forecast. The adjustment to the decline in the terms of trade and mining investment over recent years has resulted in a rise in the  unemployment rate and a pronounced decline in wage growth in the economy. The unemployment rate is expected to rise a little further from here, before it begins to decline. It is possible that employment growth will be stronger than expected and the unemployment rate will not increase to the extent anticipated, although this could probably only be achieved with ongoing moderation in wage growth.

The Reserve Bank Board reduced the cash rate by 25 basis points at its February meeting. At its March and April meetings, the Board kept the cash rate steady, but indicated that further easing may be appropriate. Over that period, incoming data have generally provided more confidence that growth in household expenditure is gaining some momentum, consistent with the forecasts presented in the February Statement. However, other information, including the forward-looking indicators of investment, suggested that overall growth will remain below trend for longer than had previously been expected. Accordingly, the economy is likely to be operating with a degree of spare capacity for some time yet and domestic cost pressures are expected to remain subdued and inflation well contained. The Board noted that although financial conditions are very accommodative, the exchange rate continues to offer less assistance than would normally be expected in achieving balanced growth in the economy. It also noted that while housing price growth is very strong in Sydney, it has declined across much of the rest of the country, and there has been little change to the growth of housing credit in recent months. The Bank is working with other regulators to assess and contain risks that may arise from the housing market.

At its May meeting the Board judged that, under these circumstances, it was appropriate to reduce the cash rate by a further 25 basis points to provide some additional support to economic activity. This could be expected to reinforce recent encouraging trends in household demand and is consistent with achieving the inflation target. The Board will continue to assess the outlook and adjust policy as needed to foster sustainable growth in demand and inflation outcomes consistent with the inflation target over time.

RBA Rate Cut Increases Need for Greater Macro-Prudential Response – Fitch

Fitch Ratings says the Reserve Bank of Australia’s (RBA) recent interest rate cut is likely to lead to a strengthened macro-prudential response from the Australian Prudential Regulatory Authority (APRA) for the Australian banking system, although implementation will probably remain targeted and occur on a bank-by-bank basis.

Today’s rate cut is likely to further fuel the Australian property market, particularly in Sydney, at a time when the authorities are trying to take the steam out of the market. Macro-prudential tools allow the regulator to influence banks’ risk appetite, preserving asset quality and limiting potential losses in the event of an economic shock. The Australian banking system benefits from strong loss absorption capacity given the banks’ sound profit generation and provision levels, as well as adequate capitalisation. These strengths could be undermined by further increases in property prices and household debt, given mortgages form the largest asset class for Australian banks.

APRA has targeted certain higher risk areas such as investor mortgages, indicating growth in excess of 10% per annum would trigger closer regulatory monitoring and may lead to tougher capital requirements. In addition, APRA could use a set of other macro-prudential tools which may include a combination of debt-servicing requirements, additional capital requirements and/or loan-to-value ratio (LVR) restrictions, depending on each lender. Given the existence of lenders’ mortgage insurance (LMI), which mitigates the banks’ risk of higher LVR mortgages, debt-servicing requirements and higher capital requirements on a bank-by-bank basis are likely to be the preferred options.

Growing risks in the housing market and the banks’ mortgage portfolios could be exacerbated if further macro-prudential scrutiny is not forthcoming. The recent interest rate cut may lead to further house price appreciation, especially in cities such as Sydney and Melbourne, where there has been greater investor activity over the past 12 to 18 months. The first rate cut in February 2015 was followed by increased activity in these housing markets. The growth in house prices exceeded lending growth up to the end of 2014, but this trend could reverse as interest rates are at historical lows. At the same time, it makes borrowers vulnerable to a potential increase in interest rates in the medium term. Australia has one of the highest household debt levels globally, and if low interest rates contribute to higher credit growth, it could drive up household indebtedness from already historically high levels.

Falling interest rates may also result in further growth in potentially higher-risk loan types, such as interest-only and investor loans. These loan types already represent a high proportion of new approvals for Australian banks, as shown in Fitch’s “APAC Banks: Chart of the Month, February 2015”. The proportion of new interest-only mortgages is higher than new investor mortgages, suggesting that owner-occupiers are increasing the use of these types of loans at a time when historically-low interest rates should encourage borrowers to pay off debt. Serviceability testing at Fitch-rated Australian banks may provide some offset to this risk, with loans assessed on a principle and interest basis and at interest rates well above the prevailing market rate.