The Reserve Bank of NZ has released a short animated video.
Stress testing is a tool to assess how banks might cope with a severe economic downturn. This video explains how stress tests work and why the Reserve Bank of New Zealand uses them in its role as prudential regulator.
The results of the 2016 UK Bank stress testing has been released by the Prudential Regulation Authority (PRA). The test did not reveal capital inadequacies for four out of the seven participating banks but the Royal Bank of Scotland Group (RBS), Barclays and Standard Chartered revealed some capital inadequacies and remedial work is required.
However, the PRA concluded that given the results, no system-wide macroprudential actions on bank capital were required in response to the 2016 stress test. Despite a more severe scenario, the aggregate low points for CET1 capital and Tier 1 leverage ratios were higher than in the 2014 and 2015 tests.
Background
In March 2016, the Bank of England launched its third concurrent stress test of the UK banking system. The 2016 stress test covered seven major UK banks and building societies (hereafter referred to as ‘banks’), accounting for around 80% of PRA-regulated banks’ lending to the UK real economy.
The 2016 stress-test scenario was designed under the Bank’s new approach to stress testing. Under this framework, the stress being tested against will generally be severe and broad, in order to assess the resilience of major UK banks to ‘tail risk’ events. Its precise severity will reflect the risk assessment of the FPC and PRA Board.
As such, the 2016 test was more severe than earlier tests. The severity of the stress in the 2016 scenario is based on the risk assessment the FPC and PRA Board made in March 2016 — that overall risks to global activity associated with credit, financial and other asset markets were elevated, and that risks associated with domestic credit were no longer subdued but
were not yet elevated.
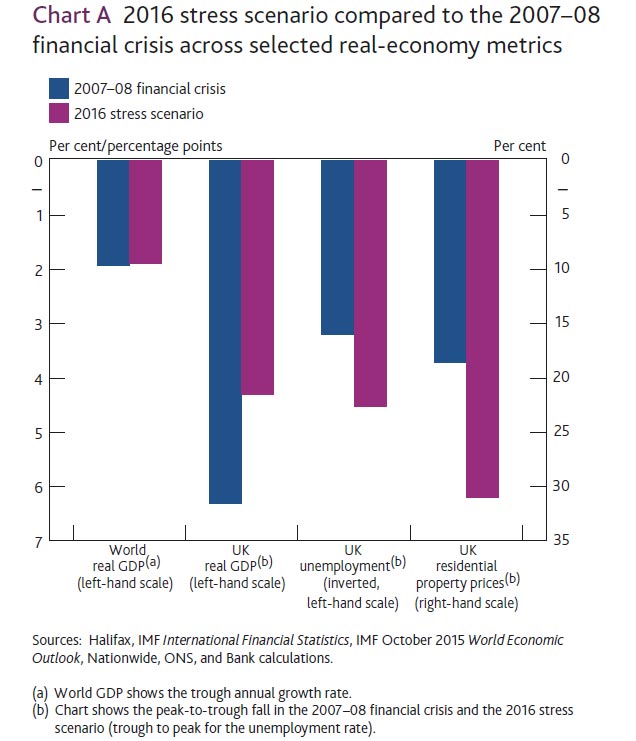
The 2016 annual cyclical scenario incorporates a very severe, synchronised UK and global economic recession, a congruent financial market shock and a separate misconduct cost stress. Annual global GDP growth troughs at -1.9%, as it did during the 2008 global financial crisis. Annual growth in Chinese real GDP is materially weaker than in the financial crisis and troughs at -0.5%. The level of UK GDP falls by 4.3%, accompanied by a 4.5 percentage point rise in the unemployment rate. Overall, the UK stress is roughly equivalent to that experienced during the financial crisis, albeit with a shallower fall in domestic output, and a more severe rise in unemployment and fall in residential property prices.
The stress test also includes a traded risk scenario that is constructed to be congruent with this macroeconomic stress. Having fallen significantly during 2015, the price of oil reaches a low of US$20 per barrel, reflecting the slowdown in world demand. Investors’ risk appetite diminishes more generally and financial market participants attempt to de-risk their portfolios, generating volatility. The VIX index averages 37 during the first year of the stress, which compares to a quarterly average of around 40 between 2008 H2 and 2009 H1.
Interest rates facing some households and businesses increase in the early part of the stress, partly reflecting a rise in term premia on long-term government debt. Credit spreads on corporate bonds rise sharply, with spreads on US investment-grade corporate bonds, for example, rising from around 170 basis points to 500 basis points at the peak of the stress. Meanwhile, policymakers pursue additional monetary stimulus, which starts to reduce long-term interest rates.
Residential property and commercial real estate (CRE) prices also fall. Following rapid recent growth, these falls are particularly pronounced for property markets in China and Hong Kong, with residential property prices falling by around 35% and 50%, respectively. In the United Kingdom, house prices fall by 31% and average CRE prices fall by 42%. These falls are even greater for prime CRE, reflecting the fact that prices of these properties have risen more robustly since the financial crisis.
The 2016 stress test also incorporates stressed projections, generated by Bank staff, for potential misconduct costs, beyond those paid or provided for by the end of 2015. These stressed misconduct cost projections are not a central forecast of such costs. They are a simultaneous, but unrelated, stress alongside the macroeconomic stress and traded risk scenario incorporated in the 2016 test.
Impact of the stress scenario on the banking system
The stress scenario is estimated to lead to system-wide losses of £44 billion over the first two years of the stress, around five times the net losses incurred by the same banks as a group over 2008–09. Based on the Bank’s projections, the 2016 stress scenario would reduce the aggregate CET1 capital ratio across the seven participating banks from 12.6% at the end of 2015 to a low point of 8.8% in 2017, after factoring in the impact of management actions and the conversion of AT1 instruments into CET1 capital (Table 1).(1) The aggregate Tier 1 leverage ratio falls from 4.9% at the end of 2015 to a low point of 3.9% in 2017.
Compared to previous tests, the fall in the aggregate CET1 capital ratio from start to stressed low point was larger in the 2016 stress test, reflecting the greater severity of the stress scenario. Nevertheless, at 8.8% that low point was well above the 7.6% low point reached in 2014 and 2015.
Lloyds Banking Group and Santander UK cut their ordinary dividends to zero by the low point of the stress, in line with their published payout policies.(1) In reaction to losses made during both the first and second years of the stress, HSBC makes a substantial discretionary cut in ordinary dividend payments in 2016 and then pays no ordinary dividend in 2017,
as it makes a loss and becomes subject to CRD IV distribution restrictions. Meanwhile, Barclays and Standard Chartered are loss-making during the first two years of the stress and cut their ordinary dividend payments to zero as they become subject to CRD IV distribution restrictions. The Royal Bank of Scotland Group does not pay an ordinary dividend in any year
of the stress scenario. Nationwide continues to make distributions on its Core Capital Deferred Shares (CCDS).
In general, the stress has the greatest impact on those banks with significant international and corporate exposures. The three banks operating principally in domestic markets — Lloyds Banking Group, Nationwide and Santander UK — remain well above their hurdle rates throughout the stress. This reflects, in part, improvements in the asset quality of banks’ core UK mortgage businesses, through a combination of rising property prices, which have bolstered the value of collateral backing loans, as well as banks adopting more prudent new lending standards.
The PRA Board judged that:
The test did not reveal capital inadequacies for four out of the seven participating banks, based on their balance sheets at end-2015 (HSBC, Lloyds Banking Group, Nationwide Building Society and Santander UK).
The Royal Bank of Scotland Group (RBS) did not meet its common equity Tier 1 (CET1) capital or Tier 1 leverage hurdle rates before additional Tier 1 (AT1) conversion in this scenario. After AT1 conversion, it did not meet its CET1 systemic reference point or Tier 1 leverage ratio hurdle rate. Based on RBS’s own assessment of its resilience identified during the stress-testing process, RBS has already updated its capital plan to incorporate further capital strengthening actions and this revised plan has been accepted by the PRA Board. The PRA will continue to monitor RBS’s progress against its revised capital plan.
Barclays did not meet its CET1 systemic reference point before AT1 conversion in this scenario. In light of the steps that Barclays had
already announced to strengthen its capital position, the PRA Board did not require Barclays to submit a revised capital plan. While these steps are being executed, its AT1 capital provides some additional resilience to very severe shocks.
Standard Chartered met all of its hurdle rates and systemic reference points in this scenario. However, it did not meet its Tier 1 minimum capital requirement (including Pillar 2A). In light of the steps that Standard Chartered is already taking to strengthen its capital position, including the AT1 it has issued during 2016, the PRA Board did not require Standard Chartered to submit a revised capital plan.
The FPC judged that the system should be capitalised to withstand a test of this severity, given the risks it faced. It therefore welcomed the actions by some banks to improve their capital positions. Despite a more severe scenario, the aggregate low points for CET1 capital and Tier 1 leverage ratios were higher than in the 2014 and 2015 tests. The FPC noted the increased resilience to stress provided by banks’ AT1 capital positions and banks’ stated intention to reduce dividends in stress. It also noted the strong performance of the most domestically focused banks. Given the results, no system-wide macroprudential actions on bank capital were required in response to the 2016 stress test.
The FPC is maintaining the UK countercyclical capital buffer rate at 0% and reaffirms that it expects, absent any material change in the outlook, to maintain this rate until at least June 2017. This reflects developments since the stress test was launched in March, which suggest greater uncertainty around the UK economic outlook and an increased possibility that material domestic risks could crystallise in the near term. The FPC was concerned that banks could respond to these developments by hoarding capital and restricting lending. That position has not changed.
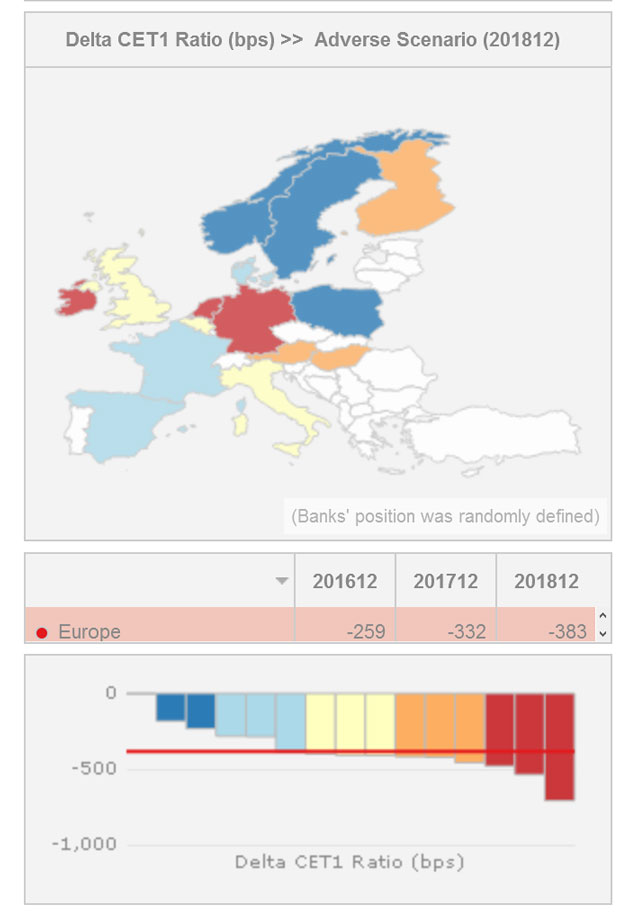
The EU have just published the latest stress testing on 51 banks from 15 EU and EEA countries covering around 70% of banking assets in each jurisdiction and across the EU. The results show significant variations across banks and countries and offers an unprecedented level of transparency across individual banks with over 16,000 data points per bank. RBA and APRA, please take note!
They have provided a powerful interactive tool to analyse the results. Here is a top level map by country, showing the relative change in CET1 ratios to 2018, in the adverse scenario.
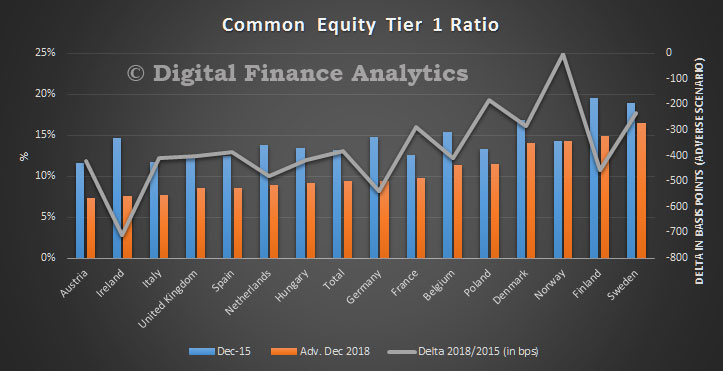
Banks in Austria, Ireland, Italy and the UK would have the lowest CET1 ratios in the adverse scenarios.
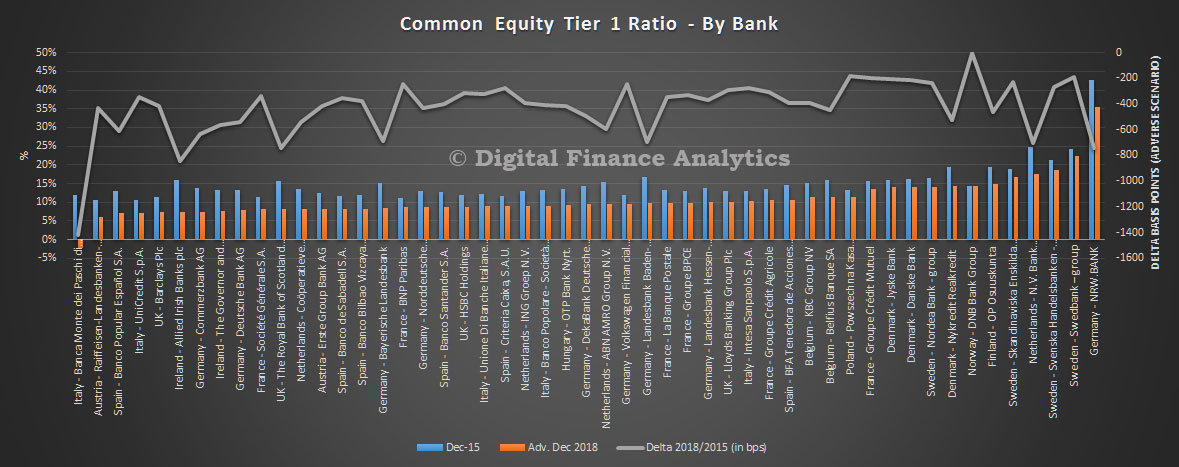
The data, bank by bank is also revealing, showing that there are significant variations.
The EU‐wide stress test is primarily focused on the assessment of the impact of risk drivers on the solvency of banks. Banks are required to stress test the following common set of risks: Credit risk, including securitisations; Market risk, CCR and CVA; and Operational risk, including conduct risk.
In addition to the risks listed above, banks are requested to project the effect of the scenarios on NII and to stress P&L and capital items not covered by other risk types.
The risks arising from sovereign exposures are covered in credit risk and in market risk, depending on their accounting treatment.
The adverse scenario implies EU real GDP growth rates over the three years of the exercise of ‐1.2%, ‐1.3% and 0.7% respectively – a deviation of 7.1% from its baseline level in 2018.
The 2016 EU-wide stress test does not contain a pass fail threshold. Instead it is designed to support ongoing supervisory efforts to maintain the process of repair of the EU banking sector.
The objective of the stress test is to provide supervisors, banks and other market participants with a common analytical framework to consistently compare and assess the resilience of large EU banks to adverse economic developments. Along with the results, the EBA is providing again substantial transparency of EU banks’ balance sheets, an essential step towards enhancing market discipline in the EU.
The EU banking sector has significant shored up its capital base in recent years leading to a starting point capital position for the stress test sample of 13.2 % CET1 ratio at the end 2015. This is 200 bps higher than the sample in 2014 and 400 bps higher than in 2011. The hypothetical scenario leads to a stressed impact of 380 bps on the CET1 capital ratio, bringing it across the sample to 9.4% at the end of 2018. The CET1 fully loaded ratio falls from 12.6% to 9.2%, while the aggregate leverage ratio decreases from 5.2% to 4.2% in the adverse scenario.
The impact is driven by:
credit risk losses of €-349 bn contributing -370 bps to the impact on the CET1 capital ratio.
operational risk (€-105 bn or -110 bps) of which conduct risk losses contributed -€71 bn or -80 bps to the CET1 impact
market risk across all portfolios including CCR (€-98bn or -100bps).
The impact is partially offset by pre provision income flows, although these too are subject to stress factors and constraints in the methodology. For instance net interest income falls 20% in the adverse scenario from 2015 levels.
The impact ranges from close to 0 for the Norwegian bank in the sample to more than ‐700bps for banks from Ireland albeit with large differences within each country. The dispersion across all banks is thus not surprisingly larger with 14 banks projecting an impact of more than ‐500bps on a
transitional basis. One bank reports a reduction in the CET1 ratio of more than 14 percentage points. While for the majority of banks the impact on a transitional basis is approximately equal to or higher than the fully loaded impact, a few banks report a significantly, i.e. around 20%, higher fully loaded impact. For a small number of banks around half of the
transitional CET1 capital ratio impact is explained by transitional arrangements. Different phase‐in schedules across countries explain why for some countries the impact on a fully loaded and the impact on a transitional basis are identical while other countries show relatively large discrepancies. In this respect the largest differences are visible for banks from Germany and Spain.
Reflecting on the results, it is worth bearing in mind that many of the smaller banks (with 30% of bank assets), not caught in this set of tests are in a much worst state – including entities in Germany and Italy. Also, there is contention in some countries, (such as Italy, where banks probably need to have an injection of capital), between EU rules which stop governments providing more capital and risks to depositors and bond holders thanks to the EU preferred “bail-in” arrangements.
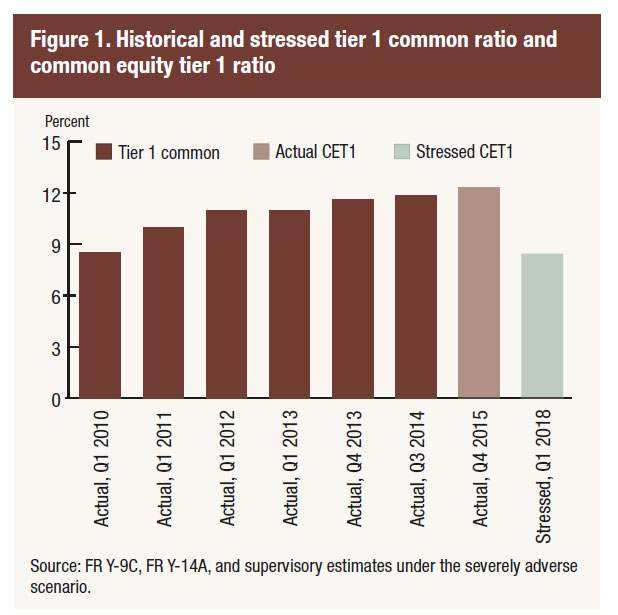
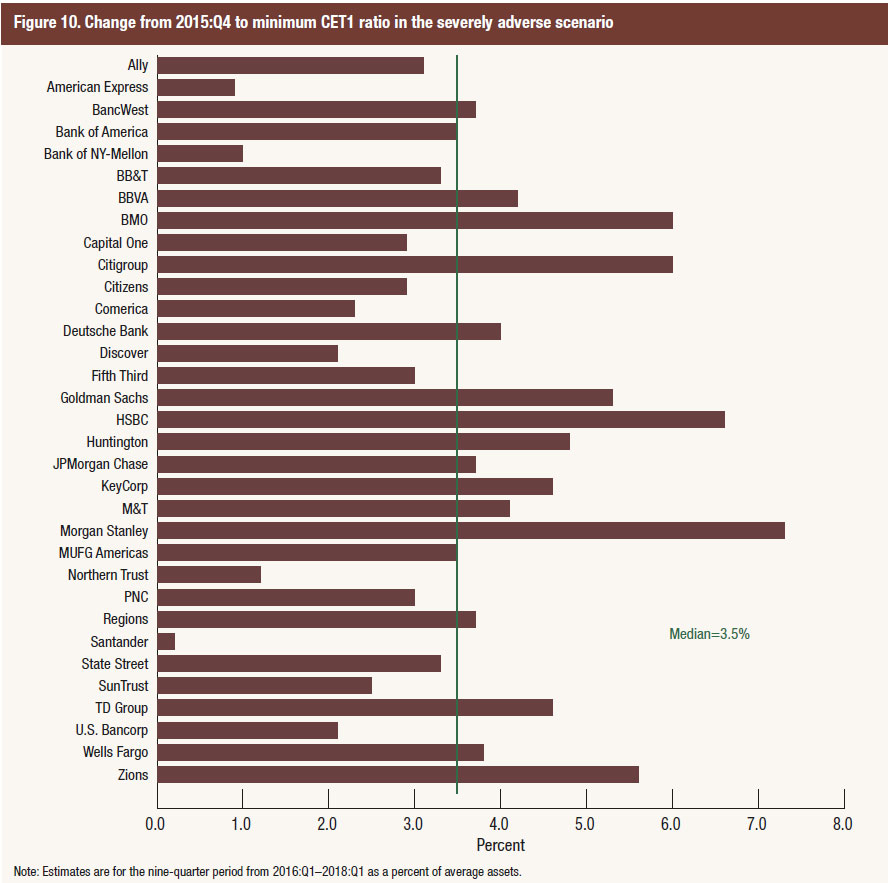
The FED has released the latest stress tests. The most severe hypothetical scenario projects that over the nine quarters of the planning horizon, aggregate losses at the 33 bank holding companies (BHCs) under the severely adverse scenario are projected to be $526 billion. This includes losses across loan portfolios, losses from credit impairment on securities held in the BHCs’ investment portfolios, trading and counterparty credit losses from a global market shock, and other losses. Projected aggregate net revenue before provisions for loan and lease losses (pre-provision net revenue, or PPNR) is $384 billion, and net income before taxes is projected to be –$195 billion. The aggregate Common Equity Tier 1 (CET1) capital ratio would fall from an actual 12.3 percent in the fourth quarter of 2015 to a post-stress level of 8.4 percent in the first quarter of 2018. Since 2009, these firms have added more than $700 billion in common equity capital.
In the adverse scenario, aggregate projected losses, PPNR, and net income before taxes are $324 billion, $475 billion, and $142 billion, respectively. The aggregate CET1 capital ratio under the adverse scenario would fall 173 basis points to its minimum over
the planning horizon of 10.5 percent in the first quarter of 2018.
This is the sixth round of stress tests led by the Federal Reserve since 2009 and the fourth round required by the Dodd-Frank Act. The 33 firms tested represent more than 80 percent of domestic banking assets. The Federal Reserve uses its own independent projections of losses and incomes for each firm.
The “severely adverse” scenario features a severe global recession with the domestic unemployment rate rising five percentage points, accompanied by a heightened period of financial stress, and negative yields for short-term U.S. Treasury securities.
In addition to releasing results under the severely adverse hypothetical scenario, the Board on Thursday also released results from the “adverse” scenario, which features a moderate recession and mild deflation in the United States. In this scenario, the aggregate common equity capital ratio of the 33 firms fell from an actual 12.3 percent in the fourth quarter of 2015 to a minimum level of 10.5 percent.
The nation’s largest bank holding companies continue to build their capital levels and improve their credit quality, strengthening their ability to lend to households and businesses during a severe recession
The Board’s stress scenario estimates use deliberately stringent and conservative assessments under hypothetical economic and financial market conditions. The results are not forecasts or expected outcomes.
The Dodd-Frank Act stress tests are one component of the Federal Reserve’s analysis during the Comprehensive Capital Analysis and Review (CCAR), which is an annual exercise to evaluate the capital planning processes and capital adequacy of large bank holding companies. CCAR results will be released on Wednesday, June 29. The Federal Reserve annually assesses whether BHCs with $50 billion or more in total consolidated assets have effective capital planning processes and sufficient capital to absorb losses during stressful conditions while meeting obligations to creditors and counterparties and continuing to serve as credit intermediaries.
Fitch Rating. says that after its latest stress tests, the Bank of England’s (BoE) assessment is that the UK banking sector is adequately capitalised and the results will not force any capital planning revisions. Further sector-wide capital step-ups are unlikely in future.
Capital ratios are likely to remain stable, held up by the BoE’s increased use of countercyclical buffers. These will be built up as lending growth accelerates and will be released when the cycle turns. The BoE’s intention is that banks’ capital planning should become more efficient and flexible. The BoE’s Financial Policy Committee indicated that it considers a Tier 1 capital adequacy ratio of 11% to be appropriate for the sector. Fitch expect banks to set their internal buffers relative to this level and plan their capital needs relative to the level of sensitivity to stress test inputs.
Results from yesterday’s stress test show that, under the baseline scenario, the seven participating banks are improving their capital positions. But the Royal Bank of Scotland Group (RBS; BBB+/Stable) and Standard Chartered (A+/Negative) did not meet the BoE’s capital requirements under the stress scenario. Both banks have taken, or are taking steps this year to address capitalisation.
The regulator will use future stress test results to assess individual banks’ capital requirements. Fitch expects the tests to become more sophisticated and more qualitative in nature. This is already the case in the US where the Federal Reserve’s annual Comprehensive Capital Analysis and Review plays an important role in how the country’s leading banks assess their capital planning exercises.
In the UK, annual cyclical tests will be run to capture risks from financial cycles, with the severity of scenarios increasing as risks build up. This should produce more rounded stressed results. Latent risks not captured by the annual cyclical scenario will be introduced every other year when the BoE will run a biannual stress test. Fitch thinks the banks should, over time, be able to anticipate broad movements in the annual cyclical scenario, making it easier for them to set internal buffers above minimum regulatory requirements, based on their expected sensitivity to the regulatory stress test.
The 2015 stress test hurdles – a 4.5% common equity tier 1 (CET1) ratio and a 3% leverage ratio – were not particularly onerous. All participating banks met these. But hurdle rates will evolve and banks will need to meet their Pillar 1 minimum CET1 ratios under stressed scenarios, plus any additional requirements set by the regulators under Pillar 2A and buffers for systemically important banks.
The Bank of England announced the results of the first concurrent stress testing exercise of the UK banking system. Alongside the stress test publication, the Bank of England also published its Financial Stability Report, which sets out the Financial Policy Committee’s (FPC) assessment of the outlook for the stability and resilience of the financial sector, and the Systemic Risk Survey, which quantifies and tracks market participants’ perceptions of systemic risks.
Following on from the EU-wide stress test, the 2014 UK stress test of the eight major UK banks and building societies was designed specifically to assess their resilience to a very severe housing market shock and to a sharp rise or snap back in interest rates. This was not a forecast or expectation by the Bank of England regarding the likelihood of a set of events materialising, but a coherent, severe ‘tail risk’ scenario.
The eight banks and building societies tested as part of this exercise were Barclays Bank, Co-operative Bank, HSBC Bank, Lloyds Banking Group, Nationwide Building Society, Royal Bank of Scotland, Santander UK and Standard Chartered.
There was substantial variation across the banks and building societies in terms of the impact of the stress scenario. From an individual-institution perspective, the Prudential Regulation Authority (PRA) Board judged that this stress test did not reveal capital inadequacies for five out of the eight participating banks, given their balance sheets at end-2013 (Barclays, HSBC, Nationwide, Santander UK and Standard Chartered). The PRA Board did not require these banks to submit revised capital plans.
Following the stress testing exercise, the PRA Board judged that, as at end-2013, three of the eight participating banks (Co-operative Bank, Lloyds Banking Group and Royal Bank of Scotland) needed to strengthen their capital position further. But, given continuing improvements to banks’ resilience over the course of 2014 and concrete plans to build capital further going forward, only one of these banks (Co-operative Bank) was required to submit a revised capital plan.
The FPC considered the information provided by the stress-test results from the perspective of the resilience of the UK banking system as a whole. The FPC noted that only one bank fell below the 4.5% threshold at the trough of the stress scenario, that the capitalisation of the system had improved further over the course of 2014 and that the PRA Board had agreed plans with banks to build capital further. Overall, the FPC judged that the resilience of the system had improved significantly since the capital shortfall exercise in 2013. Moreover, the stress-test results and banks’ capital plans, taken together, indicated that the banking system would have the capacity to maintain its core functions in a stress scenario. Therefore, the FPC judged that no system-wide, macroprudential actions were needed in response to the stress test.
Projected CET1 capital ratios in the stress scenario
Actual
(end 2013)
Minimum Stressed ratio (before the impact of ‘strategic’ management actions)
Minimum Stressed ratio (after the impact of ‘strategic’ management actions)

 Stress testing is a tool to assess how banks might cope with a severe economic downturn. This video explains how stress tests work and why the Reserve Bank of New Zealand uses them in its role as prudential regulator.