The latest edition of the conversations between DFA’s Martin North and Economist John Adams, this time focussing on the problematic APRA bank stress tests.
Digital Finance Analytics (DFA) Blog
"Intelligent Insight"

The latest edition of the conversations between DFA’s Martin North and Economist John Adams, this time focussing on the problematic APRA bank stress tests.
We discuss the latest APRA bank stress tests, and run our own.
In Wayne Byers speech yesterday – the one in which he said an 8% growth rate in residential home lending was “healthy (!)… he also covered the “stress testing”processes with the banks, and gave them a clean bill of health.
 We ran our own scenario on our Core Market Model, using their worst case baseline, and we get a result much closer to the LF Economics scenarios we posted early than the APRA outcome. In fact we think the LF Economics numbers may themselves be conservative.
In addition from APRA, we get no detail on their work, and no individual bank level disclosure (unlike the US version). So we do not find the APRA version very credible. Which is a worry. Clearly their strategy is “just trust us” – just as they did with the now revealed poor lending practice.
So to summarize the “tests” are:
In addition, banks had to consider an operational risk loss event involving misconduct and mis‑selling in the origination of residential mortgages. The additional operational risk element served as an amplifier of the stress, adding a further shock to bank balance sheets.
The result is a reduction in bank capital and credit losses of around $40 billion on their residential mortgage books. What have they assumed about property sales in default we wonder, and what about claims on Lender Mortgage Insurers at an industry level?
In addition, APRA does not really give us much detail of the scenarios (compare this with the US version). Is it a short sharp shock, or a long grind? We suspect the former.
Now, if we run the same scenario through our Core Market Model, based on our household surveys, what happens?
Well, first if banks cannot fund their books from offshore markets, their ability to lend, in aggregate drops by ~30%, unless it can be supplemented by either more deposits, or local investors. Remember that a significant proportion of the non-deposit part of bank books are funded short-term, so the impact will be immediate.
Either way there will be a rationing of credit and a bid up the price of funds – so putting more pressure on margins and mortgage rates. The local markets ability to provide sufficient funding is suspect, and it is likely that the Government via the RBA would have to provide funding, perhaps by the purchase of existing loan portfolios. We doubt the lenders ability to access funding. Loans will be rationed.
Households who are unemployed will be unable to continue to pay their mortgages, and will likely default. We have to assume that specific segments of the market will be most impacted, and we can run analysis on this. In addition some households renting will be unable to pay their rents as they fall due, putting some investment property under pressure.
We estimate that around 15% of mortgage holders will default. We assume that banks will try to assist borrowers, via their hardship schemes, and capitalise interest for a period, rather than foreclose (selling in a falling market just creates more losses).
So over the scenario time frame, using our data, we think credit losses will be will north of $310 billion. This compared with the $40 billion in the APRA results and $298 billion from LF Economics.
So why the difference?
Well, first, we think bank funding costs will be higher, thanks to the network effect of all lenders trying to tap limited sources thus driving rates higher still. APRA appears to have looked at banks individually.
Second, we think more households will be exposed to default risk as unemployment bites. In addition, we think that those remaining employed will have less overtime, and no wage growth so more financial pressure.
Third, the LVR and DTI ratios in our date (based on up to date data) suggests that the risks in the portfolio are actually higher than those used in the APRA (bank sourced) modelling. Some of this is so called “liar-loans” and the rest is multiple debt exposures and changed circumstances. Currently banks are myopic on this.
Fourth, Lender Mortgage Insurers will not be able to meet all claims. Not sure what APRA or the banks assumed. LMI’s might well be one of the first points of failure.
With that in mind, this is what APRA said:
When the storm hits – APRA’s most recent industry stress test
Alongside the gradual improvement in lending standards has been a significant increase in capital within the banking industry. This has been built first on the post-crisis Basel III reforms, and then on the recommendations of the 2014 Financial System Inquiry. As banks reach the “unquestionably strong” benchmarks that we announced last year, it will complete a decade-long build-up of capital strength.
ADI industry capital ratios
That capital exists today so that it can be called on in adversity. In 2017, we conducted our most recent test of banks’ resilience through an industry stress test. The aim of the stress test was not to set capital levels, and consistent with past practice it was not run as a pass or fail exercise. Rather, APRA utilises stress tests to examine the resilience of the largest banks, individually and collectively, and to explore the potential impacts of grim and challenging periods of stormy economic weather.
The scenario for the stress test was designed to be severe but plausible, and to target the key risks facing the industry. The basic scenario was a severe economic stress in Australia and New Zealand, with a significant downturn in the housing market at the epicentre. This was triggered by a downturn in China and a collapse in demand for commodities. The subsequent downgrade in sovereign and bank debt ratings leads to a temporary closure of offshore funding markets, a sell-off in the Australian dollar and widening in credit spreads. Australian GDP falls by 4 per cent, unemployment doubles to 11 per cent and house prices decline by 35 per cent nationally over three years.
Stress test – Real GDP growth
Stress test – House price index
To this traditional macro stress scenario we then added a twist. In addition to the sharp downturn in the economic environment, banks had to consider an operational risk loss event involving misconduct and mis‑selling in the origination of residential mortgages. The additional operational risk element served as an amplifier of the stress, adding a further shock to bank balance sheets.
Before sharing the results with you, I do need to note that these scenarios do not represent our official forecasts! They are obviously quite different from the base-case projections contained in most forecasts for the economy. But that is also why it is so important to test these severe but hopefully hypothetical scenarios – to avoid the risk of disaster myopia and a belief that we are somehow immune to tail risk events, given a benign track record and outlook.
The stress test involved 13 of the largest banks, and our approach was to generate the results in two phases. In the first, banks used their own models and parameters to estimate the impacts of the stress, subject to common guidelines and instructions to ensure a degree of consistency in the results. In the second phase, banks were asked to apply APRA estimates of the stress impacts, based on our own research, modelling, benchmarks and judgement.
While the phase 1 results were useful in shining a light on the banks’ modelling capabilities, and provided a view on what the banks themselves believe the impact of the scenarios would be, I’ll focus on the results from phase 2. These ironed out the kinks in modelling and, in our view, provided a more reliable and consistent set of results at a bank-specific and industry aggregate level.
Chart 11: Proportion of cumulative credit losses
As you would expect given the severity of the macroeconomic scenario, banks incurred significant losses, producing a substantial reduction in capital. Projected losses on the residential mortgages portfolio were large, consistent with the depth of the fall in house prices and the rise in unemployment. Overall, banks projected credit losses of around $40 billion on their residential mortgage books, which was equivalent to a little over a quarter of overall projected loan losses. As a loss rate, this would be broadly consistent with the experience in the UK in the early 1990s, but lower than the losses seen in Ireland or the US during the global financial crisis. It also represented a slightly lower loss rate than in APRA’s previous industry stress test in 2014. Some of this is due to differences in the scenario and in modelling, but it was also arguably reflective of the improvement in asset quality in recent years.
In aggregate, the common equity tier 1 (CET1) ratio of the industry fell from around 10.5 per cent at the start of the scenario to a little over 7 per cent by year three, a fall of more than 3 percentage points from peak to trough. This was driven by a combination of higher funding costs, significant credit losses and growth in risk weighted assets reflecting the deterioration in asset quality. Adding in the operational risk event, the aggregate CET1 ratio fell further to just below 6 per cent, driven by additional costs from customer compensation, redress, legal fees and fines.
CET1 capital ratio results Macroeconomic and operational risk scenario
Despite significant losses, these results nevertheless provide a degree of reassurance: banks remained above regulatory minimum levels in very severe stress scenarios. As importantly, these results have been estimated without assuming any management actions to respond to and mitigate the stress, such as equity raisings, repricing and cost cutting – all of which would occur in reality and lessen the impact. The results therefore represent if not a worst case scenario, then at least a scorecard towards one end of the spectrum of possible outcomes. Once we take into account expected (and plausible) management actions, the banks remain above the top of the capital conservation buffer throughout, and rebuild back towards unquestionably strong levels by the end of the recovery periods.
The funding and liquidity positions of the industry also stood up to the test. Despite difficulties accessing funding markets, most banks maintained their liquidity coverage ratios (LCRs) above 100 per cent through the crisis scenario. Some dropped below 100 per cent, but even then, those banks were able to initiate strategies to restore their position to good order within a reasonable timeframe. This is entirely consistent with how the LCR is intended to operate in severe conditions – liquidity is held in good times so it can be used when needed.
That general reassurance comes, however, with a note of caution. Like weather forecasting, stress testing is an inexact science. Modelling in Australia is complicated by a lack of experience of significant stress and periods of high loan defaults. This is a good problem to have, but it makes the stress testers’ task difficult, and widens the margin for error. That is particularly the case for the mortgages portfolio, and estimates of misconduct losses are of course necessarily judgement-based. In addition, the feedback loops from second order effects and competitor reactions are inherently difficult to model.
Given these challenges, stress testing needs to continue to evolve, and no one scenario can be relied upon for a definitive answer. In this vein, our 2016 exercise didn’t set a scenario at all, but instead asked the major banks to conduct a “reverse stress test”: to assume a fall in capital to minimum prudential levels, and estimate the scenarios that could have caused these outcomes.
The scenarios generated invariably included a macroeconomic downturn, compounded by a shock amplifier such as a cyber-security attack, mis-selling case or additional ratings downgrades. One bank assumed that it was last to market and couldn’t get an equity raising away, challenging a long-held belief that this cornerstone recovery action will always be available. The exercise was valuable primarily for broadening the stress testing imaginations of the participating banks, and reinforcing the importance of continuing to invest in capabilities.
This year, we will be assessing a range of banks’ stress testing capabilities through a review of internal capital adequacy processes (ICAAPs). Our review will focus on scenario development, internal governance and the use of stress testing to inform decision-making on appropriate capital buffers. In parallel, APRA and the industry will be subject to external examination: the IMF will be conducting a stress test of the Australian banking industry as part of its Financial Sector Assessment Programme (FSAP). We look forward to the results from this exercise, and to understanding what we can learn from their approach. Just as we expect banks to continue to invest in their modelling, data and capabilities, APRA will be reviewing its stress testing framework this year to identify areas for enhancement. We will also be preparing for the next industry stress test in our cycle, another opportunity to test resilience, explore vulnerabilities and challenge assumptions.
The 2018 results from the Federal Reserve bank stress testing are out, and as normal they include the results for all 35 named institutions, a laudable degree of transparency compared with the Australian version!
 The Fed says that all 35 Banks will be fine, even if stocks crash by 65%, the volatility index reaches 60, home prices fall 30% and commercial real estate drops 40% all at the same time.
They say that in the aggregate, the 35 firms would experience substantial losses under both the adverse and the severely adverse scenarios but could continue lending to businesses and households, due to the substantial accretion of capital since the financial crisis. So that’s alright then…
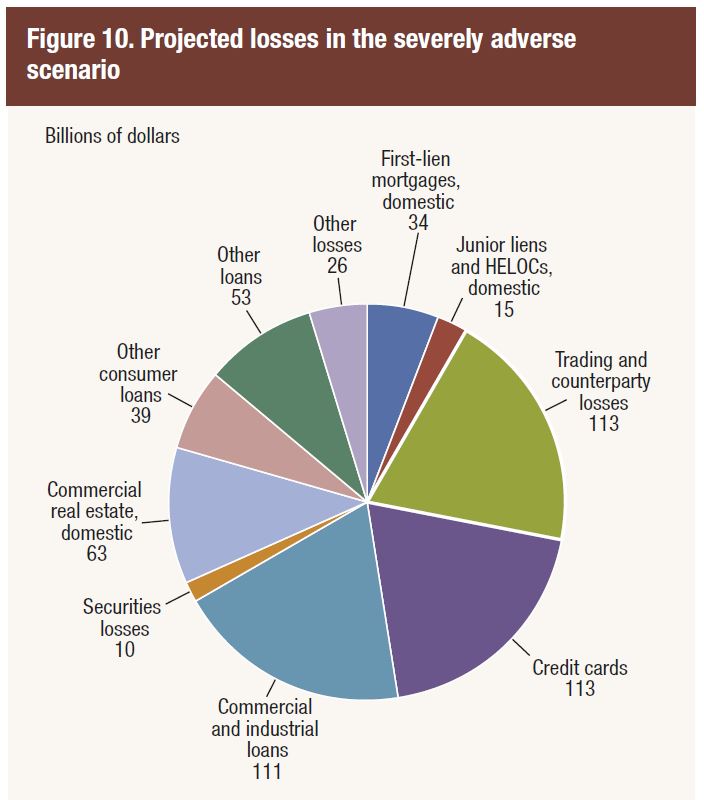
Aggregate losses at the 35 firms under the severely adverse scenario are projected to be US$578 billion and the net income before taxes is projected to be −US$139 billion.
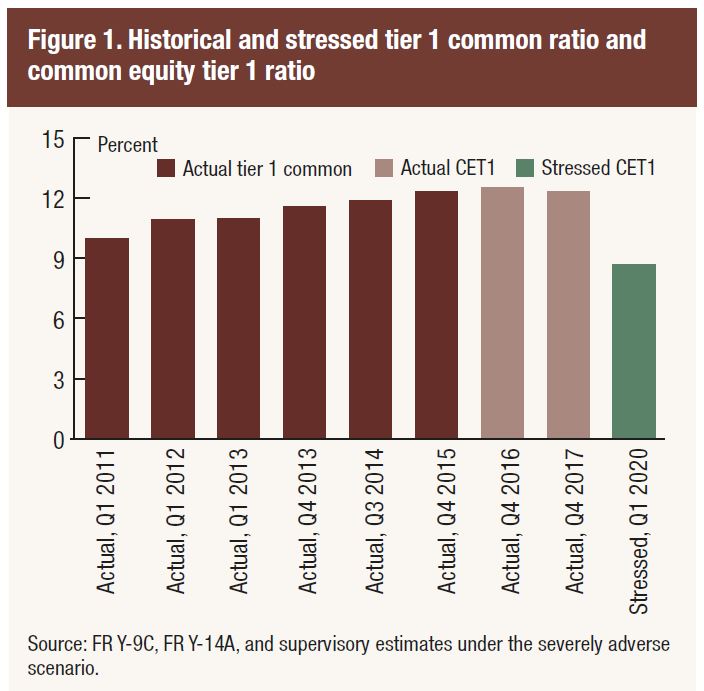
 The aggregate Common Equity Tier 1 (CET1) capital ratio would fall from an actual 12.3 percent in the fourth quarter of 2017 to its minimum of 7.9 percent over the planning horizon. Since 2009, the 35 firms have added about $800 billion in common equity capital.
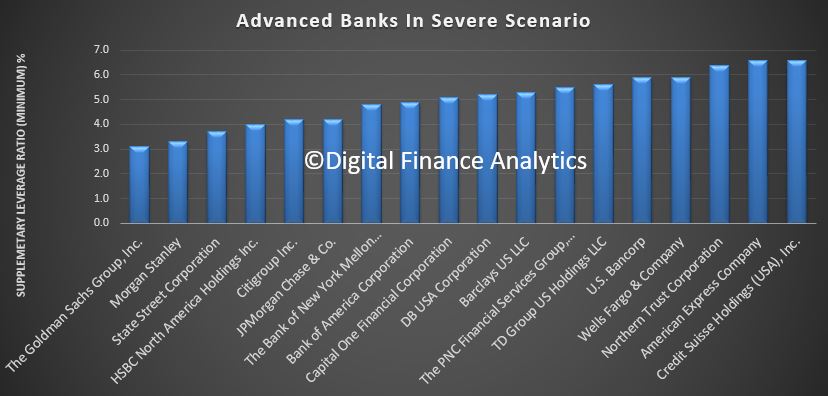
Goldman Sachs ended up with a Tier 1 minimum supplementary leverage ratio (SLR) of 3.1, just exceeding the required 3.0 minimum the Fed set for its annual capital plan, the lowest among participating banks. However, Morgan Stanley was next, at 3.3, then State Street at 3.7. The others were above 4.
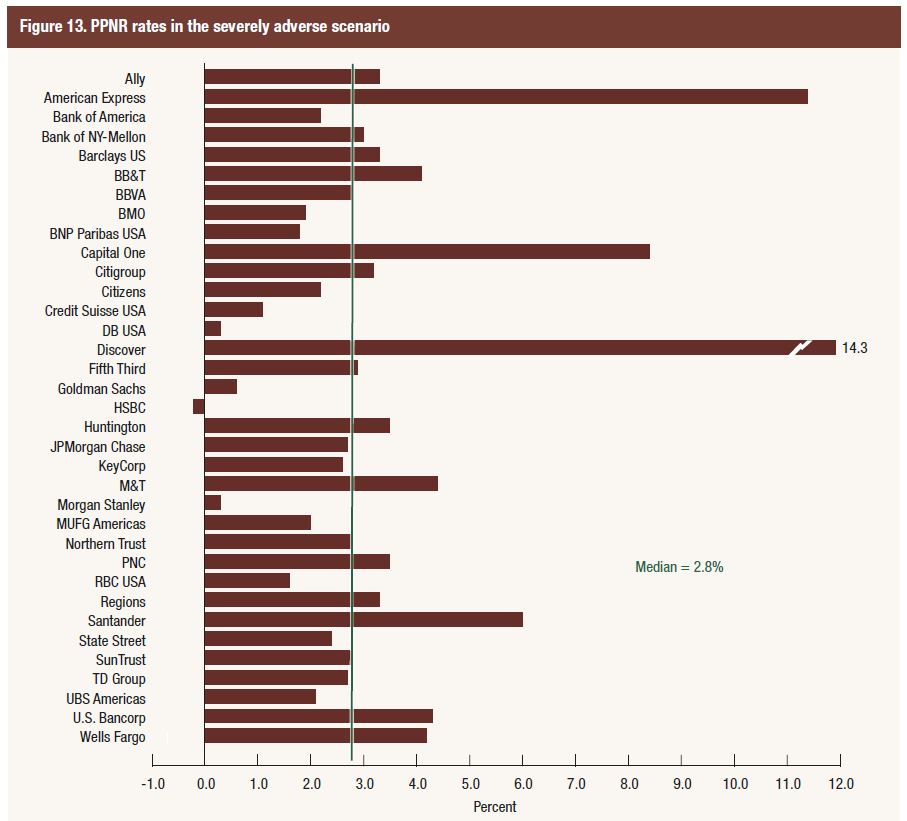
 Projected aggregate pre-provision net revenue (PPNR) is $492 billion, and net income before taxes is projected to be −$139 billion.
Some US outposts of European banks are most at risk in this analysis, together with some of the big investment banks.
 Some observations.
First, losses from trading and counter-party losses were estimated at $133 billion, stemming from 9 institutions, including $17.3 billion from Bank of America Corporation, $16.3 billion from Citigroup, $13.3 billion from Goldman Sachs, $29.4 billion from JP Morgan $29.4 billion, Morgan Stanley $11.7 billion and $12.2 billion from Wells Fargo.
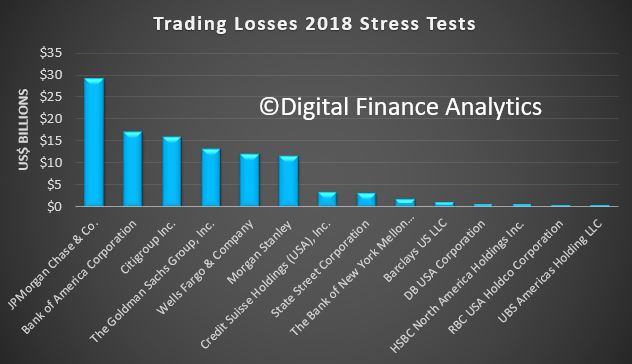 These estimate of losses are calibrated based on historical performance, but given the massive size of the derivatives market, this is just a best guess. We discussed the size and shape of the derivatives market recently in the $37 trillion dollar black hole.
Second, its hard to estimate the potential impact of contagion and freezing of the markets as happened into 2007, as each bank is modelled separately. This begs the question as to whether the system level modelling is robust enough. Especially if one major counter-party fell over during a crisis. 2007 showed the problem when trust across the markets falls, and margins widen significantly.
Third the assumptions are that things will revert to normal conditions in a few years – suggesting this is a “blip type crises.” Some of the smaller banks may have performed better in the tests than they would in the real world.
But the bottom line, according to the FED is that the banks can stand on their own two feet in the mother of all crises, so not excuse for any bail-out then… We will see.
That said, the analysis is the most comprehensive in the world. Its worth reading the detail.
The Federal Reserve has established frameworks and programs for the supervision of its largest and most complex financial institutions to achieve its supervisory objectives, incorporating the lessons learned from the 2007 to 2009 financial crisis and in the period since. As part of these supervisory frameworks and programs, the Federal Reserve assesses whether bank holding companies BHCs with $100 billion or more in total consolidated assets are sufficiently capitalized to absorb losses during stressful conditions, while meeting obligations to creditors and counterparties and continuing to be able to lend to households and businesses.
This annual assessment includes two related programs:
- Dodd-Frank Act supervisory stress testing is a forward-looking quantitative evaluation of the impact of stressful economic and financial market conditions on firms’ capital.
- The Comprehensive Capital Analysis and Review (CCAR) consists of a quantitative assessment for all firms, and a qualitative assessment for firms
that are LISCC or large and complex firms.For this year’s stress test cycle (DFAST 2018), which began January 1, 2018, the Federal Reserve conducted supervisory stress tests of 35 firms.
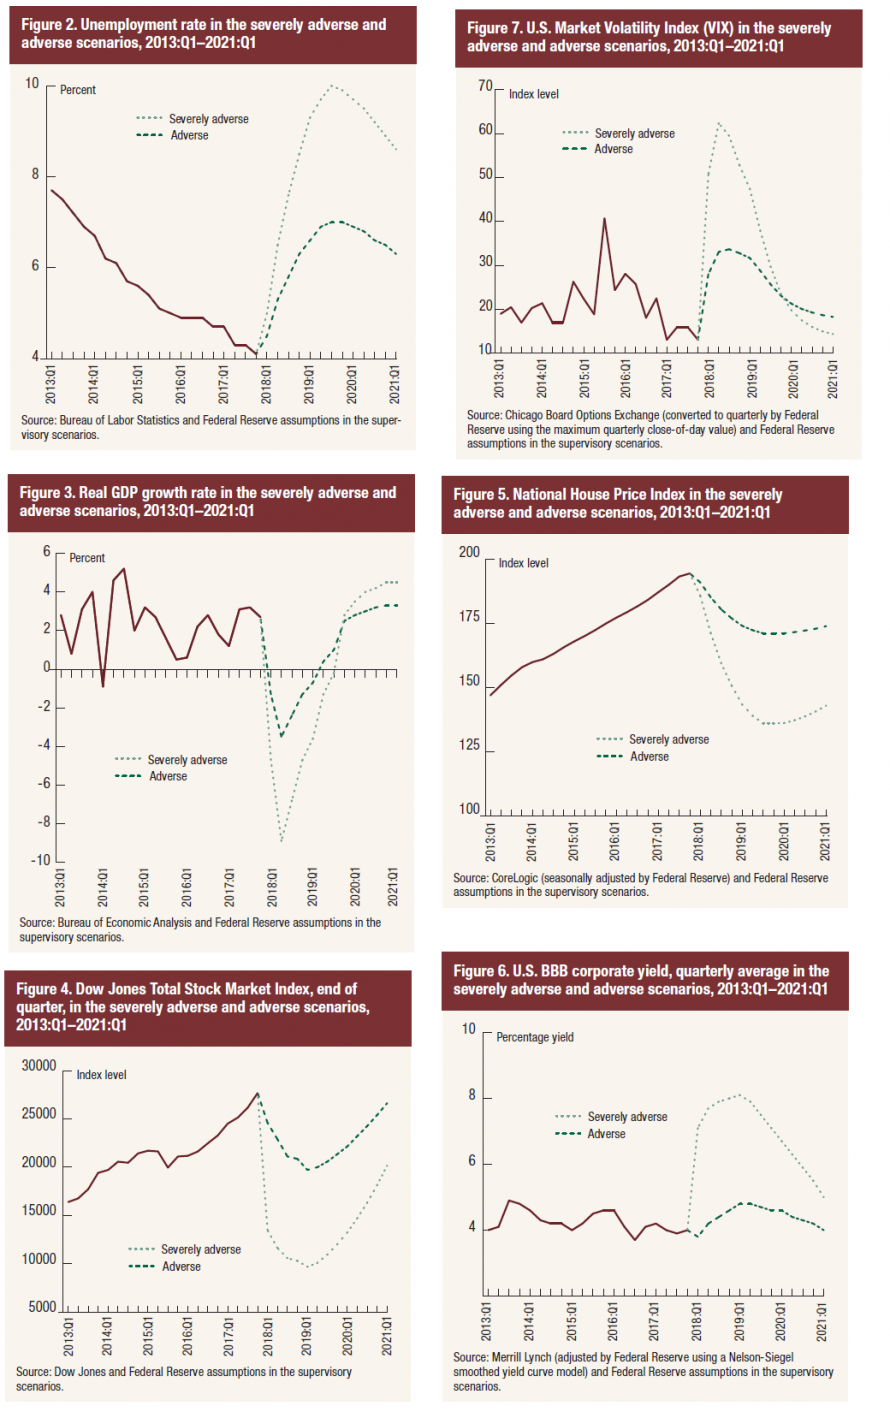
The adverse and severely adverse supervisory scenarios used in DFAST 2018 feature U.S. and global recessions. In particular, the severely adverse scenario is characterized by a severe global recession in which the U.S. unemployment rate rises by almost 6 percentage points to 10 percent, accompanied by a global aversion to long-term fixed-income assets. The
adverse scenario features a moderate recession in the United States, as well as weakening economic activity across all countries included in the scenario.In conducting its supervisory stress tests, the Federal Reserve calculated its projections of each firm’s balance sheet, risk-weighted assets (RWAs), net income, and resulting regulatory capital ratios under these scenarios using data on firms’ financial conditions and risk characteristics provided by the firms and a set of models developed or selected by the Federal Reserve. For DFAST 2018, the Federal Reserve updated the calculation of projected capital to reflect changes in the tax code associated with the passage of the Tax Cuts and Jobs Act (TCJA) in December 2017. As in past years, the Federal Reserve also enhanced some of the supervisory models to incorporate new data, where available, and to improve model stability and performance. The enhanced models generally exhibit an increased sensitivity to economic conditions compared to past years’ models.
The results of the DFAST 2018 projections suggest that, in the aggregate, the 35 firms would experience substantial losses under both the adverse and the severely adverse scenarios but could continue lending to businesses and households, due to the substantial accretion of capital since the financial crisis. Over the nine quarters of the planning horizon, which for DFAST 2018 begins in the first quarter of 2018 and ends in the first quarter of 2020, aggregate losses at the 35 firms under the severely adverse scenario are projected to be $578 billion. This includes losses across loan portfolios, losses from credit impairment on securities held in the firms’ investment portfolios, trading and counterparty credit losses from a global market shock, and other losses.
Projected aggregate pre-provision net revenue (PPNR) is $492 billion, and net income before taxes is projected to be −$139 billion. In the severely adverse scenario, the aggregate Common Equity Tier 1 (CET1) capital ratio would fall from an actual 12.3 percent in the fourth quarter of 2017 to its minimum of 7.9 percent over the planning horizon. The aggregate CET1 ratio is projected to rise to 8.7 percent by the end of the planning horizon.
In the adverse scenario, aggregate projected losses, PPNR, and net income before taxes are $333 billion, $467 billion, and $125 billion, respectively. The aggregate CET1 capital ratio under the adverse scenario would fall to its minimum of 10.9 percent over the planning horizon.
 Here are the scenarios.
The Basel Committee’s Working Group on Stress Testing has published a 66 page report “Supervisory and bank stress testing: range of practices“. APRA is mentioned several times through the report, most notably about the limited disclosure of results here, compared with some other countries. Also the scope and purpose of these tests vary considerably, and the extensions into macroprudential differs. So the approach, and outputs of stress testing are very different.
The report sets out a range of observed supervisory and bank stress testing practices with the aim of describing and comparing these practices and highlighting areas of evolution. The level of data reported on supervisory stress tests reflects the differing objectives and areas of focus across supervisors.
It draws on the results of two surveys completed during 2016: (i) a survey completed by Basel Committee member authorities (banking supervisors and central banks), which had participation of 31 authorities from 23 countries; and (ii) a survey completed by 54 respondent banks from across 24 countries, including 20 global systemically important banks (G-SIBs). Case studies, and other supervisory findings.
There are two fundamental types of supervisory stress tests: (1) those in which the supervisors collect data from the firms and then use their own models and scenarios to assess the performance of the firms under stress (referred to in this report as either “supervisor-run” or “top-down” tests), and (2) those in which the supervisors issue scenarios and guidance to the firms, which then run their own models and report the results to the supervisor (the “institution-run” or “bottom-up” tests).
A number of authorities now use stress tests specifically for capital adequacy assessment or to inform macroprudential policies such as the countercyclical capital buffer. In some cases, stress testing frameworks aim to address multiple objectives. For example, in Canada the macroprudential stress test outcomes inform ongoing supervisory work, such as capital adequacy assessments and risk identification, prioritisation, and measurement, as well as financial stability policy initiatives. Stress testing can also be used to facilitate communication with relevant domestic and foreign parties regarding the stability of the financial system.
In the US, supervisory estimates of post-stress capital ratios for each bank under adverse and severely adverse economic and financial conditions are publicly released along with detailed information on losses and revenues. In the EU, for all regular EU-wide stress test exercises hitherto, the EBA Board of Supervisors decided to publish the quantitative results at the bank-level and provide comprehensive granular data for several types of portfolios on a regular basis (eg sovereign portfolios and risk weights from internal models).
In contrast, for a number of countries, only aggregate-level results are published; often this is in the context of an FSAP review. For example, the Australian Prudential Regulation Authority (APRA) has traditionally disclosed only the aggregate results.
APRA do not impose capital requirements directly based on stress test results, but see stress testing as a strong tool to inform supervisors’ judgments of capital adequacy. Stress testing is also expected to be reflected in banks’ capital decisions, helping banks to set target surplus thresholds and fostering greater understanding of the dynamics between capital and risk.
APRA has used stress tests results to evaluate the adequacy of banks’ recovery planning. In particular, a bank’s management actions in a stress test scenario should be consistent with and linked closely to a bank’s recovery plan in order to be credible.
In 2014 and again in 2017, the Australian and New Zealand supervisory authorities completed a coordinated banking industry stress test. Although both countries had worked together for previous banking industry stress tests, the level of engagement increased in 2014 with close coordination and collaboration on scenario design, templates, analysis and outcomes.
There is a strong link between the banking sectors in Australia and New Zealand; the four major Australian banks have significant exposures to New Zealand and their subsidiaries dominate the New Zealand banking system.
APRA was responsible for the overall coordination and execution of the stress test. There was a common scenario and set of reporting templates covering Australia and New Zealand. Timing of all stages was closely coordinated. The Reserve Bank of New Zealand (RBNZ) provided challenge and input into the scenario and determined the specific economic parameters for New Zealand, which focused on additional agricultural risks. The RBNZ was responsible for analysing the results for New Zealand banks. Each authority engaged directly with the banks within their jurisdiction on queries and feedback throughout the process.
Ongoing engagement and communication was critical to the success of the exercise. Particular consideration was given to issues that differed between the two jurisdictions. At the highest level this involved ensuring that the economic parameters between Australia and New Zealand were realistic and consistent in a stressed environment. For example, there was discussion and challenge as to the relationship between interest rates in Australia and a corresponding level for interest rates in New Zealand.
Here is a summary of their overall observations:
Microprudential use of supervisory stress tests
Macroprudential use of supervisory stress tests
The Bank of England release their Financial Stability Report today, which includes the results of recent stress tests. Though the stress tests show that UK Banks could handle the potential losses in the extreme scenarios, the FPC is raising the UK counter cyclical buffer rate from 0.5% to 1% with binding effect from 28 November 2018. In addition buffers for individual banks will be reviewed in January 2018, to take account of the probability of a disorderly Brexit, and other risk factors hitting at the same time.
 They highlighted risks from higher LTI mortgage and consumer lending, and the potential impact of rising interest rates. They still have their 15% limit on higher LTI income mortgages (above 4.5 times). They are concerned about property investors in particular – defaults are estimated at 4 times owner occupied borrowers under stressed conditions! Impairment losses are estimated at 1.5% of portfolio.
Beyond this, they discussed the impact of Brexit, and potential impact of a disorderly exit.
Finally, from a longer term strategic perspective, they identified potential pressures on the banks (relevant also we think to banks in other locations). There were three identified , first competitive pressures enabled by FinTech may cause a greater and faster disruption to banks’ business models than they currently expect; next the cost of maintaining and acquiring customers in a more competitive environment could reduce the scope for cost reductions or result in greater loss of market share and third the future costs of equity for banks could be higher than the 8% level that banks expect either because of higher economic uncertainty or greater perceived downside risks.
Here is the speech and press conference.
The FPC’s job is to ensure that UK households and businesses can rely on their financial system through thick and thin. To that end, today’s FSR and accompanying stress tests address a wide range of risks to UK financial stability. And they will catalyse action to keep the system well‐prepared for potential vulnerabilities in the short, medium and long terms.
In particular, this year’s cyclical stress test incorporates risks that could arise from global debt vulnerabilities and elevated asset prices; from the UK’s large current account deficit; and from the rapid build‐up of consumer credit. Despite the severity of the test, for the first time since the Bank began stress testing in 2014 no bank needs to strengthen its capital position as a result.
Informed by the stress test and our risk analysis, the FPC also judges that the banking system can continue to support the real economy even in the unlikely event of a disorderly Brexit. At the same time, the FPC has identified a series of actions that public authorities and private financial institutions need to take to mitigate some major cross cutting financial risks associated with leaving the EU.
The Bank’s first exploratory scenario assesses major UK banks’ strategic responses to longer term risks to banks from an extended low growth, low interest rate environment and increasing competitive pressures enabled by new financial technologies. The results suggest that banks may need to give more thought to such strategic challenges.
The Annual Cyclical Stress Test
Today’s stress test results show that the banking system would be well placed to provide credit to households and businesses even during simultaneous deep recessions in the UK and global economies, large falls in asset prices, and a very large stressed misconduct costs. The economic scenario in the 2017 stress test is more severe than the deep recession that followed the global financial crisis. Vulnerabilities in the global economy trigger a 2.4% fall in world GDP and a 4.7% fall in UK GDP falls.
In the stress scenario, there is a sudden reduction in investor appetite for UK assets and sterling falls sharply, as vulnerabilities associated with the UK’s large current account deficit crystallise. Bank Rate rises sharply to 4.0% and unemployment more than doubles to 9.5%. UK residential and commercial real estate prices fall by 33% and 40%, respectively. In line with the Bank’s concerns over consumer credit, the stress test incorporated a severe consumer credit impairment rate of 20% over the three years across the banking system as a whole. The resulting sector‐wide loss of £30bn is £10bn higher than implied by the 2016 stress test.
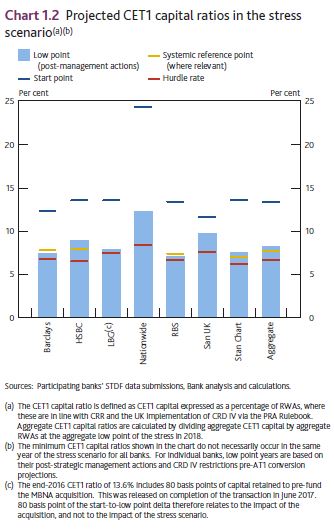
The stress leads to total losses for banks of around £50 billion during the first two years ‐ losses that would have wiped out the entire equity capital base of the banking system ten years ago. Today, such losses can be fully absorbed within the capital buffers that banks must carry on top of their minimum capital requirements. This means that even after a severe stress, major UK banks would still have a Tier 1 capital base of over £275 billion or more than 10% of risk weighted assets to support lending to the real economy.
This resilience reflects the fact that major UK banks have tripled their aggregate Tier 1 capital ratio over the past decade to 16.7%.
Countercyclical Capital Buffer
Informed by the stress test results for losses on UK exposures, the FPC’s judgement that the domestic risk environment—apart from Brexit—is standard; and consistent with the FPC’s guidance in June; the FPC is raising the UK countercyclical buffer rate from 0.5% to 1% with binding effect from 28 November 2018. In addition, as previously announced, capital buffers for individual banks will be reviewed by the PRC in January. These will reflect the firm‐specific results of the stress test, including the judgement made by the FPC and PRC in September. These buffers can be drawn on as necessary during a downturn to allow banks to support the real economy.
Brexit
There are a range of possible outcomes for the future UK‐EU relationship. Consistent with its remit, the FPC is focused on scenarios that, even if the least likely to occur, could have the greatest impact on UK financial stability. These include scenarios in which there is no agreement or transition period in place at exit. The 2017 stress test scenario encompasses the many possible combinations of macroeconomic risks and associated losses to banks that could arise in this event. As a consequence, the FPC judges that, given their current levels of resilience, UK banks could continue to support the real economy even in the event of a disorderly exit from the EU.
That said, in the extreme event in which the UK faced a disorderly Brexit combined with a severe global recession and stressed misconduct costs, losses to the banking system would likely be more severe than in this year’s annual stress test. In this case where a series of highly unfortunate events happen simultaneously, capital buffers would be drawn down substantially more than in the stress test and, as a result, banks would be more likely to restrict lending to the real economy, worsening macroeconomic outcomes. The FPC will therefore reconsider the adequacy of a 1% UK countercyclical capital buffer rate during the first half of 2018, in light of the evolution of the overall risk environment. Of course, Brexit could affect the financial system more broadly. Consistent with the Bank’s statutory responsibilities, the FPC is publishing a checklist of steps that would promote financial stability in the UK in a no deal outcome.
It has four important elements:
– First, ensuring that a UK legal and regulatory framework for financial services is in place at the point of leaving the EU. The Government plans to achieve this through the EU Withdrawal Bill and related secondary legislation.
– Second, recognising that it will be difficult, ahead of March 2019, for all financial institutions to have completed all the necessary steps to avoid disruption in some financial services. Timely agreement on an implementation period would significantly reduce such risks, which could materially disrupt the provision of financial services in Europe and the UK.
– Third, preserving the continuity of existing cross‐border insurance and derivatives contracts. Domestic legislation will be required to achieve this in both cases, and for derivatives, corresponding EU legislation will also be necessary. Otherwise, six million UK insurance policy holders with £20 billion of insurance coverage, and thirty million EU policy holders with £40 billion in insurance coverage, could be left without effective cover; and around £26 trillion of derivatives contracts could be affected. HM Treasury is considering all options for mitigating these risks.
– Fourth, deciding on the authorisations of EEA banks that currently operate in the UK as branches. Conditions for authorisation, particularly for systemic firms, will depend on the degree of cooperation between regulatory authorities. As previously indicated, the PRA plans to set out its approach before the end of the year. Irrespective of the particular form of the United Kingdom’s future relationship with the EU, and consistent with its statutory responsibility, the FPC will remain committed to the implementation of robust prudential standards. This will require maintaining a level of resilience that is at least as great as that currently planned, which itself exceeds that required by international baseline standards.Biennial Exploratory Scenario
Over the longer term, the resilience of UK banks could also be tested by gradual but significant changes to business fundamentals. For the first time, the FPC and PRC have examined the strategic responses of major UK banks to an extended low growth, low interest rate environment combined with increasing competitive pressures in retail banking from increased use of new financial technologies. FinTech is creating opportunities for consumers and businesses, and has the potential to increase the resilience and competitiveness of the UK financial system as a whole. In the process, however, it could also have profound consequences for the business models of incumbent banks. This exploratory exercise is designed to encourage banks to consider such strategic challenges. It will influence future work by banks and regulators about longer‐term issues rather than informing the FPC and PRC about the immediate capital adequacy of participants.
Major UK banks believe they could, by reducing costs, adapt to such an environment without major changes to strategy change or by taking more risk. The Bank of England has identified clear risks to these projections:
– Competitive pressures enabled by FinTech may cause a greater and faster disruption to banks’ business models than they currently expect.
– The cost of maintaining and acquiring customers in a more competitive environment could reduce the scope for cost reductions or result in greater loss of market share.
– The future costs of equity for banks could be higher than the 8% level that banks expected in this scenario either because of higher economic uncertainty or greater perceived downside risks.Conclusion
The FPC is taking action to address the major risks to UK financial stability. Given the tripling of their capital base and marked improvement in their funding profiles over the past decade, the UK banking system is resilient to the potential risks associated with a disorderly Brexit.
In addition, the FPC has identified the key actions to mitigate the impact of the other major cross cutting issues associated with a disorderly Brexit that could create risks elsewhere in the financial sector.
And on top of its existing measures to guard against a significant build‐up of debt, the FPC has taken action to ensure banks are capitalised against pockets of risk that have been building elsewhere in the economy, such as in consumer credit.
As a consequence, the people of the United Kingdom can remain confident they can access the financial services they need to seize the opportunities ahead.
Moody’s says on 17 November, the European Banking Authority (EBA) set out its draft methodology for a new round of stress tests that the European Union’s 49 biggest banks must undergo next year. The inclusion of IFRS 9 will lower Tier 1 equity, under stress by an estimated 50-60 basis point.
Similar to the 2016 stress tests, the 2018 exercise will examine banks’ resilience to both base-case and stressed-case scenarios over a three-year horizon, based on a common methodology and prescribed macro-economic scenario parameters. The EBA test will again abstain from setting a minimum capital threshold below which a bank would fail, as in 2014. However, even without set hurdles, the market will benchmark the adverse scenario results, expressed in stressed capital ratios, against banks’ minimum capital requirements, and thereby single out the weaker performers.
The first-time inclusion of International Financial Reporting Standard 9 (IFRS 9), a new accounting rule that takes effect 1 January 2018, will make next year’s stress test tougher than the last one and will likely translate into greater provisioning needs and therefore lower common equity Tier 1 ratios in the prescribed stress-case scenario. The new rules demand that banks set aside higher loan-loss provisions further in advance of default, which is credit positive for banks. While we expect that the initial effect of IFRS 9 will be limited, and therefore digestible for most EU banks, risk provisioning requirements under simulated stressed market conditions will likely be greater using the IFRS 9 rules. However, the size of provisioning will also strongly depend on the macroeconomic scenario assumptions that have yet to be published.
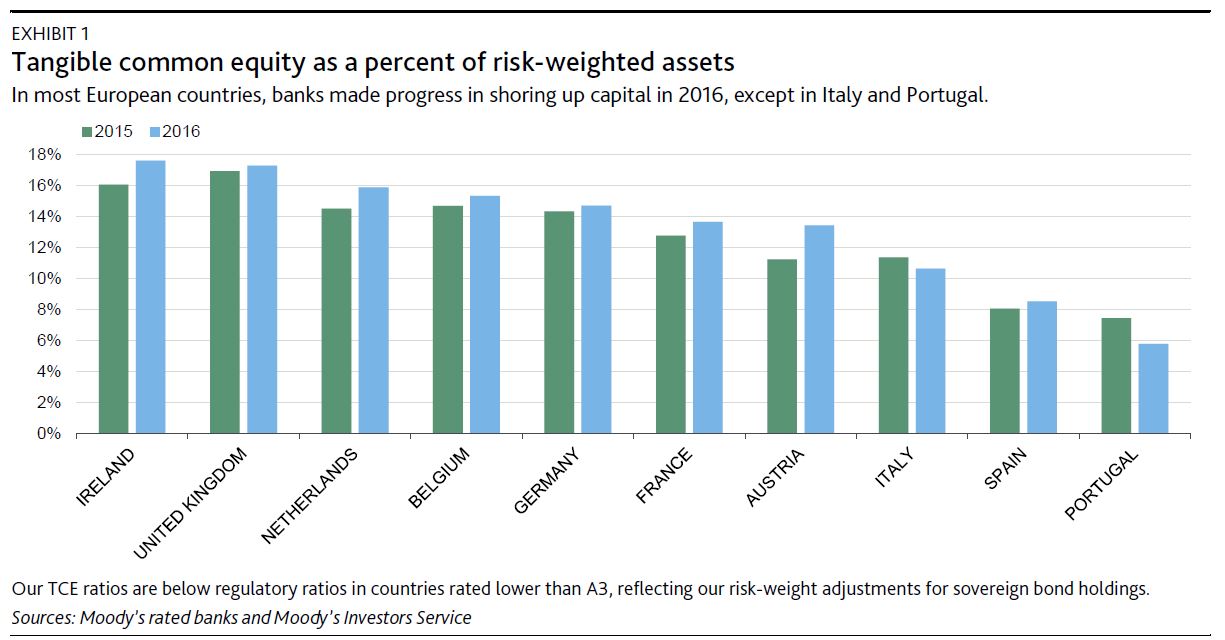
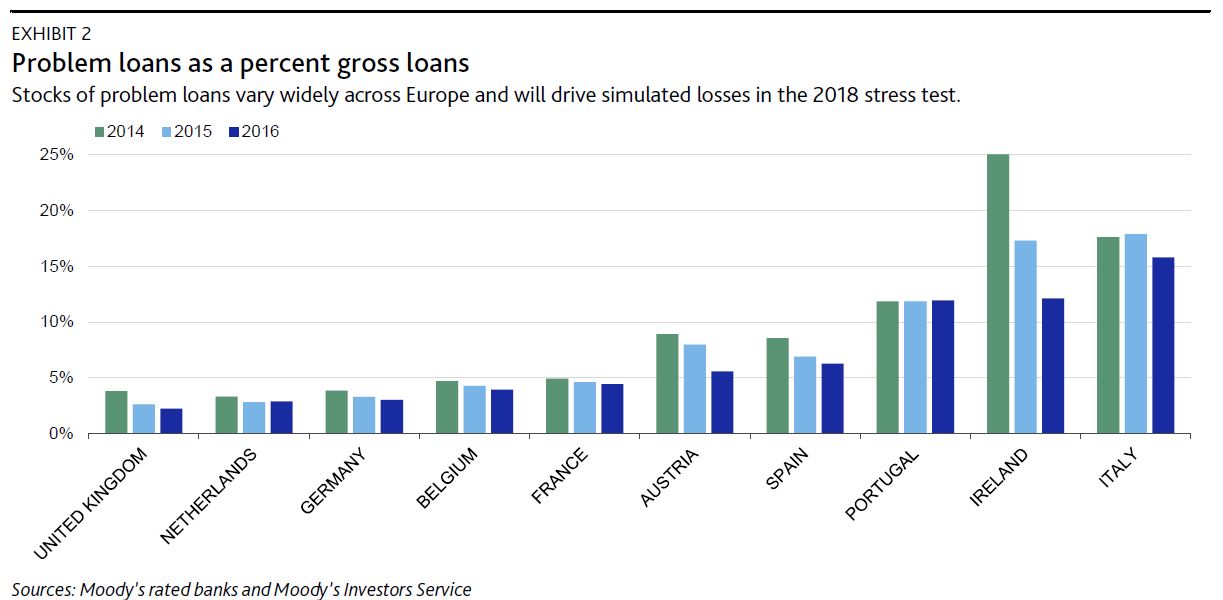
Our expectation of a limited initial effect of IFRS 9 is based on our projection of a 50-60 basis point decline in the ratio of common equity Tier 1 to risk-weighted assets for many European banks. However, we also expect that the initial effect will vary across regions. When additionally taking into account varying stating-point capital levels, capital ratios of banking systems starting from a weak position, including Italy and Portugal, are more at risk of stressed capital ratios falling closer to (or even below) the applicable minimum requirements (see Exhibit 1).
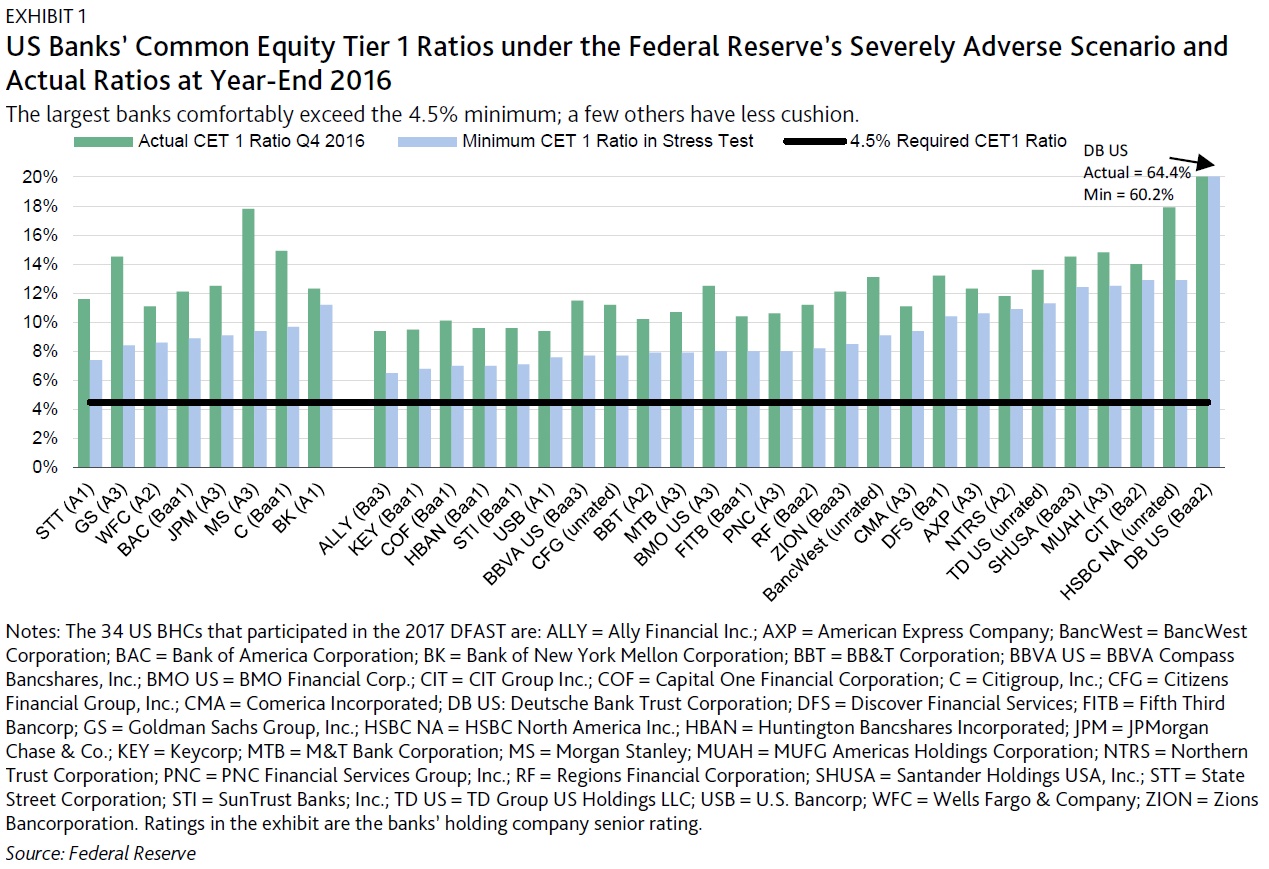
In the EBA’s 2018 stress test, the initial effect on capital ratios will likely be amplified when simulating stressed economic conditions. Europe’s weaker banking systems with relatively large but still performing portfolios that have deteriorated over time will experience greater capital effects under the new rules than banks that benefitted from systemwide asset quality improvements amid benign credit conditions in recent years. Such quality improvements have resulted in low nonperforming exposures in a number or European countries, including France, Germany and the UK (see Exhibit 2).
The objective of the 2018 stress test is to assess the resilience of EU banks and banking systems to shocks. The results will inform the supervisory review and evaluation process, the European Central Bank’s annual in-depth evaluation of each bank’s risk exposure. This evaluation forms the basis of the regulators’ decisions on bank-specific minimum capital requirements for the subsequent year
Last Thursday, the US Federal Reserve published the results of the 2017 Dodd-Frank Act stress test (DFAST) for 34 of the largest US bank holding companies (BHCs), all of which exceeded the 4.5% minimum required common equity Tier 1 (CET1) capital ratio under the Fed’s severely adverse stress scenario, a credit positive.
This is the third consecutive year that all tested BHCs exceeded the Fed’s minimum requirement, and the median margin above the minimum also increased. However, for the first time, this year’s test incorporated the supplementary leverage ratio (SLR) for advanced-approach banks, which was more constraining for some of the banks.
DFAST considers how well banks withstand a severely adverse economic scenario, which is characterized as a severe global recession. The 2017 test scenario used modestly more favorable interest rates than in 2016 with a greater increase in rates and no negative short-term rates. The test incorporated a 6.5% peak-to-trough decline in US real gross domestic product, an increase in the unemployment rate to 10%, a 50% decline in equity prices through year-end 2017, and a 25% drop in home prices and a 35% decline in commercial real estate prices by 2019.
All 34 BHCs were subjected to this scenario, including new participant CIT Group Inc. In addition, the stress tests for eight of the 34 BHCs with substantial trading or processing operations were required to incorporate the sudden default of their largest loss-generating counterparty. The eight BHCs subject to the counterparty default component were Bank of America Corporation, The Bank of New York Mellon Corporation, Citigroup Inc., The Goldman Sachs Group, JPMorgan Chase & Co. Morgan Stanley, State Street Corporation, and Wells Fargo & Company. Finally, six of these eight BHCs with significant trading operations were also required to include a global market shock (Bank of New York Mellon Corporation and State Street Corporation were excluded from this global market shock scenario.)
On 28 June, the Fed will release the results of the Comprehensive Capital Analysis and Review (CCAR), which evaluates the BHCs’ capital plans, including dividends and stock repurchases, incorporating their DFAST results. The capital-planning processes of the large complex banks will also be publicly evaluated. Prior to the CCAR release, BHCs can reduce their planned capital distributions, commonly known as taking a “mulligan.” Our analysis of pre-provision net revenue declines and loan losses under the severely adverse scenario highlights still significant tail risks for DFAST participants. Nonetheless, we expect banks’ capital distribution requests to be more aggressive than in prior years, which will limit or negate improvement in their capital ratios.
ALL BANKS EXCEED MINIMUM REQUIRED CAPITAL IN THE SEVERELY ADVERSE SCENARIO
Exhibit 1 compares the minimum CET1 ratios of 34 participating BHCs under the Fed’s severely adverse scenario with their actual CET1 ratios reported at year-end 2016. The exhibit segments the BHCs into two groups: the 26 BHCs subject only to the severely adverse economic scenario (on the right), and the eight BHCs also subject to the additional global market shock and counterparty default components noted above (on the left). The minimum CET1 ratios of the eight large BHCs are all comfortably above the Fed’s 4.5% requirement despite being subjected to the additional stress components. The other 26 BHCs are also above the 4.5% requirement, although for many the margin is smaller than for the largest BHCs. The lowest minimum ratios were for Ally Financial Inc. at 6.6%, up from 6.1% in the 2016 test; and KeyCorp at 6.8%, up from 6.4% in 2016.
Even though all of the BHCs passed the 4.5% minimum threshold, many would still take sizeable capital hits under the Fed’s severely adverse scenario (Exhibit 2). The estimated declines in the BHCs’ CET1 ratios range from a high of 840 basis points (bp) for Morgan Stanley to a low of 210 bp for Santander Holdings USA, Inc.. Positively, the median of the 34 banks was narrower at 280 bp compared with 350 bp last year, indicating greater overall resilience to an economic shock. In its report, the Fed partly attributed this to lower losses from changes in the banks’ portfolio composition and risk characteristics.
 SUPPLEMENTARY LEVERAGE RATIO IS A GREATER CONSTRAINT FOR SOME BANKS
The BHCs’ generally good results for stressed CET1 ratios in DFAST suggests that increased capital distributions are likely for the vast majority of institutions. However, CET1 is not the most constraining ratio for all banks. In particular, this year’s test for the first time incorporated the supplementary leverage ratio (SLR) for the advanced approach banks (Exhibit 3). Because the denominator of the SLR comprises average assets and off-balance sheet exposures, it tends to be much larger than the risk-weighted asset denominator of CET1, with the result that the banks’ margin above the 3% minimum SLR is smaller. Morgan Stanley had the lowest minimum SLR of 3.8%, which is likely to constrain its efforts to return more capital to shareholders. State Street and Goldman Sachs also had comparatively low minimum SLRs.
Last Wednesday, the European Banking Authority (EBA) began the process of stress testing Europe’s largest banks in an effort to assess their individual capital adequacy under stressed conditions. The publication of a draft stress test methodology coincided with the announcement of the resolution of Spain’s Banco Popular Espanol, a bank that fared relatively well in the 2016 stress test results published 10 months ago.

The draft stress test methodology and the timing of its publication convey two key messages for European Union (EU) banks andinvestors. First, the stress test for 2017-18 will be tougher, given that it will include the new accounting rule known as International Financial Reporting Standard (IFRS) No. 9, which requires that banks set aside provisions on all loans in advance of default. Second, notwithstanding EU supervisors’ efforts to harmonise rules and enhance stress testing, Banco Popular’s failure has revealed once more the principal limitations of stress testing in signalling potential failures, which has resulted in scepticism toward the exercise.
The 2018 stress test will once again look at the effect of macroeconomic stress on a bank’s viability, taking into account market risk and litigation risk. Additionally, the test will include simulations of risk charges under IFRS 9 of expected credit losses. IFRS 9 addresses the issue of loan-loss provisions being “too little and too late,” something regulators identified as a shortcoming that amplified the 2007-09 banking crisis. The accounting change will require banks to model credit risk losses for loans even before they have defaulted, and increase the level of provisions as they start to deteriorate.
Considering that banks must use IFRS 9 starting in January 2018, the inclusion of the new rule in the next stress test is not surprising. However, its potential effect on banks’ capital in the stress test is opaque given the difficulty in estimating stressed simulated risk provisions that must be based on a new accounting concept ahead of its implementation deadline. However, incremental risk provisioning under IFRS 9 will focus on loans that show deterioration in borrowers’ credit quality since inception of the loan. Therefore, we expect banks that are challenged by low growth and persistent asset quality pressures will be more affected. Although the stress test again will not involve a pass-or-fail decision benchmarked against a hurdle rate, the 2018 stress test is still likely to force some banks to hold more capital.
With the resolution of Banco Popular, whose subordinated creditors were bailed-in and their investment effectively wiped out, we expect that the EBA’s 2018 stress test again will single out weak candidates, but the results still may not reliably predict the next failure. Although the 2016 stress test formally identified Banco Popular as the weakest among the six participating Spanish banks, it was by no means among the most vulnerable candidate when taking into account a capital measure undertaken shortly after the year-end 2015 cut-off date for the test. The bank reported a relatively weak common equity Tier 1 ratio of 7.0% in the adverse scenario, but, adjusted for a €2.5 billion rights issue that had been concluded by the time the results were published, the bank’s result ranked second-best in the Spanish peer group, with a solid 10% pro forma result.
An important IMF working paper, released today suggests that the standard stress test models used to assess risks in the banking system are likely to underestimate the impact of stress on bank solvency and financial stability because they do not consider the dynamics between solvency and funding costs.

The global financial crisis appears to have been a liquidity crisis, not just a solvency crisis. Yet the failure to adequately model interlinkages and the nexus between solvency risk and liquidity risk led to a dramatic underestimation of risks. Liquidity risk manifests primarily through a liquidity crunch as firms’ access to funding markets is impaired, or a pricing crunch, as lenders are unwilling to lend unless they receive much higher spreads.
A sudden increase in bank funding costs can have an adverse impact on financial stability through the depletion of banks’ capital buffers. To preserve financial stability, it is important to assess banks’ vulnerability to changes in funding costs. The reason is twofold. First, to the extent funding costs reflect counterparty credit risk, it is of particular interest for supervisors to determine the level of capital buffers that should be held to keep funding costs at bay if and when market conditions deteriorate. Second, funding costs are linked not only to banks’ initial capital position but also they determine their capital position going forward, paving the way for adverse dynamics. The magnitude of this effect is likely to depend on the bank’s behavioral reaction to rising funding costs. On the one hand, it may react by setting higher lending rates to its borrowers. Yet this action reduces the bank’s market share and its franchise value. On the other hand, the bank might not be able to passthrough additional funding costs to new lending so its internal capital generation capacity is reduced. Even if some pass-through is possible, the erosion of profits is likely to be
substantial given the shorter time to repricing of liabilities relative to assets with the margin impact on the carrying values of assets outweighing that of new asset generation.“Bank Solvency and Funding Cost: New Data and New Results” presents new evidence on the empirical relationship between bank solvency and funding costs. Building on a newly constructed dataset drawing on supervisory data for 54 large banks from six advanced countries over 2004–2013, we use a simultaneous equation approach to estimate the contemporaneous interaction between solvency and liquidity. Our results show that liquidity and solvency interactions can be more material than suggested by the existing empirical literature. A 100 bps increase in regulatory capital ratios is associated with a decrease of bank funding costs of about 105 bps. A 100 bps increase in funding costs reduces regulatory capital buffers by 32 bps. We also find evidence of non-linear effects between solvency and funding costs. Understanding the impact of solvency on funding costs is particularly relevant for stress testing. Our analysis suggests that neglecting the dynamic features of the solvency-liquidity nexus in the 2014 EU-wide stress test could have led to a significant underestimation of the impact of stress on bank capital ratios.
The results are also highly relevant for cost impact assessments of capital regulation, as the costs of higher capital requirements are partly offset by lower debt servicing costs.
Note: IMF Working Papers describe research in progress by the author(s) and are published to elicit comments and to encourage debate. The views expressed in IMF Working Papers are those of the author(s) and do not necessarily represent the views of the IMF, its Executive Board, or IMF management.


