NZ’s plan for deposit insurance falls well short of protecting people’s savings

From The Conversation.

The New Zealand government’s plan to introduce deposit insurance is a welcome step. Last week, finance minister Grant Robertson announced a new deposit protection regime to make the banking system safer for customers and to strengthen accountability for banks’ actions.

Worldwide, 143 countries have deposit insurance schemes, and New Zealand has long been an outlier. It is high time one was introduced.

How deposit insurance works

Currently, if a bank fails in New Zealand, depositors could lose all or some of their savings. Deposit insurance would change that and protect depositors’ savings. It operates like other types of insurance. If disaster strikes and a bank fails, depositors’ savings would be repaid up to a set limit.

According to Reserve Bank data, New Zealand households store about NZ$177.98 billion of their cash resources in banks. The proposed plan is important for all New Zealanders. Most people with a bank account are retail depositors and may be unaware of the vulnerable position they could find themselves in.

Under the Reserve Bank’s controversial open bank resolution policy, if a bank is distressed and under statutory management, part of a retail depositor’s savings may be frozen and used to recapitalise the bank, if shareholder and subordinated creditor funds prove insufficient. Essentially, New Zealand retail depositors would have to bail out their banks, unlike retail depositors in other countries who are protected by deposit insurance up to a set limit.

Apart from protecting depositors, the insurance helps to maintain stability in the financial system. It operates primarily to stop bank runs where depositors, afraid that they will lose their money, all demand repayment at once. Images of people lining up outside banks and at ATM machines all trying to get their money out were a feature of the 2007-2008 Global Financial Crisis (GFC). If people are confident that they will get their money back quickly from deposit insurance, they do not need to “run” on their banks.

Banks own the money you deposit

Depositors are vulnerable because once their money is with a bank, it no longer legally belongs to them. It belongs to the bank which can use it for its own commercial purposes. Typically, banks will lend this money to individuals and businesses (for example, through mortgages), making a profit by charging interest. In return, depositors get the right to repayment of their savings on demand.

Banks have fragile business models because they borrow short (through deposits which are repayable on demand) and lend long (through mortgages and other loans that are repayable at a fixed date in the future). Banks do not hold sufficient funds to repay all, or even most, of their depositors at once. Bank regulation provides some protection because banks are required to maintain certain levels of capital and liquidity, but if depositors panic and enough of them demand repayment, a bank can very quickly become insolvent.

Problems in one bank can pass to other banks and from banks to other types of businesses like a virus (this process is known as contagion). Eventually, this can build up to a financial crisis and lead to a recession, just as the GFC did in New Zealand and in many other countries. In a recession, almost everyone suffers, but the burden often falls most heavily on the poorest in society who have few assets to fall back on.

Protecting people and businesses

Retail depositors provide the bulk of bank funding in New Zealand (more than 60% of bank funding comes from households) and they currently carry a degree of risk of bank failure but are not properly protected by the law.

The Reserve Bank has traditionally opposed deposit insurance because of “moral hazard”. Their argument has been that protecting retail depositors from bank failure would discourage depositors from monitoring and disciplining their banks by withdrawing their savings if banks engage in overly risky activities.

This argument is based on the premise that retail depositors are capable of monitoring their banks, which requires a high level of financial literacy. The weakness in this argument was exposed during the GFC when New Zealand was forced to establish a temporary deposit guarantee scheme to reassure depositors that their savings were safe. Other countries, like the UK, recognise this vulnerability and provide an appropriate level of deposit insurance.

The New Zealand government has proposed a limit of between NZ$30,000 and NZ$50,000, saying that this would cover up to 90% of depositors. But this is well below the limits set by other comparable countries. For example, the limit is about NZ$374,000 in the US, NZ$114,000 in Canada, NZ$161,000 in the UK and NZ$262,000 in Australia.

If the limit is too low, the risk is that the deposit insurance scheme will not stop bank runs and not protect financial stability and the economy. It could even cause pre-emptive bank runs. If that happened, the government would need to urgently increase the deposit insurance limit and take other extraordinary measures, but this can lead to other difficulties, including increased overall costs, which ultimately fall back on the taxpayer.

Defining the best limit

One rule of thumb says the limit should be two to three times a country’s per-capita GDP. For New Zealand, this would mean between NZ$100,000 and NZ$150,000.

The government should be given credit for raising the issue of deposit insurance – a scheme should have been introduced years ago. But the low limit was proposed without public consultation. That is wrong.

The deposit insurance limit should not be decided solely by the Reserve Bank and Treasury. Other stakeholders have an important and valuable contribution to make. The debate should be transparent and well informed.

The second phase of the current review of the Reserve Bank Act will look at how a deposit insurance scheme should be funded. It should also include public consultation on the optimal level of deposit insurance. Having finally got the issue on the table, we should not squander the opportunity to do something important for New Zealanders.

Author: Helen Mary Dervan, Senior lecturer in law BCL(Oxon), TEP, Auckland University of Technology


The Lowdown on Libra

Cryptocurrencies have become a global phenomenon in the past few years. Now Facebook is launching it’s own cryptocurrency, in association with Visa, MasterCard, Uber and others. The stated aim of Libra is to “enable a simple global currency and financial infrastructure that empowers billions of people”. Via The Conversation.

The announcement has sparked fears that Libra could be a threat to traditional banks, warnings to be cautious, and sceptical commentary of claims that it will help developing countries.

But let’s go back to the basics and look at what Libra is, how it compares to other cryptocurrencies and whether you should be concerned about using it when it eventually arrives.

What is a cryptocurrency?

Currency is a system of money that is commonly used in exchange for goods and services and, as a result, holds value. Cryptocurrencies are digital currencies that are secured using cryptography.

The more popular recent cryptocurrencies are based on blockchain technology which uses a cryptographic structure that is difficult to change. One of the key properties of this structure is a distributed ledger that keeps account of financial transactions, which anyone can access.

What is Libra?

Libra is a new currency that is being proposed by Facebook. It’s considered a cryptocurrency because cryptography will be used to help protect the value of the currency from tampering – such as double spending – and to protect the payment process.

Libra has the potential to become successful because of the backing from the Libra Association, which is made up of large international corporations such as Facebook, Uber and Vodafone. MasterCard and Visa have also thrown their hats in the ring, but no traditional banks are on the list.

What’s different about Libra compared with other cryptocurrencies like Bitcoin?

Cryptocurrencies like Bitcoin and Ethereum are quite egalitarian in nature. That’s because there is no single authority that verifies transactions between parties, so anyone could potentially do it.

To authorise a Bitcoin transaction you would have to prove that you have done the work, known as a “proof of work”. For Bitcoin, the proof of work is to solve a mathematical puzzle. People who successfully solve the puzzle (proving they have done some work), can add transactions to the blockchain distributed ledger and are rewarded with Bitcoins. The process is known as mining.

The good thing about this is that it reduces fraud. Since anyone can potentially mine Bitcoins, it’s harder to collude as you wouldn’t know who the next person to mine a coin would be. And it’s simple to verify that the person is authorised because anyone can check that the puzzle has been solved correctly.

Based on the initial descriptions of the currency, it sounds like the difference with Libra is that it will verify transactions using a consensus system known as “proof of stake”, or a variation of this method. Under this system, transactions would be authorised by a group of people who have a stake or ownership in the currency.

This makes it easier to predict who the next person to authorise a transaction might be (since there are a relatively small number of authorising group members), and then collude to launder funds without other group members knowing.

It appears the criteria to become a founding member of the Libra Association is to contribute a minimum of US$10 million entrance fee, have a large amount of money in the bank and be able to influence a large number of people.

What are banks and regulators worried about?

Cryptocurrencies affect governments and tax systems since they have little to no transaction costs when money is transferred across borders. So while the low transaction costs would be good for everyday users, the advent of a new cryptocurrency with a potentially very large user base has governments and traditional banks very concerned.

While Libra is open source – meaning the source code is available for all to view, use and modify – it’s the members of the association who will be overseeing the currency. Libra could herald a shift away from traditional government taxes and banking fees to a new international monetary system controlled by corporate entities like Facebook and Uber. That’s a concern because of the lack of oversight from regulatory bodies.

What should everyday people expect from Libra?

The backing of software giants means it’s likely that the user interface for Libra coins would be smooth and simple to use.

Low transaction costs would benefit users and the Libra Association promises to control the value of the currency so that it does not fluctuate as much as other cryptocurrencies. It’s unclear how they plan to do this. But value stability would be a great advantage in times of uncertainty.

What are the risks?

The everyday consumer probably wouldn’t know the difference between the “proof of work” and the “proof of stake” mechanisms. But since Facebook has a large database of users that are known to use Libra, it may be able to link Libra transactions to individuals. This could be a privacy concern. (Bitcoin transactions are anonymous because account numbers used in Bitcoin transactions are not linked to an individual’s identity.)

Recent cybersecurity breaches have contributed to a growing awareness of the vulnerabilities of IT systems. As with all software, the Libra implementation and management could be vulnerable to attack, which in turn could mean users could lose their money. But that is a risk that all cryptocurrency users face, whether they are aware of it or not.

What steps could consumers take to protect themselves?

No matter what cryptocurrency you choose to use, your funds are still accessible through the same interfaces: a web page or a mobile app. And the way you control access to your personal funds is by authenticating with a password.

Make sure you keep your password safe by making sure it is complicated and hard to guess. Look for applications that allow you to use two-factor authentication and make sure it’s turned on.

Libra is yet to prove its claims of making financial transactions safe and convenient. Only time will tell if its uptake will become widespread following its expected launch next year.

Author: Ernest Foo, Associate Professor, Griffith University

Australia’s still building 4 in every 5 new houses to no more than the minimum energy standard

New housing in Australia must meet minimum energy performance requirements. We wondered how many buildings exceeded the minimum standard. What our analysis found is that four in five new houses are being built to the minimum standard and a negligible proportion to an optimal performance standard. Via The Conversation.

Before these standards were introduced the average performance of housing was found to be around 1.5 stars. The current minimum across most of Australia is six stars under the Nationwide House Energy Rating Scheme (NatHERS).

This six-star minimum falls short of what is optimal in terms of environmental, economic and social outcomes. It’s also below the minimum set by many other countries.

There have been calls for these minimum standards to be raised. However, many policymakers and building industry stakeholders believe the market will lift performance beyond minimum standards and so there is no need to raise these.

What did the data show?

We wanted to understand what was happening in the market to see if consumers or regulation were driving the energy performance of new housing. To do this we explored the NatHERS data set of building approvals for new Class 1 housing (detached and row houses) in Australia from May 2016 (when all data sets were integrated by CSIRO and Sustainability Victoria) to December 2018.

Our analysis focuses on new housing in Victoria, South Australia, Western Australia, Tasmania and the ACT, all of which apply the minimum six-star NatHERS requirement. The other states have local variations to the standard, while New South Wales uses the BASIX index to determine the environmental impact of housing.

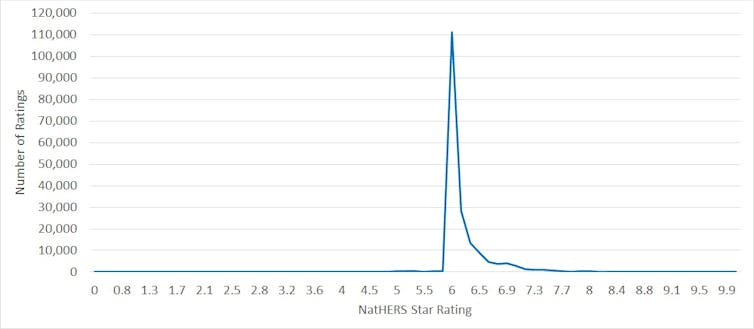
The chart below shows the performance for 187,320 house ratings. Almost 82% just met the minimum standard (6.0-6.4 star). Another 16% performed just above the minimum standard (6.5-6.9 star).

Only 1.5% were designed to perform at the economically optimal 7.5 stars and beyond. By this we mean a balance between the extra upfront building costs and the savings and benefits from lifetime building performance.

NatHERS star ratings across total data set for new housing approvals, May 2016–December 2018. Author provided

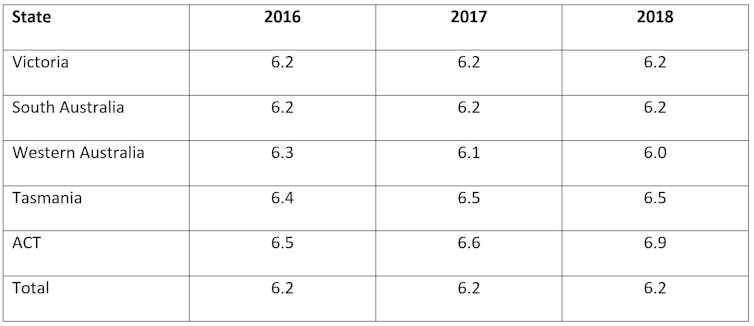
The average rating is 6.2 stars across the states. This has not changed since 2016.

Average NatHERS star rating for each state, 2016-18. Author provided

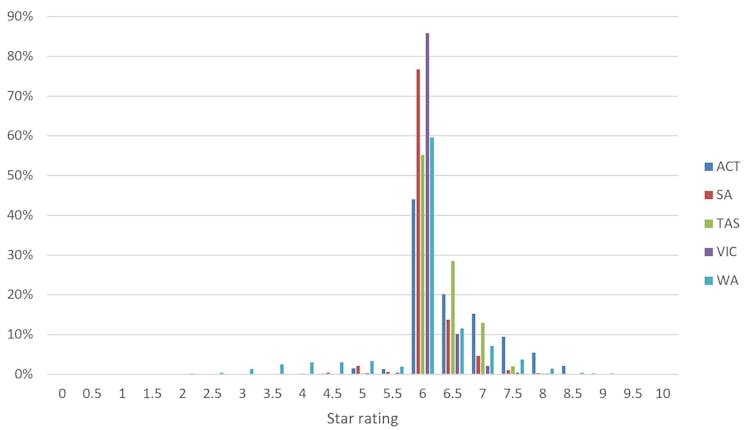
The data analysis shows that, while most housing is built to the minimum standard, the cooler temperate regions (Tasmania, ACT) have more houses above 7.0 stars compared with the warm temperate states.

NatHERS data spread by state. Author provided

The ACT increased average performance each year from 6.5 stars in 2016 to 6.9 stars in 2018. This was not seen in any other state or territory.

The ACT is the only region with mandatory disclosure of the energy rating on sale or lease of property. The market can thus value the relative energy efficiency of buildings. Providing this otherwise invisible information may have empowered consumers to demand slightly better performance.

We are paying for accepting a lower standard

The evidence suggests consumers are not acting rationally or making decisions to maximise their financial well-being. Rather, they just accept the minimum performance the building sector delivers.

Higher energy efficiency or even environmental sustainability in housing provides not only significant benefits to the individual but also to society. And these improvements can be delivered for little additional cost.

The fact that these improvements aren’t being made suggests there are significant barriers to the market operating efficiently. This is despite increasing awareness among consumers and in the housing industry about the rising cost of energy.

Eight years after the introduction of the six-star NatHERS minimum requirement for new housing in Australia, the results show the market is delivering four out of five houses that just meet this requirement. With only 1.5% designed to 7.5 stars or beyond, regulation rather than the economically optimal energy rating is clearly driving the energy performance of Australian homes.

Increasing the minimum performance standard is the most effective way to improve the energy outcomes.

The next opportunity for increasing the minimum energy requirement will be 2022. Australian housing standards were already about 2.0 NatHERS stars behind comparable developed countries in 2008. If mandatory energy ratings aren’t increased, Australia will fall further behind international best practice.

If we continue to create a legacy of homes with relatively poor energy performance, making the transition to a low-energy and low-carbon economy is likely to get progressively more challenging and expensive. Recent research has calculated that a delay in increasing minimum performance requirements from 2019 to 2022 will result in an estimated A$1.1 billion (to 2050) in avoidable household energy bills. That’s an extra 3 million tonnes of greenhouse gas emissions.

Our research confirms the policy proposition that minimum house energy regulations based on the Nationwide House Energy Rating Scheme are a powerful instrument for delivering better environmental and energy outcomes. While introducing minimum standards has significantly lifted the bottom end of the market, those standards should be reviewed regularly to ensure optimal economic and environmental outcomes.

Authors: Trivess Moore, Lecturer, RMIT University; Michael Ambrose, Research Team Leader, CSIRO; Stephen Berry, Research fellow, University of South Australia

Buck-passing on apartment building safety leaves residents at risk

From The Conversation. Hundreds of residents in a Sydney apartment complex, the 122-unit Mascot Towers, were evacuated last Sunday when cracks began to appear due to a serious structural failure. And it isn’t clear when the residents can return.

This crisis echoes the structural failure at Opal Tower and its evacuation on Christmas Eve last year. We have seen a series of serious building failures and fires in recent years. And state and federal governments have had more than year to act on recommendations for better construction regulations, but instead they’re shifting blame.

Although each building failure was different, the end result is the same: misery for the residents and a looming financial disaster for the owners.

New South Wales Premier Gladys Berejiklian said:

We’re getting to the bottom of what happened. The NSW government will hold everybody to account, that’s our role.

But the government’s role is to regulate sufficiently to prevent building failures in the first place, not to hold people to account after the event.

Building regulations since the Great Fire of London

Prevention of construction failures has been the bedrock of building regulations ever since the Great Fire of London in 1666. In the aftermath, the English government realised there was not much use in raking through the ashes and trying to hold people to account, and that an ounce of prevention was worth a pound of cure. This led to the parliament passing regulations to prevent the spread of fire between buildings.

Governments all around the developed world took the lesson of the Great Fire to heart. Their common goal has been to proactively ensure buildings are constructed properly and are safe as a result.

This has been a pretty successful effort and most significant building failures since 1666 have contributed to a more comprehensive and effective regulatory regime.

Serious building failures appear to be more frequent

Prior to the Opal Tower emergency, there had been only one significant evacuation of a multi-unit residential building in NSW due to structural failure. That was a result of the 2009 gas explosion at Eastgate Towers in Bondi Junction.

However, depending on which research you read, either 72% or 97% of strata apartments suffer from serious defects when they’re finished.

There have also been a series of other problems with recent buildings. These include lead in water caused by imported brass plumbing components, non-complying imported electrical cables and failures in the installation of fire doors, fire walls and fire door frames.

Why has this happened?

The states progressively introduced the Building Code of Australia (now the National Construction Code) during the 1990s as part of an agreed plan between the states and the federal government to make building regulations less prescriptive.

The aim was to reduce the cost of construction by favouring “innovation” over conservative “deemed to satisfy” regulations. Innovation, in these terms, meant finding ways to make buildings cheaper to build.

This move coincided with the globalisation of the building materials supply industry and a boom in the construction of tall apartment buildings in Australia.

Some of the innovation has been innocuous, or even beneficial, such as the introduction of a variety of lightweight interior wall systems, but some have resulted in substantial remediation bills – combustible cladding being the prime example. Inspection and responsibility for the plethora of imported components is virtually non-existent.

The downstream cost of failure has landed squarely in the laps of the building owners, many of them owners of tall apartments.

It’s difficult to estimate the total bill for remedial works to tall apartment buildings built over the last 25 years, but it may well exceed the Productivity Commission estimates of savings resulting from the introduction of the National Construction Code.

Blame shifting and ineffective regulations

The federal minister responsible for building regulations, Karen Andrews, says the states are to blame.

And some states, including NSW, have resorted to tough talk about crackdowns on “dodgy” certifiers and “dodgy” builders. In reality, the problem is dodgy government regulation, by both federal and state governments.

The federal and state governments already have an initial plan for fixing these problems. The Shergold-Weir report was delivered to the Building Ministers’ Forum in February 2018.

As the report said:

After having examined the matters put to us, we have concluded that the nature and extent [of building defects] are significant and concerning. The problems have led to diminishing public confidence that the building and construction industry can deliver compliant, safe buildings which will perform to the expected standards over the long term.

Since then, state and federal governments have done almost nothing to implement the recommendations of the report, despite the 2018 Christmas Eve failure at Opal and the fire at Neo200 in Melbourne the following February.

The report itself states:

The recommendations have been designed to form a holistic and structured framework to improve the compliance and enforcement systems of the [National Construction Code] across the country. They form a coherent package. They would best be implemented in their entirety.

In NSW, the published response to Shergold-Weir is a patchwork focusing on holding people to account after a building construction event. This is the reverse of the proactive approach developed following the Great Fire of London.

The NSW government is set to appoint a building commissioner to oversee qualifications and to review building documentation.

But this will likely not achieve much, unless the government commits to upskilling workers throughout the industry and backs up desktop audits by increasing direct inspections on site. Neither of these things appears to be part of its plan.

All governments must take an active role in fixing the defective regulatory regime they have created. If they can’t get on with this process in a timely way, we will need yet another royal commission to sort it out.

The least Premier Berejiklian can do is to treat the Mascot Towers and Opal events in the same way the government treats natural disasters and provide housing assistance to residents who have been displaced through no fault of their own.

Author: Geoff Hanmer, Adjunct Lecturer in Architecture, UNSW

How the Reserve Bank would make quantitative easing work

From The Conversation.

With its official cash rate now expected to fall below 1% to a new extraordinarily low close to zero, all sorts of people are saying that the Reserve Bank is in danger of “running out of ammunition.” Ammunition might be needed if, as during the last financial crisis, it needs to cut rates by several percentage points.

This view assumes that when the cash rate hits zero there is nothing more the Reserve Bank can do.

The view is not only wrong, it is also dangerous, because if taken seriously it would mean that all of the next rounds of stimulus would have to be come from fiscal (spending and tax) policy, even though fiscal policy is probably ineffective long-term, its effects being neutralised by a floating exchange rate.

The experience of the United States shows that Australia’s Reserve Bank could quite easily take measures that would have the same effect as cutting its cash rate a further 2.5 percentage points – that is: 2.5 percentage points below zero.


Reserve Bank cash rate since 1990

Reserve Bank of Australia

In a report released on Tuesday by the University of Sydney’s United States Studies Centre, I document the successes and failures of the US approach to so-called “quantitative easing” (QE) between 2009 and 2014.

It demonstrates that it is always possible to change the instrument of monetary policy from changes in the official interest rate to changes in other interest rates by buying and holding other financial instruments such as long-term government and corporate bonds.

The more aggressively the Reserve Bank buys those bonds from private sector owners, the lower the long-term interest rates that are needed to place bonds and the more former owners whose hands are filled with cash that they have to make use of.

In the US the Federal Reserve also used “forward guidance” about the likely future path of the US Federal funds rate to convince markets the rate would be kept low for an extended period.

It is unclear which mechanism was the most powerful, or whether the Fed even needed to buy bonds in order to make forward guidance work. However in a stressed economic environment, it is worth trying both.

As it comes to be believed that interest rates will stay low for an extended period, the exchange rate will fall, making it easier for Australian corporates to borrow from overseas and to export and compete with imports.

The consensus of the academic literature is that QE cut long-term interest rates by around one percentage point and had economic effects equivalent to cutting the US Federal fund rate by a further 2.5 percentage points after it approached zero.

QE need not have limits…

Based on US estimates, Australia’s Reserve Bank would need to purchase assets equal to around 1.5% of Australia’s Gross Domestic Product to achieve the equivalent of a 0.25 percentage point reduction in the official cash rate. That’s around A$30 billion.

With over A$780 billion in long-term government (Commonwealth and state) securities on issue, there’s enough to accommodate a very large program of Reserve Bank buying, and the bank could also follow the example of the Fed and expand the scope of purchases to include non-government securities, including residential mortgage-backed securities.

It could also learn from US mistakes. The Fed was slow to cut its official interest rate to near zero and slow to embark on QE in the wake of the 2008 financial crisis. Its first attempt was limited in size and duration. Its success in using QE to stimulate the economy should be viewed as the lower bound of what’s possible.

…even if it becomes less effective as it grows

It often suggested (although it is by no means certain) that monetary policy becomes less effective when interest rates get very low, but this isn’t necessarily an argument to use monetary policy less. It could just as easily be an argument to use it more.

Because there is no in-principle limit to how much QE a central bank can do, it is always possible to do more and succeed in lifting inflation rate and spending.

Fiscal policy may well be even less effective. To the extent that it succeeds, it is likely to push up the Australian dollar, making Australian businesses less competitive.

US economist Scott Sumner believes the extra bang for the buck from government spending or tax cuts (known as the multiplier) is close to zero.

Reserve Bank Governor Philip Lowe this month appealed for help from the government itself, asking in particular for extra spending on infrastructure and measures to raise productivity growth.

He is correct in identifying the contribution other policies can make to driving economic growth. No one seriously thinks Reserve Bank monetary policy can or should substitute for productivity growth.

But it is a good, perhaps a very good, substitute for government spending that does not contribute to productivity growth.

Three myths about quantitative easing

In the paper I address several myths about QE. One is that it is “printing money”. It no more prints money than does conventional monetary policy. It pushes money into private sector hands by adjusting interest rates, albeit a different set of rates.

Another myth is that it promotes inequality by helping the rich to get richer.

It is a widely believed myth. Former Coalition treasurer Joe Hockey told the British Institute of Economic Affairs in 2014 that:

Loose monetary policy actually helps the rich to get richer. Why? Because we’ve seen rising asset values. Wealthier people hold the assets.

But it widens inequality no more than conventional monetary policy, and may not widen it at all if it is successful in maintaining sustainable economic growth.

A third myth is that it leads to excessive inflation or socialism.

In the US it has in fact been associated with some of the lowest inflation since the second world war. These days central banks are more likely to err on the side of creating too little inflation than too much.

Some have argued that QE in the US is to blame for the rise of left-wing populists like Alexandria Ocasio-Cortez and “millennial socialism”. But it is probably truer to say that their grievances grew out of too tight rather than too lose monetary policy.

QE has been road tested. We’ve little to fear from it, just as we have had little to fear from conventional monetary policy.

Author: Stephen Kirchner, Program Director, Trade and Investment, United States Studies Centre, University of Sydney

Inducing Consumer Paralysis

Do you think you are paying more than you should for energy, banking, insurance, internet and phone services? You are not alone, and you are probably right. From The Conversation.

Companies offer a growing number of deals that supposedly enable you to choose what is best for you. Every basic economics textbook tells us greater choice should deliver cheaper prices. But in reality this isn’t necessarily the case.

So what’s going on?

A big part of the answer is that businesses are taking advantage of the behavioural phenomenon of “consumer paralysis” to maximise profits.

They provide us with many plans and deals to make us feel like we are in control, but too many choices actually leads most of us to make a bad (or no) choice.

Energy pricing

Let’s consider how this works in the context of Australia’s electricity market.

In most areas of the country, residential customers have at least half a dozen retailers to choose from.

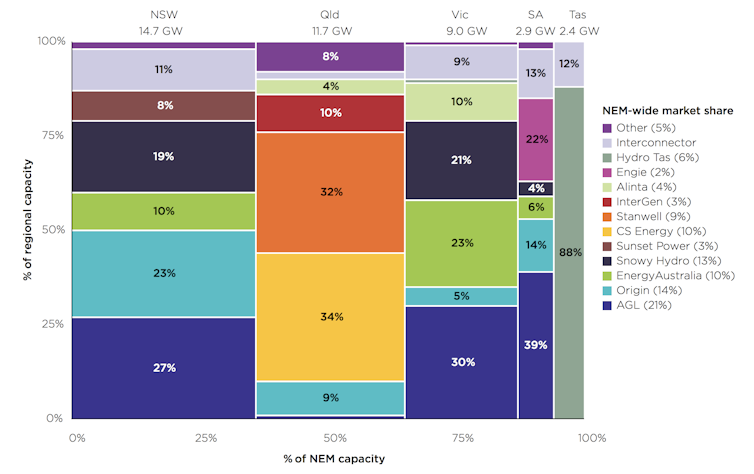
Market share by generation capacity by region, January 2018. ACCC, Retail Electricity Pricing Inquiry Final Report

Nonetheless, according to the Australian Consumer and Competition Commission, electricity prices and profit margins are among the highest in the world, and rising. The consumer watchdog calculates that in the decade to 2018 the average residential electricity bill increased by 55% (or 35% in real terms) – and only a very small part of that had to do with alleged culprits such as renewable energy.

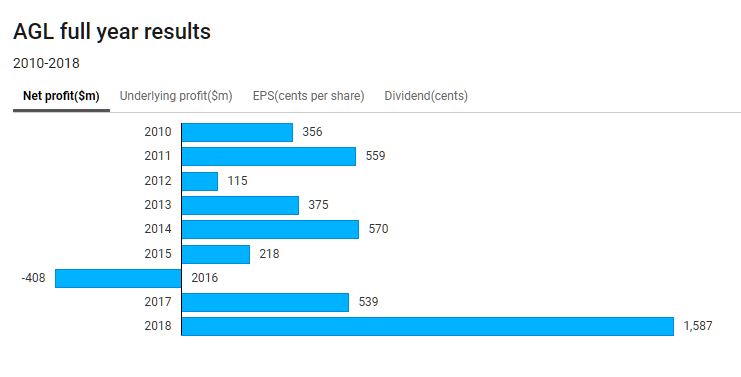
Australia’s biggest electricity company, AGL, made a net profit of A$1.6 billion in 2018 – 194% more than the year before.

Depending on where you live, AGL offers up to 11 energy plans to residential customers. There’s the “Savers” plan, “Savers Online”, “Everyday”, “Freedom”, “Standing Offer”, “Essentials”, “Essentials Plus”, and so on.

Each plan, in turn, has four to eight tariff type options: “Flexible Price”, “Time of Use Interval”, “5 Day Time of Use”, “Single Rate”, “Two rate: single rate with controlled load”, “Single Rate Demand Opt-in”, and so on.

That adds up to literally dozens of price plans from just one retailer. Other companies are hardly better. For a customer in inner Sydney, there are more than 350 retail plans to choose from.

All this “choice” gives the appearance of a competitive market, but its effect is the opposite. It give retailers wriggle room to charge more, not less.

Experiments in choice behaviour

Many experiments over the past three decades have demonstrated the ubiquity of too much choice leading to consumer paralysis.

One classic experiment was run by psychologists Sheena Iyengar and Mark Lepper in a San Francisco supermarket in 1999. Customers visiting the store were given a chance to sample jams. Half the time they were allowed to taste up to six jams; the other half they could taste up to 24 jams.

Traditional economics says a consumer is much more likely to find a jam they really like with a sample of 24 rather than six. So offering 24 jams should lead to more jam purchases.

Yet exactly the opposite was found. Of the consumers who chose to taste jams, only 3% of those who could sample 24 jams ended up buying jam, whereas 30% (or 10 times more) of those who could sample just six jams ended up buying.

More choices provided, more paralysis.

More recently, in 2012, Iyengar’s Columbia University colleague Eric Johnson and others reported on an experiment with much greater consequences.

They asked people to choose health insurance coverage from a set of four or eight options. The options varied on monthly premiums and deductibles. When given four options, 42% of subjects chose the best value option. On average their choices cost about $200 more than the best option on offer.

When given eight options, only 21% chose the best option – no better than simply making a random choice.

Reinforcing psychological biases

Given the massive number of products and plans available in the energy, banking, insurance, internet and mobile phone sectors, the time and effort needed to choose the best deal leaves us feeling overwhelmed and overloaded. In response, we rely on shortcuts (rules of thumb) to save both time (and our sanity).

But these shortcuts can also cause biases that result in further paralysis, including:

  • Present bias – we put much greater weight on the present than the future. Since the cost of making decisions happens in the present (like the time and effort to compare options and switch services) while the benefits happen later (like saving money), we minimise the time we spend making decisions
  • Status quo bias – we tend to stick with a chosen option or default, even when a much better option may be available
  • Loss aversion – we place much greater weight on losses and often overestimate the chance of a bad outcome.

There is considerable evidence pointing to how these biases lead to consumer paralysis in the retail banking and energy sectors.

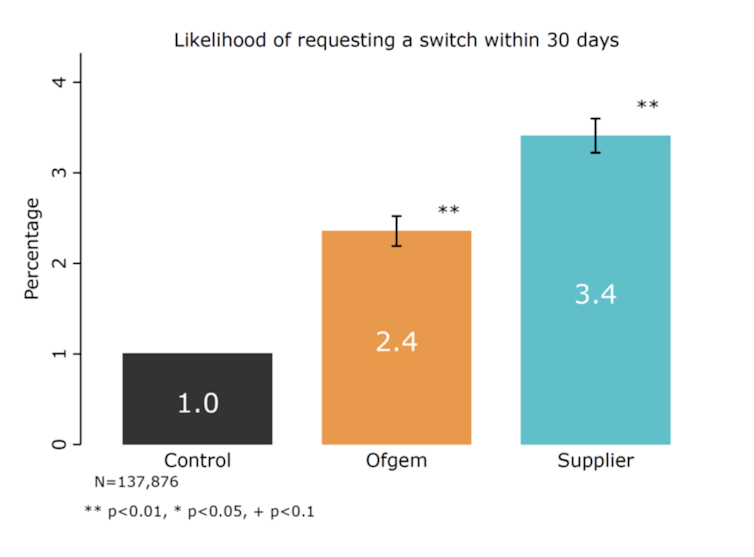
In 2017, Britain’s energy regulator, Ofgem, ran a randomised control trial involving more than 130,000 electricity customers. Participants received personalised letters either from Ofgem or their current provider offering substantially better electricity deals.

The result: compared with the control group in which only 1% switched tariffs within the next month, 3.4% of those who received an offer from their electricity provider switched to a better deal. Even when presented with notable savings, more than 96% stuck with the status quo.

Results of Ofgem’s Cheaper Market Offers Letter (CMOL) trial. Ofgem

Other Ofgem research shows that among those who have not switched energy plans, 51% consider it a hassle they don’t have time for, and 48% worry that things would go wrong.

Yvette Hartfree and her colleagues at the University of Bristol’s Personal Finance Research Centre have noted similar fears among bank customers: “The biggest concern for those considering switching is that something will go wrong at some point in the process of switching.”

Taking action

We should not be surprised that energy companies and others use an avalanche of choice to confuse us. It is a brilliant business strategy: it seems more competitive from a traditional assessment, yet actually reduces competition.

So what can you do?

On your own, you will need to make a conscious effort to overcome paralysis. You need to devote the time to carefully compare offers.

Fortunately, you can find tools that can help, such as the Australian government’s energy comparison website. However, be wary of commercial “switching services” and websites that provide comparisons. These operations are often being paid by retailers. Their motives are not necessarily to direct you to the best deal.

What can we do collectively?

One option is government action to ensure switching services are trustworthy. At a minimum, there should be guidelines that switching services not take payments from retailers, and only charge you when you actually save money.

Another option is to form “consumer unions”, which can bargain collectively to get members better deals. The potential of community groups to leverage bulk-buying arrangements has been demonstrated in other contexts. In Victoria’s Gippsland region, for example, local organisations have banded together to offer discounts on renewable energy technology.

There’s no reason something similar could not be done to overcome the choice problems induced by big energy retailers and the like.

Author: Robert Slonim, Professor of Economics, University of Sydney

More Are Retiring With High Mortgage Debt! [Podcast]

We look at a recent The Conversation article which spells out the problems ahead for many older Australians with mortgages.

Digital Finance Analytics (DFA) Blog
More Are Retiring With High Mortgage Debt! [Podcast]
Loading
/

The RBA’s Marching Orders No Longer Realistic?

From The Conversation.

A somewhat obscure fact about the marching orders for Australia’s Reserve Bank is that, usually, when a government is elected or re-elected or a new governor takes office, the official agreement between the government and the Reserve Bank changes.

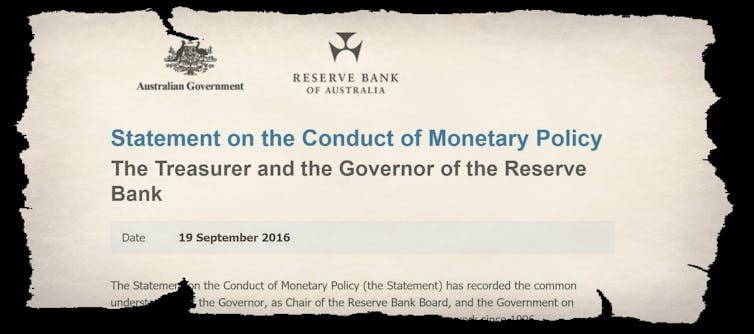
There have been seven such agreements so far, each signed by the federal treasurer and bank governor of the time, and each entitled “Statement on the Conduct of Monetary Policy”.

The first was signed by treasurer Peter Costello and incoming governor Ian Macfarlane in 1996, the second when Costello reappointed Macfarlane in 2003, and the third when Costello appointed Glenn Stevens in 2006.

The fourth was between new treasurer Wayne Swan and Stevens on Labor’s election in 2007, and the fifth between Swan and Stevens on Labor’s reelection in 2010.

The sixth was between incoming treasurer Joe Hockey and Stevens on the Coaition’s election in 2013, and the most recent one between treasurer Scott Morrison and incoming governor Philip Lowe in 2016.

This is what the agreement looks like. Reserve Bank of Australia

The current agreement begins this way:

The Statement on the Conduct of Monetary Policy (the Statement) has recorded the common understanding of the Governor, as Chair of the Reserve Bank Board, and the Government on key aspects of Australia’s monetary and central banking policy framework since 1996.

For nearly a quarter of a century, as the statement goes on to note, there has been a core component of how monetary policy is conducted:

The centrepiece of the Statement is the inflation targeting framework, which has formed the basis of Australia’s monetary policy framework since the early 1990s.

But over the years, there have been tweaks. One was this change between the 2013 and 2016 statements.

2013:

Low inflation assists business and households in making sound investment decisions…

2016:

Effective management of inflation to provide greater certainty and to guide expectations assists businesses and households in making sound investment decisions…

The change from “low inflation” to “effective management of inflation” sounds subtle, but was no accident. It gave the Reserve Bank extra wiggle room around the inflation target.

And boy, did it come in handy.

The target that’s rarely met

The big question about the agreement is whether the next one (between Frydenberg and Lowe on the Coalition’s reelection) will tweak the target again, change it completely, or do something in between.

Because it presumably can’t remain the same.

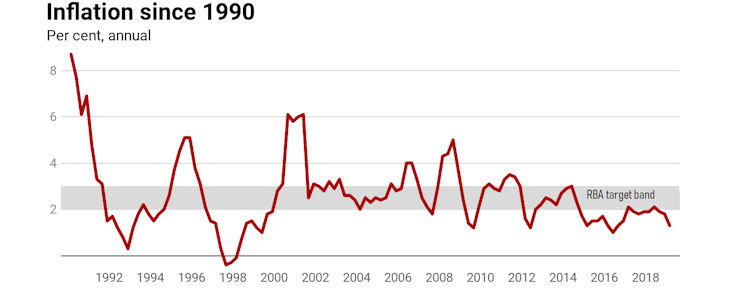
One reason to think it will change, perhaps significantly, is the bank’s utter inability to even get particularly close to its target inflation band of 2-3%, let alone to get within tit, “on average, over time” as required by the agreement.

For years now, inflation has mostly been below the band. ABS 6401.0

You might not think this matters too much. But it does.

The inflation target is crucial in setting stable expectations for consumers, businesses and markets.

Don’t just take my word for it.

Here is what the previous Reserve Bank governor, Glenn Stevens, said in his last official speech before handing over to Philip Lowe in August 2016:

From 1993 to 2016, a period of 23 years, the average rate of inflation has been 2.5% – as measured by the CPI, and adjusting for the introduction of the goods and services tax in 2000. When we began to articulate the target in the early 1990s and talked about achieving “2–3%, on average, over the cycle”, this is the sort of thing we meant. I recall very well how much scepticism we encountered at the time. But the objective has been delivered.

As I pointed out last month, expectations about price movements depend on Australians believing that the bank will do what it says it will do.

Once people lose faith in the bank’s commitment to or ability to achieve the target, inflation expectations become unmoored. People react to what they think what might happen rather than what they are told will happen. This is what led to Australia’s wage-price spirals in the 1970s and 1980s, and to Japan’s lost decades of deflation.

Three possible outcomes

One possibility is the same statement, word for word. It would be meant to signal that the bank and the government think things are under control.

A second possibility is a tweak that further emphasises the “flexible” nature of the target, along the lines Lowe mentioned in his speech at this month’s Reserve Bank board board dinner in Sydney. It would provide more cover for the bank’s inability to hit its target.

A third option would be to add some discussion of the importance of fiscal policy – government spending and tax policy – as a complement to the Reserve Bank’s work on monetary policy. Lowe is keen to mention that he is keen on it, every chance he gets.

But that would put the government under implicit pressure to run budget deficits at times like those we are in rather than surpluses. It’s hard to see the Morrison government signing up for that, given its repeated talk during the election about the importance of being “responsible”.

Or something more

At the more radical end of the spectrum would be a genuinely new framework for monetary policy.

In the United States, which has also missed its inflation target, though by not as much as Australia, there has been much discussion of moving to a “nominal GDP target”. The range mentioned is 5-6% a year.

Advocates of this include former US Treasury secretary Larry Summers, who outlined his rationale in a Brookings Institution report in mid-2018.

ANU economist and former Reserve Bank board member Warwick McKibbin championed the idea along with economists John Quiggin, Danny Price and then Senator Nick Xenophon in the leadup to the 2016 agreement between Morrison and Lowe.

Nominal GDP is gross domestic product before adjustment for prices. In countries subject to big changes in export prices such as Australia, it can provide a better guide to changes in income.

When nominal GDP is strong (as it is when minerals prices are high) consumer spending is likely to be strong – perhaps too strong. When it is weak (as it is when minerals prices collapse) consumer spending is likely to be weak and in need of support.

But don’t get your hopes up

Given the natural caution of the bank and of this government, we should probably expect something at the modest end of the spectrum – even if something like a nominal GDP target would make sense.

Perhaps what’s most important isn’t what the statement says, but that it says something and that the Reserve Bank sticks to it. It will lose an awful lot of credibility if it sticks to nothing.

In the words of Nobel Laureate Bob Dylan: “they may call you doctor, they may call you chief, but you’re gonna have to serve somebody … it may be the devil or it may be the Lord, but you’re gonna have to serve somebody.”

Author: Richard Holden, Professor of Economics, UNSW

More Are Retiring With High Mortgage Debts

From The Conversation.

The number of mature age Australians carrying mortgage debt into retirement is soaring.

And on average each mature age Australian with a mortgage debt owes much more relative to their income than 25 years ago.

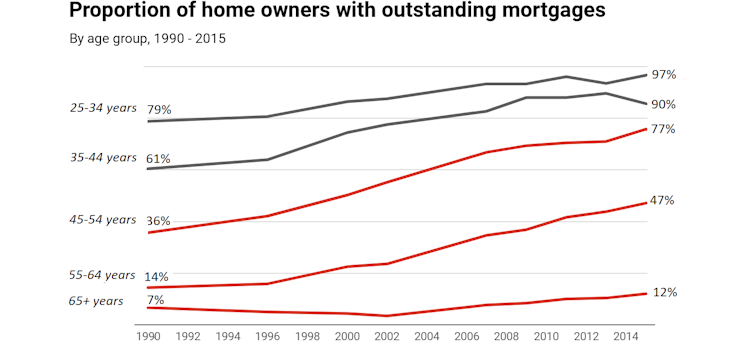
Microdata from the Bureau of Statistics survey of income and housing shows an increase in the proportion of homeowners owing money on mortgages across every home-owning age group between 1990 and 2015. The sharpest increase is among homeowners approaching retirement.

More mortgaged for longer

For home owners aged 55 to 64 years, the proportion owing money on mortgages has tripled from 14% to 47%.

Among home owners aged 45 to 54 years, it has doubled.

Source: Authors’ own calculations from the Surveys of Income and Housing

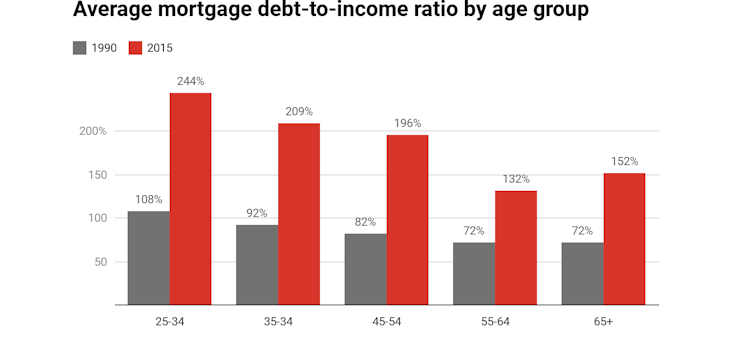
Meanwhile, the average mortgage debt-to-income ratio among those with mortgages has pretty much doubled across every home-owning age group.

In the 45-54 age group the mortgage debt-to-income ratio has blown out from 82% to 169%.

For those aged 55-64 it has blown out from 72% to 132%.

Among mortgage holders. Source: Authors’ own calculations from the Surveys of Income and Housing

Three reasons why

The soaring rates of mortgage indebtedness among older Australians have been driven by three distinct factors.

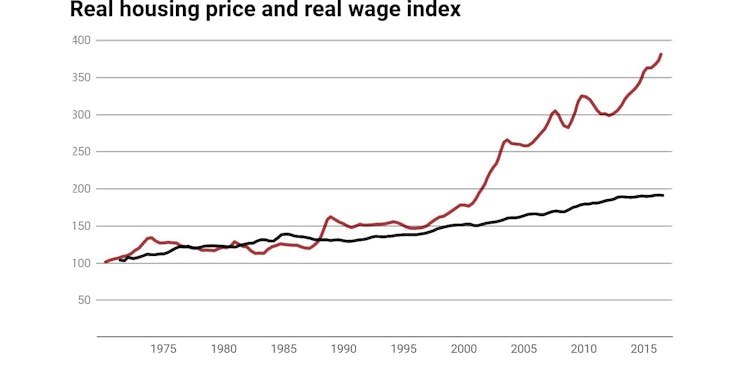
First, property prices have surged ahead of incomes.

Since 1970 the national dwelling price to income ratio has doubled.

Prices and wages in 1970 are assigned an index of 100. Sources: Treasury, ABS, Committee for Economic Development of Australia

Despite weaker property prices, the ratio remains historically high. This means households have to borrow more to buy a home. It also delays the transition into home ownership, potentially shortening the the remaining working life available to repay the loan.

Second, today’s home owners frequently use flexible mortgage products to draw down on their housing equity as needed for other purposes. During the first decade of this century, one in five home owners aged 45-64 years increased their mortgage debt even though they did not move house.

Third, older home owners appear to be taking on bigger mortgages or delaying paying them off in the knowledge that they can work longer than their parents did, or draw down their superannuation account balances.

Super could be changing our behaviour

For mortgage holders aged 55-64 years, there is evidence to suggest that larger debts prolong working lives.

In 2017 around 29% of lump sum superannuation withdrawals were used to pay down mortgages or purchase new homes or pay for home improvements, up from 25% four years earlier.

In the Netherlands, where a mandatory occupational pension scheme along the lines of Australia’s super scheme has been in place for much longer, over one-half of home owners aged 65 and over are still paying off mortgages.

The base is the total number of uses of lump sums rather than the number of people taking lump sums. ABS 6238.0 Retirement and Retirement Intentions

The implications are huge

Internationally, studies have found that indebtedness adds to psychological distress. The impacts on wellbeing are more profound for older debtors, without the ability to recover from financial shocks.

Debt-free home ownership in old age used to be known as the fourth pillar of the retirement incomes system because of its role in reducing poverty in old age. It allowed the Australian government to set the age pension at relatively low levels.

Growing indebtedness will increase after-housing-cost poverty among older Australians and create pressure to boost the age pension.

Mortgage debt burdens late in working life will also expose home owners to unwelcome risks, as health or employment shocks can ruin plans to pay off their mortgages.

During the first decade of this century, around half a million Australians aged 50 years and over lost their homes.

Taxpayers will be under pressure to help

Those losing home ownership are often forced to rely on rental housing assistance. Moreover, as older tenants they are unlikely to ever leave housing assistance. This will put pressure on the government to boost spending on housing assistance, which is likely to further boost demand for housing assistance.

Super and government housing assistance could become the safety nets that allow retirees to escape their mortgages.

It wasn’t the intended purpose of superannuation, and wasn’t the intended purpose of housing assistance. It is a development that ought to be front and centre of the inquiry into the retirement incomes system announced by Treasurer Josh Frydenberg.

It is a change we’ll have to come to grips with.

Authors: Rachel Ong ViforJ, Professor of Economics, School of Economics, Finance and Property, Curtin University; Gavin Wood, Emeritus Professor of Housing and Housing Studies, RMIT University

The RBA Will Cut Again, And AGAIN

From The Conversation: The Reserve Bank cut interest rates on Tuesday because we aren’t spending or pushing up prices at anything like the rate it would like. And things are even worse than it might have realised.

As the board met in Martin Place in Sydney, in Canberra at 11.30 am the Bureau of Statistics released details of retail spending in April, one month beyond the March quarter figures the bank was using to make its decision.

They show the dollars spent in shops fell in April, slipping 0.1%, notwithstanding weakly growing prices and a more strongly growing population.

The March quarter figures the board was looking at were adjusted for prices. They show that the volume of goods and services bought, but not the amount paid for them, fell in seasonally adjusted terms during the March quarter.

Adjusted for population, the volume bought would have fallen further.

We’ll know more on Wednesday

The Bureau of Statistics will release population-adjusted figures as part of the national accounts on Wednesday.

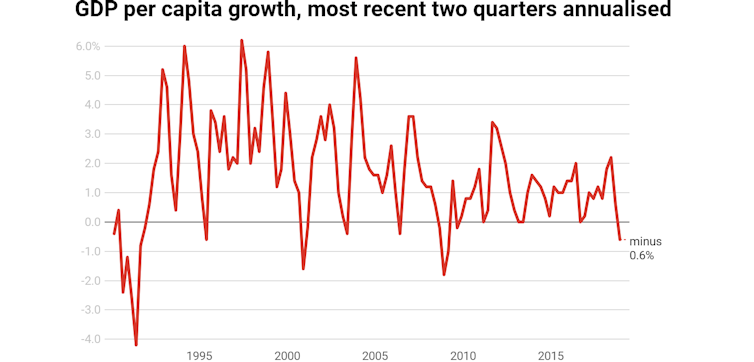
The figures for the September quarter show that income and spending per person barely grew. The figures for the December quarter show income and spending per person fell.

A second fall in the March quarter will mean two in a row – what some people call a per capita recession.


Australian National Accounts

Even unadjusted for population, economic growth is dismal.

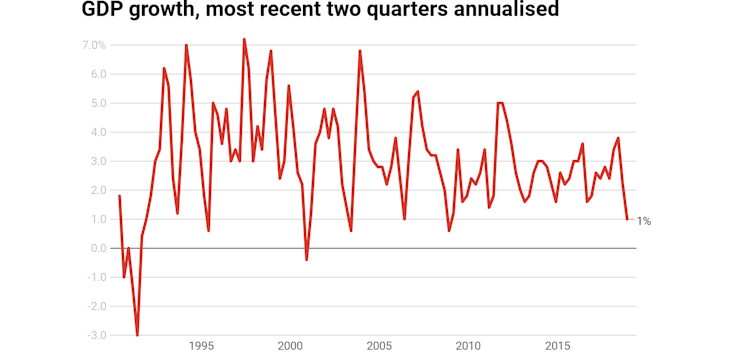
During the September and December quarters the economy grew just 0.3% and 0.2% – an annualised rate of just 1%.

That’s well short of the 2.75% the treasury believes we are capable of, and the lower than normal 2.25% it has forecast for the year to June.


Australian National Accounts

We’ve been doing it by ourselves. As Reserve Bank Governor Philip Lowe said in announcing the rates decision on Tuesday:

The main domestic uncertainty continues to be the outlook for household consumption, which is being affected by a protracted period of low income growth and declining housing prices.

The bank wants both inflation and employment higher, and it wants us to spend more in order to do it. Lower rates should help, although not for everybody.

Lowe acknowledged this is a speech to a Sydney business audience on Tuesday night, but he said households paid two dollars in interest for every one dollar of interest they received. So while rate cuts hurt savers, they benefit borrowers by more, and over time should benefit all households by boosting the economy. They also drive the dollar lower, making Australian businesses more competitive.

Tuesday’s cut should free up an extra A$60 a month for a typical mortgage holder. Another one will free up a total of $120.

It’s not much, and there’s doubt about whether it will do much, but interest rates are about the only tool the Reserve Bank has.

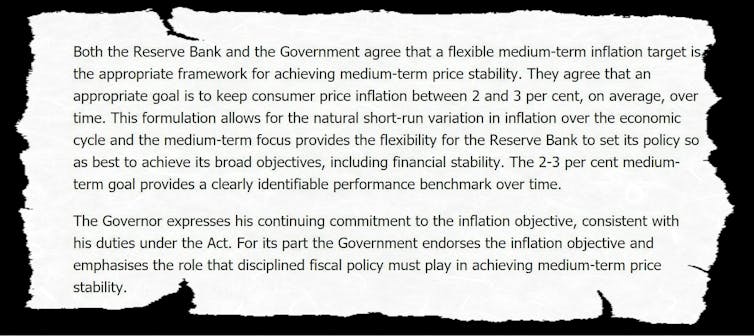
It is required by its agreement with the government to aim for an inflation rate of between 2% and 3%, “on average, over time”.

Treasurer and Reserve Bank Governor, Statement on the Conduct of Monetary Policy, September 19, 2016. Reserve Bank of Australia

Uncomfortably for Governor Lowe, underlying inflation (abstracting from unusual moves which are quickly reversed) has been below 2% ever since he was appointed governor in late 2016.

Explaining his push for higher inflation to a business audience in Sydney on Tuesday night he said that while adherence to the target was intended to be flexible, that flexibility was “not boundless”.

If inflation stays too low for too long, it is possible that inflation expectations move lower – that Australians come to expect sub-2% inflation on an ongoing basis. If this were to happen, it would be harder to achieve the medium term inflation goal. So we need to guard against this possibility.

He is also required to aim for full employment.

He told the business audience that while for some years the bank and others had thought full employment meant an unemployment rate of 5%, the absence of inflation at 5% and the persistence of underemployment (where people wanted more hours) meant it could and should go lower.

Our judgement now is that we can do better than this – that we can sustain an unemployment rate of 4 point something.

Lower interest rates should help by making it easier to businesses to borrow to expand, and giving consumers something in their pockets to buy from them.

If you don’t succeed…

If that doesn’t happen, the bank will cut again.

Tuesday’s statement as good as said so:

The board will continue to monitor developments in the labour market closely and adjust monetary policy to support sustainable growth in the economy and the achievement of the inflation target over time.

Tuesday’s cut and the next will take the bank into uncharted waters, where its so-called cash rate – what it pays to banks to deposit money with it overnight – is close to zero.

As far as can be discerned it has never been that low in the 100+ years the Reserve Bank has been in operation, originally as the Commonwealth Bank of Australia.


Reserve Bank cash rate since 1990

Reserve Bank of Australia

Should inflation still not pick up and employment still not fall as far as it believes it could, it will have to effectively cut its cash rate below zero, forcing cash into the hands of banks by aggressively buying government bonds, giving them little choice but to lend it to households and businesses, in a process known as quantitative easing. It has been done in the United States, Europe, the United Kingdom and Japan, and is by now anything but unconventional.

Governor Lowe would prefer the government to pull its weight by cutting tax and boosting spending, especially on infrastructure, and by policies that make Australia more productive.

He said so on Tuesday night

the best approach to delivering lower unemployment and a stronger economy is through structural policies that support firms expanding, investing, innovating and employing people. As we ease monetary policy, it is in the country’s interest that other policy options are considered too.

Treasurer Josh Frydenberg gets it.

He pointed out on Tuesday that the yet-to-be-approved tax offsets in the budget will give Australians on up to $126,000 a cash bonus of up to $1,080 when they submit this year’s tax return, far more than the rate cut.

His biggest concern, and the biggest concern of the governor, might be that they don’t spend it. Another concern would be that the banks don’t pass the rate cut on.

The ANZ has said it will only cut mortgage rates by 0.18 points instead of the full 0.25, a decision Frydenberg said “let down” customers. Westpac has cut by only 0.20 points. The National Australia and Commonwealth banks have passed on the cut in full.

On Tuesday night in Sydney Governor Lowe addressed the question of whether the banks should have passed on the full cut head on:

My usual practice in answering this question has been to explain that there are a range of other factors that influence mortgage pricing, and then say “it all depends”.

Today, though, I would like to break with my usual practice and provide a clearer answer. And that is: Yes. There has been a substantial reduction in the cost of banks raising funds in wholesale markets. Average rates on retail deposits have also come down.

This means that the lower cash rate should be fully passed through into standard variable mortgage rates. Full pass-through would also mean that the economy receives the full benefit of today’s policy decision.

The Governor is concerned that, for their own reasons, lenders such as ANZ and Westpac are forcing him to cut rates lower than he should and making an already difficult job harder.

If he has to cut further he will, but with the cash rate at just 1.25%, he would dearly love not to have to.

Author: Peter Martin, Visiting Fellow, Crawford School of Public Policy, Australian National University