Housing affordability has improved slightly, but…

From The Conversation.

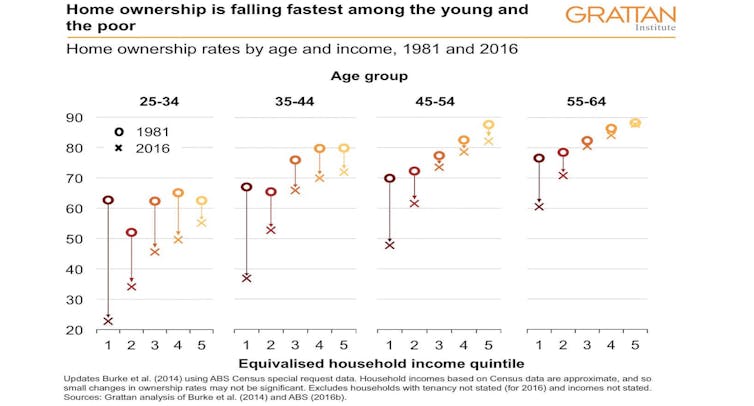
The re-election of the Morrison government has delivered an Australian housing policy platform based on home ownership. The recently announced First Home Loan Deposit Scheme and the existing First Home Super Saver Scheme complement first home buyer grants and stamp duty concessions from state and territory governments. What we aren’t going to see is a major increase in the supply of affordable housing through a dedicated subsidised affordable rental program or negative gearing and capital gains tax reform.

Is a policy based on home ownership going to fix the problems of housing affordability in this country? The BCEC Housing Affordability Report published today by the Bankwest Curtin Economics Centre suggests not.

The report is based on a survey that collected responses from just over 3,600 Australians across three states – New South Wales, Queensland and Western Australia – with 75% of responses from metropolitan locations and 25% from regional areas.

Similar surveys were conducted in 2015 and 2017. This allows for comparisons across the three periods.

Housing costs

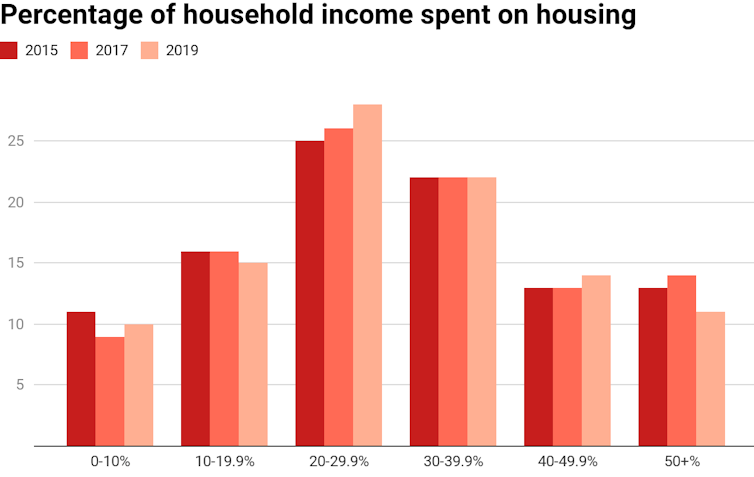
The survey asked respondents to estimate the proportion of their gross income spent on housing costs. Around 40% of all households reported living rent/mortgage-free (outright owners, young adults living with parents etc). The chart below shows the distribution across six bands for the remaining households.

Just under half reported paying over 30% of their income on rent or mortgage costs. We see little change over the three surveys, although slightly fewer households are now paying more than 50%.

BCEC Housing Affordability Survey 2015, 2017, 2019, Author provided

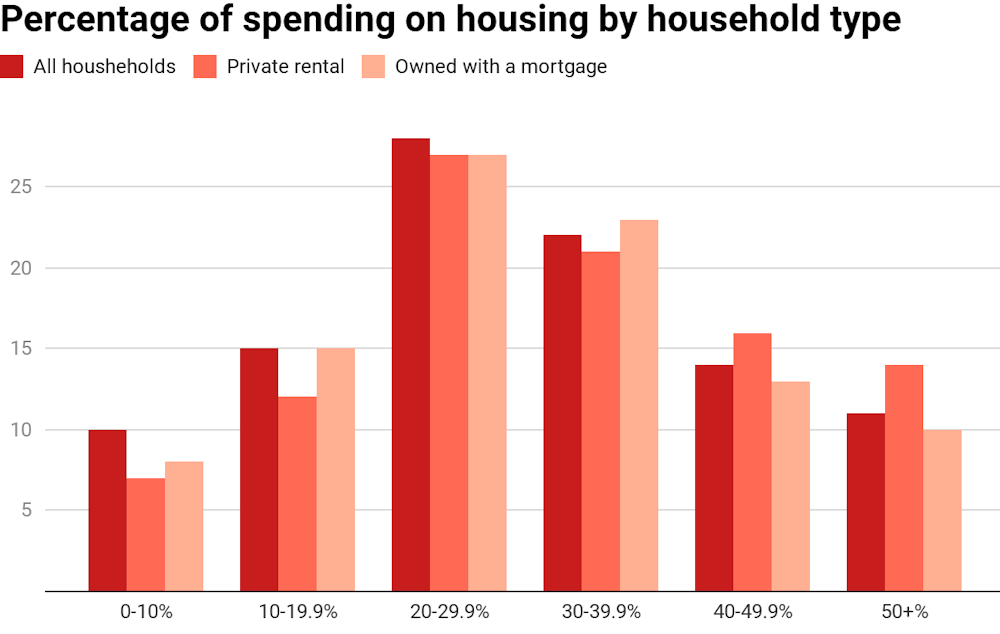
For 2019, slightly more private renters pay over 30% compared to owners with a mortgage, but renters are more likely to be in the highest burden groups. The main difference is 60% of renters are forced to take on these high housing costs while 72% of owners take them on by choice.

BCEC Housing Affordability Survey 2019 , Author provided

Households are very sensitive to changes in housing costs: 40% of those surveyed said a 10% increase in costs would have a major impact on their financial position. The expected impact was greater for renters than owners with a mortgage (44% compared to 38%). A 3% increase in the mortgage interest rate would have a major impact on the financial position of 63% of owners.

The impact of sustaining such costs can be severe: 46% said high housing costs affected their mental health and 30% their physical health.

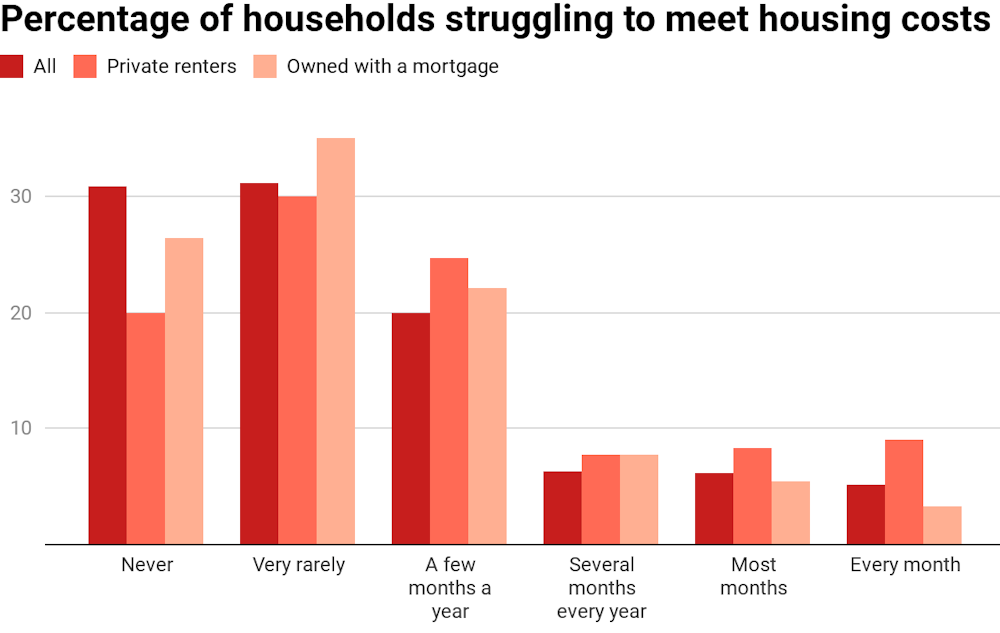
The chart below shows the proportions of households struggling to meet their housing costs. Again, we see only slight improvement across the three surveys.

Among all households, 37% reported difficulty regularly meeting housing costs (at least a few months a year). This rose to around half of all renters and low-income households and to 56% of one-parent families.

BCEC Housing Affordability Survey 2019 , Author provided

Perceptions of affordability

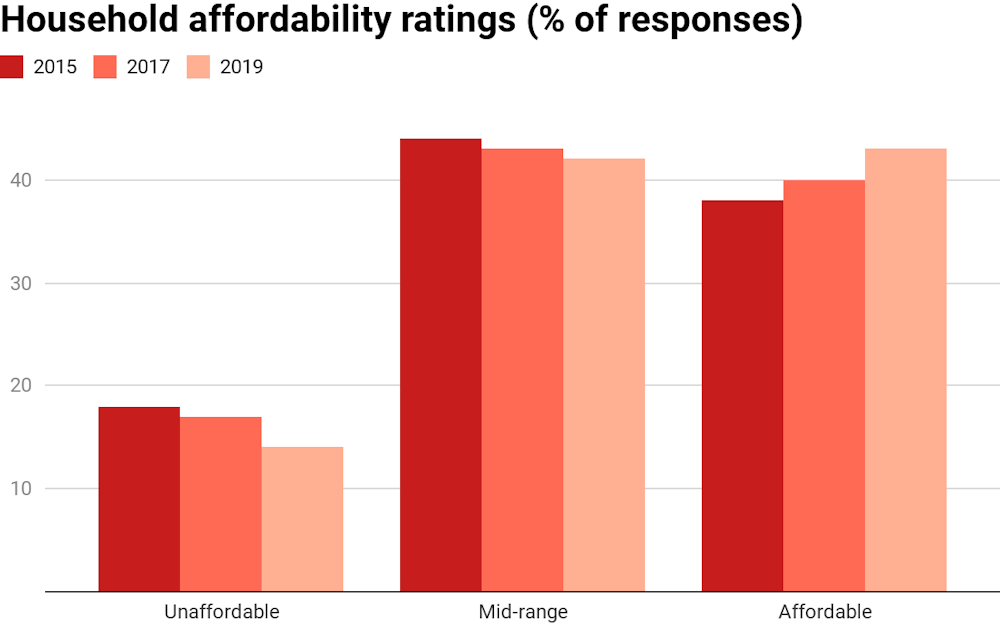
Housing affordability is not just about paying the rent or mortgage. It also includes running costs such as utility bills and maintenance. The survey asked respondents to rate the affordability of their housing on a ten-point scale and the results were collated into three ranks.

The chart below shows some improvement across surveys in the proportions of households rating their housing as affordable. These households are largely outside the lower-income groups.

BCEC Housing Affordability Survey 2019, Author provided

Policy settings

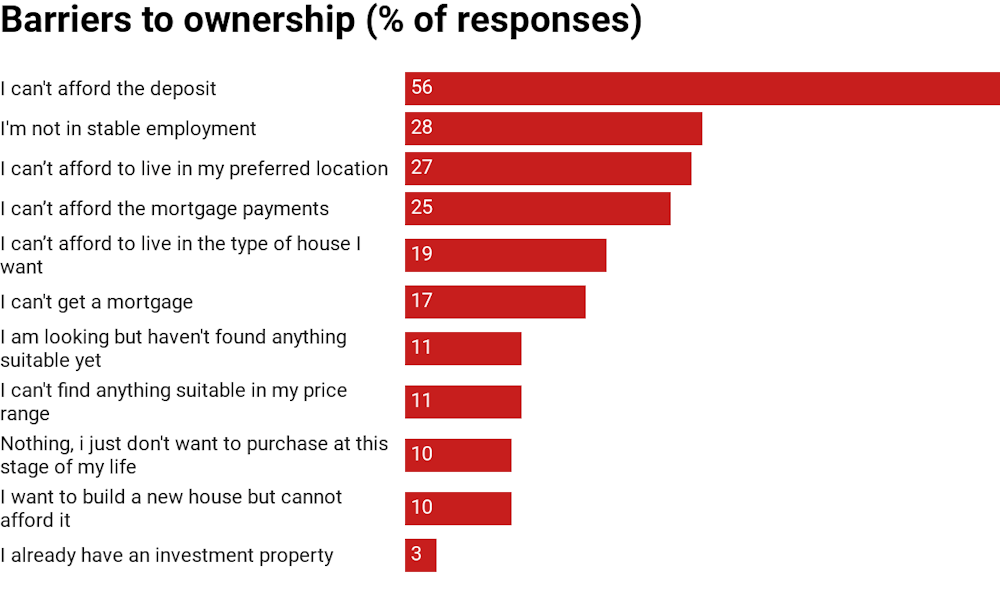
The deposit gap is the biggest barrier for potential home buyers, almost double the importance of the next barrier – a lack of stable employment. Other barriers largely revolve around a lack of suitable stock.

BCEC Housing Affordability Survey 2019, Author provided

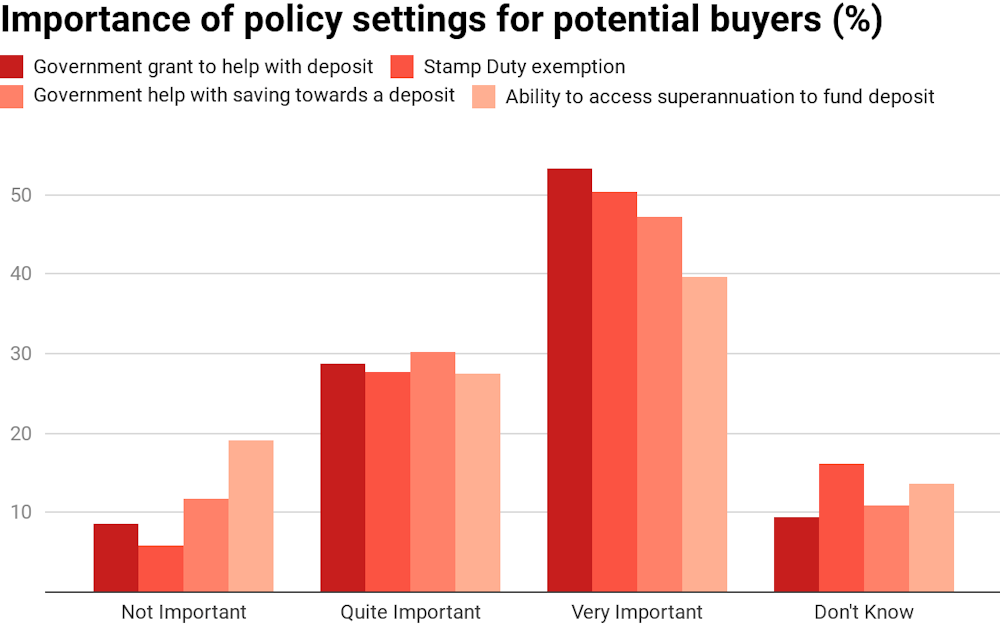
Help for first home buyers is now embedded. Around three-quarters of potential purchasers regard government help through the various mechanisms shown in the chart below as quite or very important while two-thirds would like access to their superannuation to fund a deposit.

For those without help from the “bank of mum and dad” these policies can mean the difference between home ownership and many more years living with parents or renting. It is difficult to see how such help can be equitably removed from the housing system.

BCEC Housing Affordability Survey 2019, Author provided

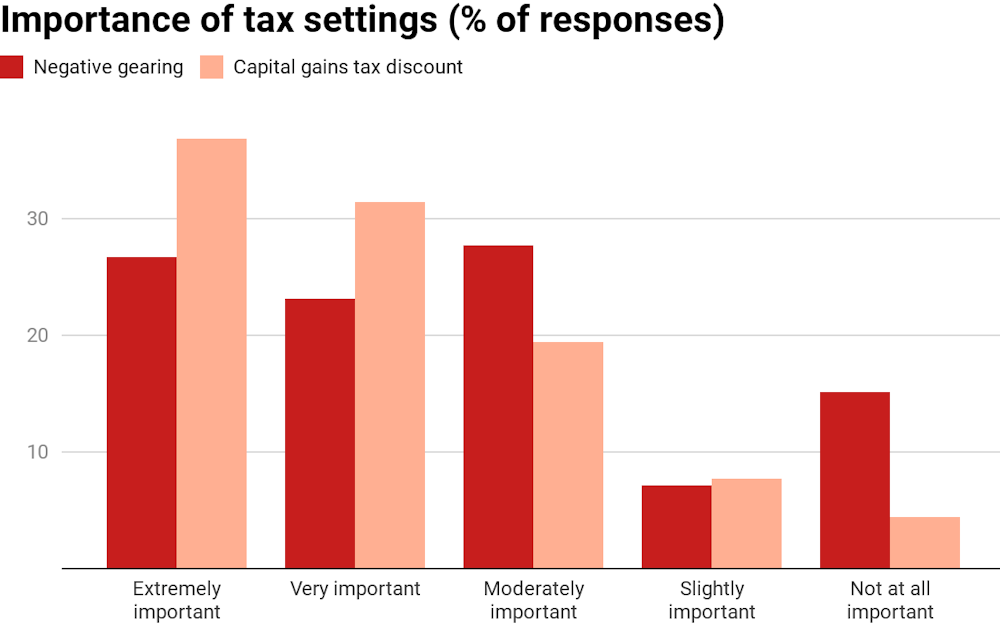
The survey included a number of questions for respondents owning an investment property and for those thinking about buying one. The capital gains tax (CGT) discount was more important to investors that negative gearing. However, only 15% regarded the latter as unimportant.

Around a quarter of investors said they wouldn’t have bought their property if negative gearing were not available and CGT was half its current rate. And 28% said they would not buy an investment property in the absence of negative gearing.

BCEC Housing Affordability Survey 2019, Author provided

Such results suggest a modest impact on investment demand which could impact on local housing markets, depending upon the balance between investors and owner-occupiers in those markets.

Policy development

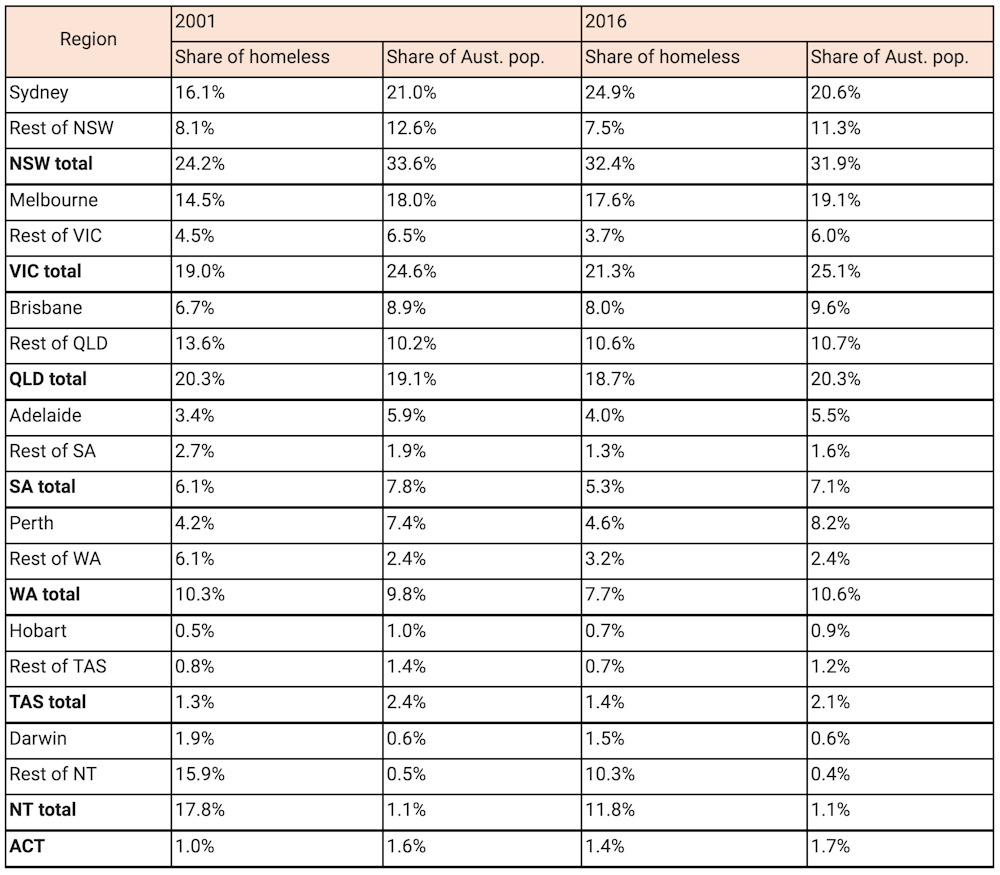
Between the 2017 and 2019 surveys, house prices and rents fell in large areas of the three states. Yet our analysis shows little impact on affordability for low-income households. Intervention is required to deliver housing affordable to such households.

Investment in the National Housing Financial Investment Corporation (NHFIC) and the National Housing and Homelessness Agreement (NHHA) provides some hope outside home ownership policies. The NHFIC has a major role to play in securing funding for the community housing sector. Let’s hope it does not get sidetracked in its new role delivering the first home buyers deposit guarantee scheme.

Large numbers of households are struggling with their housing costs, and not meeting these costs can result in homelessness. This points to the need for more investment in public and community housing.

Ultimately, there is a mismatch between incomes and house prices. Major housing system reform is necessary to redress the balance.

In the meantime, a large and sustained supply of subsidised rental housing and a secure private rental sector that offers a real alternative to ownership are essential components of any future Australian housing system.

Authors: Steven Rowley, Director, Australian Housing and Urban Research Institute, Curtin Research Centre, Curtin University; Alan Duncan, Director, Bankwest Curtin Economics Centre, and Bankwest Research Chair in Economic Policy, Curtin University; Amity James, Senior Lecturer, School of Economics, Finance and Property, Curtin University

Homelessness soars in our biggest cities

From The Conversation.

Homelessness has increased greatly in Australian capital cities since 2001. Almost two-thirds of people experiencing homelessness are in these cities, with much of the growth associated with severely crowded dwellings and rough sleeping.

Homelessness in major cities, especially severe crowding, has risen disproportionately in areas with a shortage of affordable private rental housing and higher median rents. Severe crowding is also strongly associated with weak labour markets and poorer areas with a high proportion of males.

These are some of the key findings of our Australian Housing and Urban Research Institute (AHURI) research released today.

Extending previous AHURI work, we combine 15 years (2001-2016) of homeless estimates from the Australian Census, other customised census and the Australian Institute of Health and Welfare’s Specialist Homelessness Service Collection (SHSC) data.

People counted as homeless on census night live in: improvised dwellings, tents or sleeping out (rough sleeping); supported accommodation; staying temporarily with other households (i.e. couch surfing); boarding houses; temporary lodging; or severely crowded conditions.

How has the geography of homelessness changed?

Nationally, 63% of all homelessness is found in capital cities. That’s up from 48% in 2001.

Shares (%) of homelessness and population by area type

Authors’ panel dataset (ABS Census homelessness estimates)

At the same time, homelessness has been falling in remote and very remote areas. However, it still remains higher in these areas per head of population.

Homelessness is also becoming more dispersed across major cities.

In Sydney, a corridor of high homelessness rates stretches from the inner city westward through suburbs such as Marrickville, Canterbury, Strathfield, Auburn and Fairfield (more than 30km from the CBD).

In Melbourne, high homelessness rates are found in Dandenong (around 25km southeast of the CBD), Maribyrnong and Brimbank to the west, Moreland and Darebin to the north and Whitehorse to the east, about 15km from the CBD.

Homeless rates in Australia 2016

Authors’ panel dataset (ABS Census homelessness estimates and TSP); ABS digital Statistical Geography Boundaries, SA3, 2016

After accounting for population growth, we see a decline in homeless rates in the CBD and inner areas of Perth, Adelaide, Melbourne and to an extent Brisbane over the 15 years. At the same time, homeless rates in outer urban areas have increased. In many regions this increase outpaced population growth.

Change in homeless rate compared with population growth 2001–2016

The highest growth in homeless rates is in those areas where rates increased by 40% or more (the top two deciles) from 2001–2016. Authors’ panel dataset (ABS Census homelessness estimates and TSP); ABS digital Statistical Geography Boundaries, SA3, 2016

The numbers of households living in severely crowded dwellings in capital cities have doubled in 15 years, accounting for much of the growth in homelessness overall. In 2001, this group accounted for 35% of people experiencing homelessness, with 27% living in cities. By 2016, severe crowding rates had soared to 44% of all people experiencing homelessness, with 60% living in capital cities.

Share of severe crowding by area type, 2001–2016

Authors’ panel dataset (ABS Census homelessness estimates)

Rough sleeping has also transformed into an urban phenomenon — nearly half of all rough sleepers in Australia are now found in capital cities.

What is driving these changes?

Homelessness has risen disproportionately in areas with a shortage of affordable private rental housing and higher median rents. That’s especially the case in Sydney, Hobart and Melbourne. In capital city areas with a shortage of affordable private rentals in both 2001 and 2016, severe crowding grew rapidly (by 290.5%) against all homelessness growth (32.6%).

Changes in share of homeless and population by city and region, 2001-16

Authors’ panel dataset (ABS Census homelessness estimates and TSP), Author provided

The effects of rental affordability on homelessness rates still hold after controlling for other area characteristics. We also find that these rates are strongly correlated with higher shares of particular demographic groups in an area, including males, younger age groups, young families, those with an Indigenous or ethnic background, and unmarried persons.

Severe crowding in capital cities is also strongly associated with weak labour markets and poorer areas with a high proportion of males. However, these associations do not hold for severe crowding in remote areas.

What should governments and services do?

The way our cities are becoming more unequal over time is shaping the changes in the geography of homelessness.

Governments must find ways to urgently increase both the supply and size of affordable rental dwellings for people with the lowest incomes. We also require better integration of planning, labour, income support and housing policies targeted to areas of high need.

Rates of severe crowding remain highest in remote areas, and continued efforts to increase housing supply in remote areas, such as the National Partnership on Remote Housing (NPRH), are needed. Targeted responses are required to combat its growth in major cities.

It is critical that specialist homelessness services, as a first response to homelessness, are well located to respond in areas where demand is highest.

The AHURI report can be downloaded here.

Authors: Sharon Parkinson, Senior Research Fellow, Centre for Urban Transitions, Swinburne University of Technology; Deb Batterham, PhD Candidate, Centre for Urban Transitions, Swinburne University of Technology; Margaret Reynolds, Researcher, Centre for Urban Transitions, Swinburne University of Technology

Is this a housing system that cares?

From The Conversation.

Growing numbers of Australians are locked out of home ownership or struggling in insecure and unaffordable private rental markets. There are concerns about home owners drowning in debt. And for lower-income earners, high housing costs mean that paying for food, energy bills and health costs is an ongoing challenge.

It is time for a new way of talking about housing in Australia. The housing crisis is quickly turning into a crisis of care.

We call on the newly re-elected Morrison government and new Housing Minister Michael Sukkar to recognise that the value of housing is not just economic. Housing is an infrastructure of care. Australian governments need to ask: is this a housing system that cares?

A location for essential care

Houses are hubs of care practices and relations. They are places of everyday care, of cooking, cleaning and washing, of care between household and family members. Houses are where we care for children, elders, partners and ourselves.

Houses are also anchors for community and neighbourhood-based care. We keep an eye on neighbours’ homes, support older neighbours to age in place, and care for pets.

This care work is what keeps us alive.

Even though care is not always done well, it is an essential practice that is connected in fundamental ways with housing. Without housing it can be very difficult to meet basic needs.

The care work of housing

But housing is more than just a place where care takes place. Housing systems – through housing policy, markets and design – organise the distribution of care and the ability of people to give and receive care.

In our research this drives us to ask: how does the housing system support or limit the capacity of households to care?

We argue that housing is a care infrastructure and call for this understanding of housing to be at the centre of housing reform.

Home owners benefit

In Australia we value housing as an individual investment and asset. The economic values of housing (how much we can buy, sell or otherwise leverage housing for) are at the heart of how housing is usually discussed.

For affluent households housing markets can work very well as a care infrastructure. This is because these households can more readily afford housing that meets household care needs. They are also more able to invest in housing to cover the costs of care in later life and to support the needs and ambitions of children. For home owners housing is a private welfare net for funding care needs.

Australian housing and related policies create and reinforce the value of home ownership. Subsidies for first home owners, the proposed First Home Loan Deposit Scheme (which will be a focus of efforts by the new housing minister), preferential treatment for owner occupation in pension tests and tax breaks for investor landlords underpin the value of home ownership as an infrastructure of care.

However, for the growing numbers of households not in a position to own a home the picture is less rosy. In many cases housing becomes an infrastructure that inhibits access to necessary care. As increasing numbers of households rent for longer periods, we risk a housing system that only cares for some.

Housing affordability

Housing affordability is a central concern. Lower income earners have less ability to choose to live in places that are well serviced or where family-based care networks are located. Less affluent areas often have less access to public and private care services like doctors and other specialists.

Housing affordability also shapes the ability to afford other care resources like quality food and electricity. Households that face high housing costs are often forced to compromise in these areas.

In Emma’s and other related research older retirees in the private rental market depended on local food charities for nutritious food. And in winter they restricted their use of heating to avoid bill blow-outs.

There are also connections between paid work, caring capacity and housing affordability. High-cost housing markets can drive people to work longer hours and multiple jobs, or require multiple income earners within a household. This can reduce the ability of individuals and households to meet domestic care responsibilities.

Tenure and care

Non-home owners also face restrictions around their use of private rental properties. For a start, rental housing is notoriously insecure. There are also restrictions on the ability of renters to make a house into a home.

Private rental legislation typically does not require landlords to agree to property modifications to meet the needs of a person with disability or ageing body, even when tenant-funded.

Women in Emma’s research reported losing bonds to cover costs associated with removing modifications that had been agreed to during a tenancy. In Kathy’s research, the fear of eviction meant private renters found it difficult to ask for and be granted repairs that would make their homes habitable. They endured leaking roofs and mouldy walls that made housing unsuitable for meeting basic care needs.

Such policies reinforce the value of owned homes as powerful care infrastructures for home owners, while undermining the caring capacity of households that don’t own their homes. While social housing enhances the caring capacity of many households, social housing is chronically underfunded and undersupplied.

Diversity helps meet different needs

As growing numbers of households find themselves locked out of home ownership and face difficulties securing affordable housing in our expensive private rental markets, Australia badly needs housing reform.

The care work of housing must be at the centre of housing policy. The new government and minister for housing must ask: first, is this a housing system that cares? And, second, who does this housing system care for?

Historically, this question has been answered with calls to increase home ownership. But there is value in a diverse housing system because different households have different needs.

Further, those who invest in housing are dependent on the people who will rent that housing. These people in turn have the right – and need – for housing that supports their care needs. Affordable housing is only the starting point.

Authors: Emma Power, Senior Research Fellow, Geography and Urban Studies, Western Sydney University; Kathleen Mee, Associate Professor of Geography, University of Newcastle

Why the banking royal commission will ultimately achieve little

From The Conversation.

Will the banking services royal commission have a lasting effect of improving the banking and financial sector? The answer is “no”. A temporary change is apparent, but the problems lie deeper than those addressed by the royal commissioner.

The worldwide pervasiveness of financial sector misconduct is an indication.

This is not a criticism of the Royal Commission as such. It had a limited mandate and limited time, although its approach of focusing on Australian case studies further limited its scope. And a broader investigation of economic and social underpinnings of financial sector misconduct would have required a different sort of Inquiry.

It’ll be hard to act on the report we had

Even then, any recommendations for fundamental changes to financial sector structure and activities needed to inhibit misbehaviour would have to run the gauntlet of gaining political support in the face of vested interests.

The response to, and government capitulation on, the Hayne recommendation regarding mortgage broking fees starkly illustrates the point.

Why will the recommendations not be a lasting solution? An important reason is that the royal commission interpreted “behaviour consistent with community standards” in a limited way to refer to situations in which customers were actually harmed.

But much of community angst over financial sector conduct relates to the broader use of market power and superior knowledge to extract an “unfair” share of the benefits from transactions with customers.

And it missed the broader problem…

Customers don’t get a fair share of the benefits from transactions, competition doesn’t work to make sure they do, and customers are often unaware that they have been exploited.

Why is it happening? The answer lies partly in this comment of Royal Commissioner Kenneth Hayne on page 54 of his interim report:

Much if not all of the conduct identified in the first round of hearings can be traced to entities preferring pursuit of profit to pursuit of any other purpose

Economists will rightly argue that there is nothing inherently wrong with the pursuit of profit or self-interest. It facilitates the efficient allocation of resources.

But unless it is accompanied by a concern with fairness (“do unto others as you would have them do unto you”) in situations of market power and superior information, as typically occurs in financial markets, it will lead to vulnerable consumers being exploited.

…which is a grey zone of unfairness

There is a large and poorly defined grey area between self-interested but clearly fair behaviour and self-interested unfair behaviour, which, in turn, merges into misconduct and illegal activity.

It is difficult for (particularly large) institutions operating in that grey area, even if committed to “fairness”, to ensure their employees do not slide towards the boundary. Or over it.

Moreover, competition between financial institutions in search of profits can lead to a “race to the bottom” in terms of lower financial product quality. This is not always apparent to some (or many) consumers – at their expense.

The financial sector particularly vulnerable to this problem.

First, many financial products and services are “credence goods” where the consumer needs them but is unable to assess their real worth either before or after the purchase.

A perfect example is a visit to the doctor. Often the reason we are visiting the doctor is because we don’t know what’s wrong with us. It makes it necessarily difficult or impossible to tell whether the doctor is good at her job.

Bankers sharpen their claws on each other

Second, much of the activity in financial markets is about trading and making profits (supposedly using superior information and expertise) at the expense of the another party in those markets.

If it is “right” for that part of the entity that does that to make money at someone else’s expense, why is it wrong for the part of the entity that deals with consumers to do that?

Here’s how the Commission could have tackled these problems in order to achieve real, longer term benefits.

Yet we license them…

First, it could have considered whether giving financial institutions a valuable “social licence” to operate in important business areas under advantageous institutional structures should bring with it extra enforceable obligations.

It could have also considered whether, given the lack of misconduct found in the mutual and cooperative sector, banks and other financial institutions could be organised more like mutuals.

Second, it could have recommended changes that would have given stakeholders other than shareholders (such as depositors and employees) a greater say in running those organisations (perhaps at board level) and a say in shaping their culture.

…and we could change the way they’re run

Third, it could have recommended structural separation between the retail and wholesale arms of firms to reduce complexity and the risks of deficiencies in control systems.

Structural separation could have also reduced the risk that the culture of trading and position-taking, in which profits are made at the expense of another party, spilled over into other parts of the institution where it wasn’t wanted.

Finally, it could (and should) have concentrated more on consumer protection.

It is a much broader issue than deterring and penalising misconduct.

Until consumer financial literacy catches up with financial product innovation and complexity, there will continue to be a big “market for financial misconduct”.

Exhorting institutions to do no harm won’t take it away.


The arguments made in this paper are developed in more detail in “The Hayne Royal Commission and Financial Sector Misbehaviour: Lasting Change or Temporary Fix? Economics and Labour Relations Review, Vol 30 (2), June 2019.

Their biggest challenge? Avoiding a recession

From The Conversation.

Albo, or Plibersek, or whoever it turns out to be the next Labor leader, might have had a lucky accident. Usually, it’s Labor that inherits an economy turning down.

This time, it’s the Coalition. And because of regular updates from the Reserve Bank and the Bureau of Statistics strikingly at odds with their public position that the economy strong, they ought to be finely attuned to it.

Economic growth, the catch-all that is supposed to show us where the economy has been and where it is headed, is frighteningly small.

The treasury’s best estimate of potential growth – how strongly the economy could be growing over time if things were well managed – is 2.75% per year.

The reality, for the two most recent quarters for which we have data, is 0.3% and 0.2%.

The economy is anaemic, despite the crowing

If you add those two numbers together and multiply by two you discover that for six months the economy has been growing at an annualised pace of just 1% – way, way short of its potential.

Stripping out population growth and minimal price growth, real living standards have been going backwards.

The result of what the Reserve Bank describes as “persistently slow growth in household incomes and declining housing prices” has been something of a strike in consumer spending. The real value of spending per household hasn’t been falling, but it hasn’t really been climbing either.

The bank says consumption growth has slowed most noticeably for discretionary items that tend to have the strongest relationship with home buying, such as furnishing and household equipment. It says growth in other types of discretionary spending, such as eating out, has also slowed. Consumption of so-called “essential” items is holding up.

We’re going to need a boost

It means we can’t rely on household spending to revitalise the economy (although the government will give it a go, stumping up a bonus of as much as $1,080 to be delivered with each tax return from July in a much-needed boost that will be disguised as a tax cut rather than spending).

Household spending accounts for three-fifths of gross domestic product. The bank identifies uncertainty over household spending, which itself derives from uncertainty over income growth, as a “key risk” for economic growth:

Should households conclude that low income growth will be more persistent than previously expected, households may adjust their spending by more than currently projected and consumption growth could remain weak for a longer period

Labor would have helped stabilise uncertainty over income growth by immediately intervening before the Fair Work Commission to get higher wages, directing it to draw up a long-term strategy for higher wages, restoring cut penalty rates, and funding the increases of some childcare workers itself.

Having won an election opposing those things, the Coalition will have to try other things, perhaps even bigger and earlier tax cuts.

Prayer would help – prayer that international commodity markets remain strong, that the Reserve Bank cuts rates on June 4 (it is practically certain to), that it cuts them again before the end of the year (financial markets are literally 100% certain that it will) and that home prices stabilise.

Perhaps a very big boost

On the face of it, none of these would be enough to force economic growth back up. If it falls even further, and continues to fall, Australia will enter a recession within this term of government, an outcome to which the academic economists polled by The Conversation in January assigned a 25% probability.

So far employment growth has been the economy’s brightest light, but in its quarterly update released a week before the election, the Reserve Bank pointed out that employment growth can lag economic growth by up to nine months, meaning it might be about to turn down, although it added that it was not unusual for “trends in GDP growth and the labour market to diverge for sustained periods”.

If employment growth does turn down (and the bank says “near-term leading indicators of labour demand have softened”) it is likely to happen first in the construction and retail industries. The construction jobs will come again (and the government is doing its best to bolster them with promises of spending on infrastructure) but the retail jobs might never return, the nature of retailing having changed.

The economy matters more than the surplus

If needed in order to avoid a recession the government will have to be prepared to abandon its promised 2019-20 budget surplus. If the prospect of a recession does loom, it’ll have the political cover. And if it looms early in its term, it might still be able to deliver a budget surplus by the end.

Scott Morrison and his treasurer Josh Frydenberg were elected to manage the economy, and that means doing whatever is needed to avoid a recession and the long term damage to lives and living standards it would deliver. Speaking personally, I’ve no doubt they are up to the task, just as Labor would have been. In a way it’s a pity they didn’t adopt one of Labor’s key economic promises, which was to have a new budget in August, to refresh things.

And they’ve got to focus on lifting living standards over the longer-term, where conveniently, they have a big advantage over Labor.

And it matters more than superannuation

Labor has a blindspot when it comes to superannuation. It wants to lift compulsory contributions from 9.5% of salary to 10% on July 2021, and then by another 0.5% the next year and another 0.5% the next year and so on for five consecutive years, apparently regardless of what it will do to incomes now.

It’s a good thing that unlike Labor, the Coalition will be relaxed about pushing out the timetable if the economy can’t stand it, as it has done before.

Before the election it was preparing to respond to the landmark Productivity Commisson report that found that unintended multiple accounts and the defaulting of new workers into entrenched underperforming funds were costing members an extraordinary A$3.8 billion per year.

The Coalition can set up super for the future

Weeding out the chronic underperformers, clamping down on unwanted multiple accounts and insurance policies, and letting workers choose funds from a short menu of good funds and stay in them for life would give the typical worker entering the workforce an extra $533,000 in retirement.

It recommended a full-blown independent inquiry into how much superannuation we need.

Labor, wedded to a series of increases, would never have done it. The Coalition can.

Author: Peter Martin, Visiting Fellow, Crawford School of Public Policy, Australian National University

Innovation policy is missing in action

From The Conversation.

Three years ago, then prime minister Malcolm Turnbull went to an election spruiking the wonders of innovation. “There has never been a more exciting time to be an Australian,” government advertising had enthused in the months before.

But the public wasn’t enthused, and Turnbull’s government barely scraped back into office.

Since then innovation policy has spooked the political class. They see it as a vote loser, and a threat to jobs – mostly their own.

Consequently, innovation and industry policy has received the least attention just when the decline of investment in research and development may matter most to our economic future.

The red bars show the average intensity of the member states of the OECD and the European Union. Data for Argentina, Australia, New Zealand, Poland, Switzerland, Turkey, and South Africa is from 2015; data for Singapore is from 2014. OECD Main Science and Technology Indicators Database

Here’s how we got to where we are.

A deafening, blinding boom

After the terms of trade downturn of the 1980s and the economic reforms of the 1990s, Australia enjoyed the biggest, unanticipated mining boom in our history, thanks to the rise of China. John Howard wanted us to be “relaxed and comfortable” and we were, at least while it lasted.

Increased commodity prices boosted our terms of trade, without any extra effort on our part. By contrast with Norway, which prepared for its post-oil future with a 76% resource rent tax and sovereign wealth fund, Australians enjoyed tax cuts and a spending splurge.

However, the underlying structural problem of our economy had not gone away. Measured by the research intensity of our exports, Australia’s “economic complexity” ranks at 59, between Kazakhstan and Lebanon.

This index compiled by MIT’s Observatory of Economic Complexity is topped by Japan, Switzerland and Germany. Our position in global innovation rankings is no less dismal, especially when it comes to turning ideas into products.

While recent domestic growth has been driven by services, retail and construction, our future living standards will depend on how we pay our way in the world. This means identifying new, more sustainable sources of export income.

Of course, resources will still have a part to play, but not as unprocessed raw materials. For example, we have everything we need for renewable energy production, battery manufacture and hydrogen exports. And how could anyone contemplate continuation of the barbaric live animal trade?

The graphic below shows Australia’s export profile in 2017. Of US$244 billion in total exports, US$131 billion were mineral products.

This rebalancing won’t happen automatically through the market. It will require active intervention to manage the post-mining boom transition to an inclusive and dynamic knowledge-based economy. And to reverse the slowdown in productivity growth associated with current wage stagnation.

Too obvious to ignore

During the boom, high prices for coal and iron ore masked Australia’s deteriorating productivity performance. Now mining no longer contributes to growth, the impact on our national income has become all too obvious.

That’s why it was so important to Malcolm Turnbull to reinvigorate the national innovation and science agenda with a focus on startups and business-university collaboration, after Tony Abbott’s $3 billion cuts to Labor’s programs.

And why it was then so disappointing he could not build on his agenda for an “ideas boom” to replace the mining boom.

The Coalition government has cycled through three prime ministers and six industry ministers. It continues to cut science and innovation programs. Its latest budget “savings” included $4 billion from the Research and Development Tax Incentive scheme, $3.8 billion from the Education Investment Fund and $2.2 billion from higher education.

As a result, Australia’s total spending on research and development is now just 1.88% of GDP, from 2.11% five years ago. The government contribution (0.57%) is where it was in the 1980s. Meanwhile Japan and Sweden are committing more than 3%, and Korea and Israel more than 4%.

Small target strategies

For any mention of innovation and industry policy in the current election campaign, you have to look hard.

The Coalition has confined itself to some low-key announcements on a new space agency, defence innovation, genomics, food, marine science and manufacturing.

It has rejected or parked the recommendations of its own Innovation and Science Australia 2030 strategy, including using any savings from winding back the R&D Tax Incentive to promote high-growth export opportunities.

Labor has committed to a “collaboration premium” to encourage business engagement with universities and the CSIRO as part of a restructured R&D Tax Incentive (another key recommendation of the 2030 strategy).

However, it will also “bank” the Coalition’s savings to achieve its budget surplus. In this context, it will be all the more challenging for a new Labor government to achieve its R&D target of 3% of GDP, given that this will require additional investment of at least $20 billion.

In addition, Labor has announced an “off-budget” $1 billion Manufacturing Future Fund and a series of initiatives on renewable technologies, biofabrication, food and fibre, artificial intelligence, blockchain, space, hydrogen, electric vehicles and “digital skills hubs”. In an important symbolic gesture, it has also promised to rescue CSIRO climate science.

These initiatives are clearly worthwhile, but do not restore the funding that has been lost, let alone increase it.

If new policy must be paid for, why not cut expenditure that actually impedes economic transition? The diesel fuel tax rebate, for example. This $6 billion scheme, whereby taxpayers subsidise fuel costs for the resources sector, is equivalent to almost half the entire annual budget outlay for research and innovation.

Weighing the costs

Most successful economies around the world use “knowledge foresights” to identify national priorities in areas of existing or potential competitive advantage. They have long-term, coherent policy frameworks for pursuing these priorities.

Australia’s next government will have a chance to devise such a framework, in cooperation with business, unions and research organisations. Of course, it will require substantial public as well as private investment. But we can no longer afford a “do nothing” approach.

Author: Roy Green, Emeritus Professor & UTS innovation adviser, University of Technology Sydney

Someone has to lose in order for first homebuyers to win!

The Grattan Institute published an interesting article in The Conversation. They argue that Labor’s policies are more likely to impact housing affordability than The Coalition. But right at the end of the article, they still preach lack of supply is the problem. This is not the case.

First, we have more than 1 million vacant properties in Australia, according to the last census. Just walk around some of the high-rise areas of an evening and see the darkened dwellings.

Next, the ABS shows the number of people per household has not changed in more than 20 years, you would expect this to change if supply was a problem.

Third there are more than 200,000 units under construction, and more to come (developers are panicking as sales drop off). Much of the demand from investors has left the scene as prices fell and regulation tightened,

Finally, the migration myth needs to be considered as many coming into the country come as part of a family unit, so the actual demand from migration is significantly lower than the generally quoted 300,000. Average family say 2.5 means close to a third less, of whom some will live with existing relatives.

The debt machine has been used to bloat the economy, bank balance sheets and home prices, and that is now (rightly) unwinding. The wealth effect is now in reverse. The choice is between letting the debt continue to fall, and home prices will follow, easing affordability later, or reinflating the debt, and make the problem even worse. Remember we have the second highest household debt to GDP ratio in the world.

Neither party has discussed the debt bomb, the impact of over-lending, and the necessary correction. Rather they play at the edges.

That said, here is the article, which is still worth reading!

From The Conversation.

On housing, the contrast between the two major parties couldn’t be clearer.

The Coalition is still pretending that you can help first homebuyers without hurting anyone. Labor isn’t.

This matters, because Australian governments have been pretending for decades that there are easy and costless ways to make housing more affordable. And over that time the problems have become worse.

The Coalition’s First Home Loan Deposit Scheme is the latest plan that is supposed to arrest the decline in home ownership among younger Australians.

The Coalition’s First Home Deposit Scheme

Housing costs are a big problem for young people. Home ownership is falling fast in Australia, especially among the young and poor. Fewer than half of 25-34 year olds own their home today. Home ownership among the poorest 20% of that age group has fallen from 63% in 1981 to 23% today. At this rate almost half of retirees will be renters in 40 years time.

Saving a deposit is the biggest hurdle. In the early 1990s it took six years to save a 20% deposit on the average home. Today it takes 10 years. That’s bad news for younger Australians without access to the “Bank of Mum and Dad”.

The Coalition’s new plan seeks to arrest the decline by lending would-be buyers up to 15% of the purchase price, provided they’ve saved at least 5% for themselves.

It would also mean that single first home buyers on less than $125,000 a year, or couples earning less than $200,000, could save $10,000 or more by not having to pay the lenders mortgage insurance that is normally required when a purchaser has a deposit of less than 20%. There would be a cap on the value of homes purchased through the scheme, still unannounced, which would vary by region.

The Coalition is budgeting just $500 million for the guarantees. Labor was quick to match the scheme, partly because it doesn’t cost very much (unless there are unexpected losses).

Most likely, the scheme won’t have much impact.

It would increase home ownership, but only a little. It might also push up prices – but by even less. Some people saving for their first home might buy earlier. Others just priced out of the market at the moment could afford to pay a little more for a house given that they would not have to pay lenders mortgage insurance.

Most of those taking up the scheme would probably have bought anyway. Those with access to the Bank of Mum and Dad already have already been able to use such a scheme. And the income thresholds are set too high, cutting off only the top 10-15% of income earners. The New Zealand scheme, upon which the Coalition’s plan is based, cuts out at incomes of only $85,000 for singles or $130,000 for couples.

The biggest barrier for many first home owners isn’t the deposit. Their problem is qualifying for a mortgage when banks assess their ability to repay the loan assuming an interest rate of 7%, much higher than the typical 4%.

The Coalition has capped uptake at 10,000 loans every year, or about one in every ten loans (based on loans last year to first homebuyers). Even if none of them would have bought a home without the scheme (most unlikely), home ownership would be only 1% higher in a decade’s time.

But a bigger scheme might well be worse. If it “succeeded” in rapidly expanding demand from first home buyers, it would push up prices for everyone, not least all the other first home buyers trying to get into the market. Instead of being ineffective, it’d become counterproductive.

And the bigger the scheme, the greater the risks of dodgy lending, which could leave the government on the hook if buyers default.

The underlying problem with the Coalition’s latest plan – like the First Home Super Saver Scheme it introduced in 2017, or the Howard and Rudd Government’s first homeowners grants – is that it tries to fix the housing affordability problem by adding to demand for housing.

Because it costs the budget less, the new scheme is less bad than its predecessors. But it shares their critical flaw: it pretends we can make housing more affordable without hurting anyone.

Its political virtue might be that it sends a signal to first home buyers that government is on their side.

Yet the Coalition won’t pursue the one thing happen that would actually help home buyers the most: letting housing prices fall.

Labor’s negative gearing plan

Labor’s plan to abolish negative gearing on existing homes and halve the capital gains tax discount creates losers.

Labor would prevent new investors in existing homes from writing off the losses from their property investments against the tax they pay on their wages. And investors would pay tax on 75% of their gains, up from 50% now.

Its plan takes away tax breaks worth $1 billion to $2 billion a year in the short term, and more in the long term.

Existing homeowners would lose a little: The Grattan Institute estimates that house prices would be 1% to 2% lower under the Labor plan. The Commonwealth treasury and NSW treasury have reached similar conclusions.

Prospective investors who had planned to buy and negatively gear an existing house would miss out on a lot. Some might buy anyway, others wouldn’t. Despite the noise, the bulk of these people would be among the top 10% of income earners.

By reducing investor demand for existing houses, Labor’s policy could provide a genuine boost to “genuine” home ownership, by owner occupiers. Fewer investors would mean more first home buyers winning at auctions.

Recent restrictions on lending to investors imposed by the Australian Prudential Regulation Authority have already resulted in an increase in the share of lending to first homebuyers. Labor’s policies would accelerate it.

The bottom line on housing? Changing rules on negative gearing and capital gains tax is more likely to increase home ownership than guaranteeing part of the deposit.

But no policy proposed in this Commonwealth election affects the really big lever for home ownership: increasing housing supply.

Authors: Brendan Coates, Fellow, Grattan Institute; John Daley, Chief Executive Officer, Grattan Institute

‘Revolutionary Change’ Required To Address Unprecedented Global Extinction Crisis

From The Conversation.

We are witnessing the loss of biodiversity at rates never before seen in human history. Nearly a million species face extinction if we do not fundamentally change our relationship with the natural world, according to the world’s largest assessment of biodiversity.

Last week, in the culmination of a process involving 500 biodiversity experts from over 50 countries, 134 governments negotiated the final form of the Global Assessment of the Intergovernmental Science-Policy Platform for Biodiversity and Ecosystem Services (IPBES).

IPBES aims to arm policy-makers with the tools to address the relationships between biodiversity and human well-being. It synthesises evidence on the state of biodiversity, ecosystems and natures’ contributions to people on a global scale.

The IPBES Global Assessment provides unequivocal evidence that we need biodiversity for human survival and well-being. To stem unprecedented species decline the assessment sets out the actions governments, the private sector and individuals can take.

Importantly, a whole chapter of the Global Assessment (about one-sixth of the assessment) is dedicated to examining whether existing biodiversity law and policy is adequate. This chapter also outlines ways to address the vortex of biodiversity decline.

If we are to halt the continued loss of nature, then the world’s legal, institutional and economic systems must be reformed entirely. And this change needs to happen immediately.

All four species of quoll have declined dramatically in numbers because of habitat loss or change across Australia, and introduced predators such as foxes and cats. Shutterstock

What makes IPBES Assessments special?

IPBES is the biodiversity equivalent to the Intergovernmental Panel on Climate Change (IPCC). Assessments are a fundamental part of IPBES’s work.

IPBES Assessments review thousands of biodiversity studies to identify broad trends and draw authoritative conclusions. In the case of the Global Assessment, IPBES authors reviewed more than 15,000 publications from scientific and governments sources.

Governments and stakeholders give feedback on the draft text, and experts respond meticulously to the thousands of comments before revising and clarifying the draft. A final summary of key findings is then negotiated with member states at plenary meetings – these meetings concluded on Saturday.

What did the Global Assessment find?

Human activity severely threatens biodiversity and ecosystem functions worldwide. About 1 million species are facing extinction. If nothing changes many of these could be gone within just decades.

But nature is vital to all aspects of human health. We rely on natural systems, not only for food, energy, medicine and genetic resources, but also for inspiration, learning and culture.

The report also reveals the loss of biodiversity and ecosystem function is much less pronounced on lands managed by Indigenous peoples and local communities. It also recognises the significant role of Indigenous knowledge, governance systems and culturally-specific worldviews which adopt a stewardship approach to managing natural systems.

The report identified agriculture, forestry and urbanisation as the number one reason for biodiversity loss in land-based ecosystems and rivers. In the sea, fishing has had the greatest impact on biodiversity and is exacerbated by changes in the use of the sea and coastal lands.

This is followed closely by:

  • the direct use of species (primarily through harvesting, logging, hunting and fishing)
  • climate change
  • pollution
  • the invasion of non-native species.

These factors are aggravated by underlying social values, such as unsustainable consumption and production, concentrated human populations, trade, technological advances, and governance at multiple scales.

The Global Assessment concludes that current biodiversity laws and policies have been insufficient to address the threats to the natural world.

What’s more, if nothing changes, neither the Convention on Biological Diversity’s Aichi Targets nor the United Nations’ Sustainable Development Goals are likely to be met.

And yet, the Global Assessment has an optimistic outlook. It emphasises that if the world’s legal, institutional and economic systems are transformed then it is possible to achieve a better future for biodiversity and human well-being in the next 30 years.

But this is only possible if reform happens immediately, as incremental change will be insufficient.

What must be done?

Pollution is one of the main reasons biodiversity is in rapid decline. Shutterstock

The Global Assessment puts forward these next, urgent steps:

  • we need to redefine human well-being beyond its narrow basis on economic growth
  • engage multiple public and private actors
  • link sustainability efforts across all governance scales
  • elevate Indigenous and local knowledge and communities.

The report also recommends strengthening environmental laws and taking serious precautionary measures in public and private endeavours. Governments must recognise indivisibility of society and nature, and govern to strengthen rather than weaken the natural world.

What can I do?

Produce and consume sustainably

Individuals can make meaningful change through what we produce and what we buy. Our food is an important starting point. You could, for instance, choose local or sustainably produced meals and reduce your food waste.

Champion the inclusion of Indigenous peoples and local communities

Indigenous and local communities need to be included and supported more than ever before. The Global Assessment provides clear evidence that lands managed by Indigenous and local communities are performing better in terms of biodiversity. Still, these lands face serious threats, and Indigenous communities continue to be marginalised around the world.

Provoke governments to do better

Current biodiversity laws and policies don’t adequately address the threats to the natural world. The report recommends the world include biodiversity considerations across all sectors and jurisdictions to prevent further degradation of natural systems. We have an important role in rallying our governments to ensure this occurs.

We are losing biodiversity at record-breaking rates. The majesty of the natural world is disappearing and with it that which makes life worth living. We are also undermining the capacity of the Earth to sustain thriving human societies. We have the power to change this – but we need to act now.

Author: Michelle Lim, Lecturer, Adelaide Law School, University of Adelaide.

The ‘ball-tampering’ budget trick they don’t want you to know about

The first week of the federal election campaign has been dominated by heated disputes about the numbers behind both government and opposition policies, via The Conversation.

Both sides are under pressure. Notably, the cost of Labor’s 45% emissions-reduction target has been rightly questioned.

Opposition leader Bill Shorten’s answer to reporters that “our 45% reduction, including international offsets, has the same economic impact as the Liberals’ 26%” didn’t exactly engender confidence.

But the folly of Labor’s environmental plans is another tale for another column.

Our focus here is on how the Coalition is going to cut personal income tax by A$158 billion and balance the budget.

Wild assumptions

Earlier this week the Grattan Institute pointed out the Coalition’s budget assumption that expenditure will fall from 24.9% of GDP in 2018-19 to 23.6% during the next decade amounts to cutting spending by more than A$40 billion a year in 2029-30.

This raised the natural question of exactly where those cuts will come from. According to the government, it’s from things such as lower welfare payments and lower interest payments on government debt.

The Grattan Institute’s Danielle Wood described these assumptions as “heroic”. Yup.

Now, you might wonder why the Coalition’s plan to cut personal income tax doesn’t fully kick in until 2025. Or, for that matter, why its “enterprise tax plan” on corporate tax is scheduled to be phased in over a decade.

Playing outside the rules

The short answer is that for the four years following a budget – the so-called “forward-estimates period” – there are rules about banking spending cuts.

During those four years, cuts need to be specified, or economic parameters need to be varied. And with good reason. That way the actual assumptions the government is making, however fanciful they may be, are plain for all to see.

But beyond the four-year period no such discipline applies. This allows governments of all stripes to make very specific claims about, for example, tax cuts they plan to deliver without having to be at all specific about how they are going to pay for them.

This is all just a conjuring trick. Politicians try to get us to focus on the tangible, specific thing we want – tax cuts, more money for hospital or schools, free cancer treatment – while obfuscating how they are going to pay for it.

It’s dirty pool. It’s not cricket. It’s the kind of thing a mob accountant does. Pick your favourite metaphor.

Bipartisan failure

Of course, treasurer Josh Frydenberg and finance minister Mathias Cormann didn’t invent this unscrupulous practice. Wayne Swan and Penny Wong, as treasurer and finance minister respectively, were guilty of these kind of shenanigans too.

The specifics of the current round can’t even be debated properly, because ten-year “guesses” don’t lay out specific assumptions that can be checked for internal consistency and plausibility.

Sadly, it seems futile to hope for cultural change among politicians and a shift to integrity.

To some extent, we need to be the change we want.

The fact both sides of politics so brazenly play us for suckers is as much our fault as it is theirs. If politicians thought there were real consequences at the ballot box for this sort of behaviour, they would think twice.

But there aren’t. When both sides are guilty it’s understandable that voters become so cynical that they just factor it in and look to other issues.

If more voters were willing to make “cooking the books” a decisive issue, that might change.

Need for incentives

Politicians respond to incentives. My favourite illustration of that is how United Nations officials used to be exempt from parking tickets in New York City. As economists Ray Fisman and Ted Miguel showed, when norms alone governed behaviour, officials from corrupt countries basically parked wherever they wanted. Once city authorities got the ability to confiscate diplomatic licence plates of violators, things improved radically.

So as long as the mainstream media refuses to issue our politicians with the moral equivalent of parking tickets for cooking the books of public debate, politicians are going to keep doing it.

Now, many commentators do exactly that – and some of them are brilliant and fearless. But other folks, on the right and on the left, seem to have the attitude that both sides play fast and loose with the facts so it’s fine for them to call out whichever side they personally like the least.

Actually, scratch “seem to have the attitude”. They’ll tell you that to your face.

When Australian cricket captain Steve Smith and vice-captain David Warner got caught in a ball-tampering racket, there were consequences.

When our elected representative do something similar, but with our nation’s finances –with consequences for growth, employment, welfare benefits, retirement incomes, and climate change – they get a pass.

That’s got to stop; and we’ve all got our part to play.

Author: Richard Holden, Professor of Economics, UNSW

Retiree home ownership is about to plummet

From The Conversation.

Australia’s retirement incomes system has been built on the assumption that most retirees would own their home outright. But new Grattan Institute modelling shows the share of over 65s who own their home will fall from 76% today to 57% by 2056 – and it’s likely that less than half of low-income retirees will own their homes in future, down from more than 70% today.

Home ownership provides retirees with big benefits: they have somewhere to live without paying rent, and they are insulated from rising housing costs. Retirees who have paid off their mortgage spend much less of their income on housing (on average 5%) than working homeowners or retired renters (25% to 30%). These benefits – which economists call imputed rents – are worth more than A$23,000 a year to the average household aged 65 or over, roughly as much again as the maximum pension.

You’ll be OK if you own

Our 2018 report Money in Retirement showed that while Australia’s retirement income system is working well for the vast majority of retirees, it’s at risk of failing those who rent. They are more than twice as likely as homeowners to suffer financial stress, as indicated by things such as skipping meals, or failing to pay bills.

This is not surprising – renters typically have lower incomes. But the rising deposit hurdle and greater mortgage burden risks means rates of home ownership are falling fast among the presently young and the poor.

The share of 25 to 34 year olds who own their home has fallen from more than 60% in 1981 to 45% in 2016. For 35 to 44 year olds it has fallen from 75% to about 62%.

And home ownership now depends on income much more than in the past: among 25-34 year olds, home ownership among the poorest 20% has fallen from 63% to 23%.

But fewer will

Home ownership is likely to fall further in coming years. Using Grattan Institute modelling, we find that on current trends, the share of over 65s who own their home will fall from 76% today to 74% in 2026, to 70% by 2036, 64% by 2046, and 57% by 2056.

And while we don’t project home ownership rates for different income groups due to data limitations (we have the necessary Census data on home ownership rates by age and income only for 1981 and 2016), it is more than likely that less than half of low income retirees will own their homes in future, down from more than 70% today.

Today’s younger Australians will become tomorrow’s retirees.

Worsening housing affordability means renting will become more widespread among retirees. As a result, more retirees will be at risk of poverty and financial stress, particularly if rent assistance does not keep pace with future increases in rents paid by low-income renters.

And rent assistance won’t much help

The maximum rent assistance payment is indexed in line with the consumer price index, but rents have been growing faster than the consumer price index for a long time. Between June 2003 and June 2017, the consumer price index climbed by 41%, while average rents climbed by 64%.

That’s why our Money in Retirement report recommended boosting Commonwealth Rent Assistance by 40%, at a cost of $300 million a year in today’s dollars. That would restore it to the buying power it had 15 years ago. It should be indexed in future to changes in the rents typically paid by the people who get it, so its value is maintained, as recommended by the Henry Tax Review.

There’s another important implication. Retirement incomes are likely to become more unequal in future. Money in Retirement found that in general future retirees will have adequate retirement incomes. Most workers today can expect a retirement income of at least 89% of their pre-retirement income, well above the 70% benchmark used by the Organisation for Economic Co-operation and Development, and more than enough to maintain pre-retirement living standards.

But a retirees who rent will have much less for living on.

There will be ‘haves’ and more ‘have nots’

Among home-owners, an increasing proportion will be still paying off their mortgages when they retire – the proportion of 55 to 64 year olds who own their home outright fell from 72% in 1995-96 to 42% in 2015-16. Some will (quite rationally) use some or all of their super to pay off their mortgage.

And rising housing costs will in time force retirees to draw down on more of the value of their home to fund their retirement.

Currently, few retirees downsize or borrow against the equity of their home while continuing to live in it. But that will have to change.

House prices have outstripped growth in incomes. Median prices have increased from around four times median incomes in the early 1990s to more than seven times median incomes today (and more than eight times in Sydney).

Government policy should continue to encourage these retirees to draw down on the increasingly valuable equity of their homes to help fund their retirement. They are not the ones who will need government help. The government’s recent expansion of the Pension Loans Scheme that allows all retirees to borrow against the value of their homes is a step in that direction.

Retirement is going to change in the years ahead. Most retirees will be far from poor, many of them better able to support themselves than ever before. But an increasing number will not. They are the ones who will need our help.

Authors: Brendan Coates, Fellow, Grattan Institute; Tony Chen, Researcher, Grattan Institute