Fed Hikes As Expected – More To Come…

The Fed moved as expected, and continues to highlight more upward movements in the months ahead – in fact their language is arguably more bullish now.  The target range for the federal funds rate is now 2 to 2-1/4 percent.

In their projection release, they see GDP sliding from 2019….

… while inflation is expected to rise:

Information received since the Federal Open Market Committee met in August indicates that the labor market has continued to strengthen and that economic activity has been rising at a strong rate. Job gains have been strong, on average, in recent months, and the unemployment rate has stayed low. Household spending and business fixed investment have grown strongly. On a 12-month basis, both overall inflation and inflation for items other than food and energy remain near 2 percent. Indicators of longer-term inflation expectations are little changed, on balance.

Consistent with its statutory mandate, the Committee seeks to foster maximum employment and price stability. The Committee expects that further gradual increases in the target range for the federal funds rate will be consistent with sustained expansion of economic activity, strong labor market conditions, and inflation near the Committee’s symmetric 2 percent objective over the medium term. Risks to the economic outlook appear roughly balanced.

In view of realized and expected labor market conditions and inflation, the Committee decided to raise the target range for the federal funds rate to 2 to 2-1/4 percent.

In determining the timing and size of future adjustments to the target range for the federal funds rate, the Committee will assess realized and expected economic conditions relative to its maximum employment objective and its symmetric 2 percent inflation objective. This assessment will take into account a wide range of information, including measures of labor market conditions, indicators of inflation pressures and inflation expectations, and readings on financial and international developments.

Voting for the FOMC monetary policy action were: Jerome H. Powell, Chairman; John C. Williams, Vice Chairman; Thomas I. Barkin; Raphael W. Bostic; Lael Brainard; Richard H. Clarida; Esther L. George; Loretta J. Mester; and Randal K. Quarles.

US Unemployment Remains Steady At 3.9%

The US Bureau of Labor Statistics has released their August employment statistics.

Total nonfarm payroll employment increased by 201,000 in August, and the unemployment rate was unchanged at 3.9 percent, the U.S. Bureau of Labor Statistics reported today.

Job gains occurred in professional and business services, health care, wholesale trade, transportation and warehousing, and mining. Household Survey Data The unemployment rate remained at 3.9 percent in August, and the number of unemployed persons, at 6.2 million, changed little.

Among the major worker groups, the unemployment rates for adult men (3.5 percent), adult women (3.6 percent), teenagers (12.8 percent), Whites (3.4 percent), Blacks (6.3 percent), Asians (3.0 percent), and Hispanics (4.7 percent) showed little or no change in August.

The number of long-term unemployed (those jobless for 27 weeks or more) was little changed in August at 1.3 million and accounted for 21.5 percent of the unemployed. Over the year, the number of long-term unemployed has declined by 403,000.

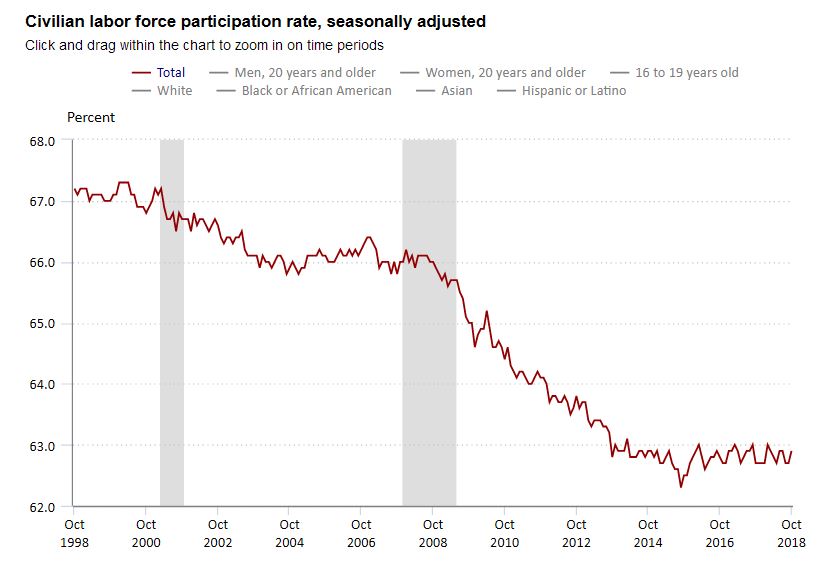
Both the labor force participation rate, at 62.7 percent, and the employment-population ratio, at 60.3 percent, declined by 0.2 percentage point in August.

The number of persons employed part time for economic reasons (sometimes referred to as involuntary part-time workers), at 4.4 million, changed little over the month but was down by 830,000 over the year. These individuals, who would have preferred full-time employment, were working part time because their hours had been reduced or they were unable to find full-time jobs.

In August, 1.4 million persons were marginally attached to the labor force, little different from a year earlier. (Data are not seasonally adjusted.) These individuals were not in the labor force, wanted and were available for work, and had looked for a job sometime in the prior 12 months. They were not counted as unemployed because they had not searched for work in the 4 weeks preceding the survey.
Among the marginally attached, there were 434,000 discouraged workers in August, essentially unchanged from a year earlier. (Data are not seasonally adjusted.) Discouraged workers are persons not currently looking for work because they believe no jobs are available for them. The remaining 1.0 million persons marginally attached to the labor force in August had not searched for work for reasons such as school attendance or family responsibilities.

Total nonfarm payroll employment increased by 201,000 in August, in line with the average monthly gain of 196,000 over the prior 12 months. Over the month, employment increased in professional and business services, health care, wholesale trade, transportation and warehousing, and mining.


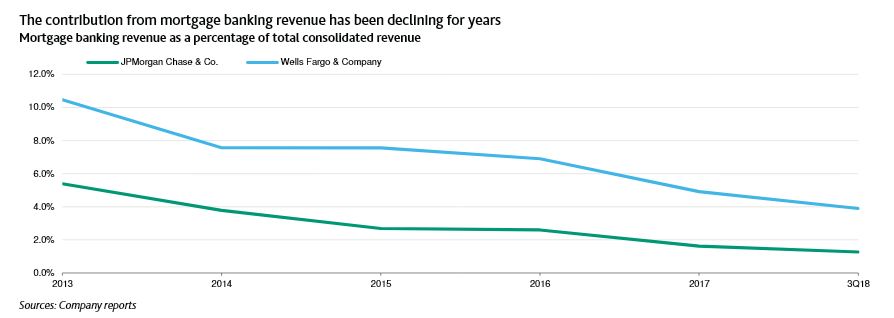
U.S. Non-Bank Mortgage Lender Margins May Fall Further

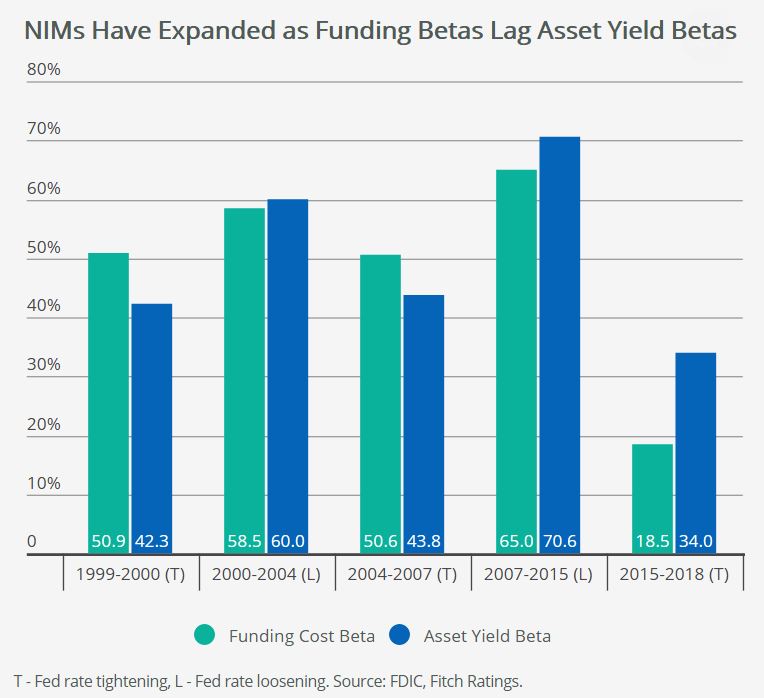
U.S. non-bank mortgage lenders may face further margin pressure as interest rates continue to rise owing to higher funding costs relative to banks with lower-cost, stable depository funding, Fitch Ratings says.

Profitability metrics for non-bank mortgage lenders are generally weak, with expenses outstripping net revenues by approximately 21% across the five public non-bank mortgage companies for the 4.5-year period ending June 30, 2018.

We expect consolidation to continue as a result of weak profitability, with non-bank lenders seeking scale efficiencies to combat rising rates, persistently high technology and regulatory compliance costs, and declining refinancing activity. That said, non-bank lenders with multiple origination channels and established mortgage servicing platforms that generate higher fee income and more sustainable earnings should be better positioned for the shifting trends of the interest rate and economic cycles. These lenders are generally less exposed to cyclical swings in the mortgage market, as the complementary nature of origination and servicing businesses can serve as a natural hedge, reducing earnings volatility.

Aside from driving funding costs higher, Fitch also sees rising interest rates as a headwind to origination volumes, which could further pressure profitability in the medium term. Forecasts by the Mortgage Bankers Association (MBA) call for originations of $1.6 trillion annually from 2018-2020, down 6% from 2017 levels. Refinancings should drop to 24% of originations by 2020, down from 49% in 2016, in the face of rising rates, according the MBA.

Positively, mortgage servicing right (MSR) valuations generally increase with rising rates and economic growth, as prepayments fall and default risk lessens. Reflecting these dynamics, MSR valuations have increased in recent years, averaging 104bps of the unpaid principal balance of servicing portfolios for the five public non-bank mortgage companies.

Ratings assigned to non-bank mortgage servicers are typically in the ‘B’ to ‘BB’ rating categories, reflecting the highly cyclical and monoline nature of the business, valuation volatility associated with MSRs, elevated legislative and regulatory scrutiny, weak earnings profiles and reliance on short-term wholesale funding sources.

US Boom Phase – What Next?

Mark Zandi, Chief Economist, Moody’s Analytics has penned an interesting piece suggesting that there is excessive risk taking among US corporate, as the business cycle moves past its zenith.  There are some worrying similarities between corporate leveraged lending and the subprime mortgage lending of the last crash.

The U.S. business cycle has entered its boom phase. This is a period that typically comes closer to the end of the cycle, just prior to a recession. It is characterized by robust economic growth, tightening labor and product markets, intensifying wage and price pressures, monetary tightening, and higher interest rates.

Another feature of the boom phase of a business cycle is excessive risk-taking somewhere in the financial system. This fuels the boom and is eventually at the center of the subsequent bust. Subprime mortgage loans were the obvious culprit a decade ago, runaway internet stocks that pumped up a stock market bubble were the problem in the early-2000s recession, and the savings and loan crisis incited the early 1990s downturn.

Risk-taking is clearly on the rise in this cycle, the aforementioned overvalued asset markets and easier underwriting are testimonial, but it is unclear precisely what might do this cycle in. There has been handwringing that households may be overborrowing again. But this concern seems overblown. Household credit growth is consistent with income gains, and debt loads that had fallen sharply after the last recession show no indication of rising. Debt service burdens remain low. And personal savings rates look ample after recent data revisions.

To be sure, vehicle and retail card lenders were extending too much credit not too long ago, and credit quality eroded. But lenders have since upped their standards, and delinquencies have peaked. Student loans are a problem, but not for the financial system, since the bulk of these loans are backed by the federal government. Student loans are thus a taxpayer problem, which could manifest itself in the next downturn by adding to the nation’s fiscal problems; policy makers will be under intense pressure to forgive and forbear on more of this debt.

Even so, worries that the nation’s ballooning budget deficits and debt load could do this cycle in are also overdone. They are a corrosive on growth as they push up long-term interest rates, but we are still a long way from U.S. Treasury bonds losing their safe-haven status to global investors. Municipal debt is more of an issue. But, while it will likely exacerbate the next recession, it won’t be the catalyst for it.

Leveraged lending

The most serious developing threat to the current cycle is lending to highly leveraged nonfinancial businesses. Across all businesses, borrowing appears manageable. The ratio of debt outstanding to GDP is about as high as it has ever been, yet this is a continuation of a long-running trend and reflects a broadening in the availability of credit to more businesses. The ratio of debt to business profits looks even more benign—largely unchanged since the early 1980s, abstracting from recessions when profits are hammered.

However, while businesses appear to be in good shape in aggregate, a significant number of highly leveraged companies are taking on sizable amounts of debt. This is evident in the rapid growth of socalled leveraged loans—loans extended to companies that already have considerable debt. These loans tend to have floating rates—typically Libor plus a spread—with a below-investment-grade (Baa or less) rating.

Leveraged loan volumes are setting records, and loans outstanding have increased at a double-digit pace over the past five years to nearly $1.4 trillion. Businesses use the loans to finance mergers, acquisitions and leveraged buyouts, followed by refinancing, and to pay for dividends, share repurchases and general expenses.

Powering leveraged lending is demand from the collateralized loan obligation market. CLOs are leveraged loans that have been securitized, and global investors can’t seem to get enough of them. This is clear from the thin spreads between CLO yields and comparable risk-free Treasuries.

Approximately one-half of leveraged loans currently being originated are packaged into CLOs, with CLO outstandings approaching $550 billion.

Easing underwriting

To meet the strong demand for leveraged loans from the CLO market, lenders are easing their underwriting standards. According to the Federal Reserve’s survey of senior loan officers at commercial banks, a net 15% of respondents say they lowered their standards on commercial and industrial loans to large and medium-size companies this quarter compared with the previous quarter. The only other time loan officers eased as aggressively on a consistent basis was at the height of the euphoria leading up the financial crisis in the mid-2000s. Standards for loans to small companies have not eased nearly as much, since they are much less likely to be bundled into a CLO.

Covenants on leveraged loans—restrictions on borrowers to ensure they can repay their loans—have also deteriorated, according to Moody’s Investors Service. The rating agency’s loan covenant quality indicator has fallen to its lowest level in its six-year history. Borrowers are negotiating greater flexibility to manage their balance sheets by moving or selling collateral, and they are increasingly able to sell collateral without using the proceeds to pay down their loans. It is becoming more unclear whether the collateral backstopping loans will be available in a bankruptcy.

The easing in underwriting is also evident in the below-investment-grade or junk corporate bond market.

The junk market hasn’t kept pace with the surging leveraged loan market, but it is nearly as big, with more than $1.3 trillion in outstandings. Here as well, bond covenants have eroded substantially in recent years, according to the rating agency, with the Moody’s bond covenant quality indicator currently hovering near record lows.

Eerie similarities

Considering the leveraged loan and junk corporate bond market together, highly indebted nonfinancial companies owe about $2.7 trillion. Their debts have been accumulating quickly as creditors have significantly eased underwriting standards. As interest rates rise, so too will financial pressure on these borrowers. Despite all this, global investors appear sanguine, as credit spreads in the CLO and junk corporate bond market are narrow by any historical standard.

Regulators are undoubtedly nervous—they issued guidance to banks to rein in their leveraged lending in 2013—but an increasing amount of the most aggressive lending is being done by private equity, mezzanine debt, and other institutions outside the banking system and regulators’ purview.

Now consider that subprime mortgage debt outstanding was close to $3 trillion at its peak prior to the financial crisis. Insatiable demand by global investors for residential mortgage securities drove the demand for subprime mortgages, inducing lenders to steadily lower their underwriting standards.

Subprime loans were adjustable rate, which became a problem in a rising rate environment as borrowers didn’t have the wherewithal to make their growing mortgage payments. Regulators were slow to respond, in part because they didn’t have jurisdiction over the more egregious players.

It is much too early to conclude that nonfinancial businesses will end the current cycle in the way subprime mortgage borrowers did the previous one. Even so, while there are significant differences between leveraged lending and subprime mortgage lending, the similarities are eerie.

Does A Yield Curve Inversion Lead To A Recession?

Today we consider whether the shape of the yield curve is a good indicator of a future recession in the US.

To answer that question, let’s look at the longer term trends, using data from one of our favourite data sources FRED.  FRED is the St. Louis Fed datasets, which contains a wide range of useful indices.

Here is plot of the 10 year rates since 1980. The shaded areas are US recessions, when the economy shrank (generally seen as a negative indicator), certainly unemployment rose as is clearly evident as a direct result of the recession.

But now let’s look at the 10-year rate from the 1980’s, and overlay the 3-month rate also. In the video we follow the inflection points, and here is the thing. Prior to each of the last three US recessions, the short-term rate overtook the long term rate in a classic inversion of the yield curve. And we see recessions follow.

The logic behind the inverted yield curve as a recession indicator is simple: if long-term yields are lower than short-term yields, the market’s view is that growth will slow in the coming years. More often than not, that view has been right.

From this, we can say there is clear evidence that once the yield curve does reverse, a recession will likely follow. But what does that tell us about the current situation? Well currently short term rates have been rising sharply, more so than long term rates, as the Fed draws in their QE horns. If that trend continues, the yield curve will go negative, and in that case a US recession is highly likely. And on current trajectory that could happen within a couple of years.

However, beware, because there were cases when the US yield curve inverted but a recession did not follow. For example, in the late 1980s, the yield curve inverted and then steepened again, before inverting again later on before a recession hit. The curve also inverted very briefly in the late 1990s, too, and again in 2005-2006. However, the trends to my mind do signal a recession, but the timing does vary. Sometimes it happens in just a few months, in other cases it’s taken a year or two. But it does look like a yield inversion is an important signal to watch for, worth bearing in mind when people are taking about all the reasons why the stock market in the US should go higher still.

How Far Will U.S. Housing Momentum Ease?

From Moody’s

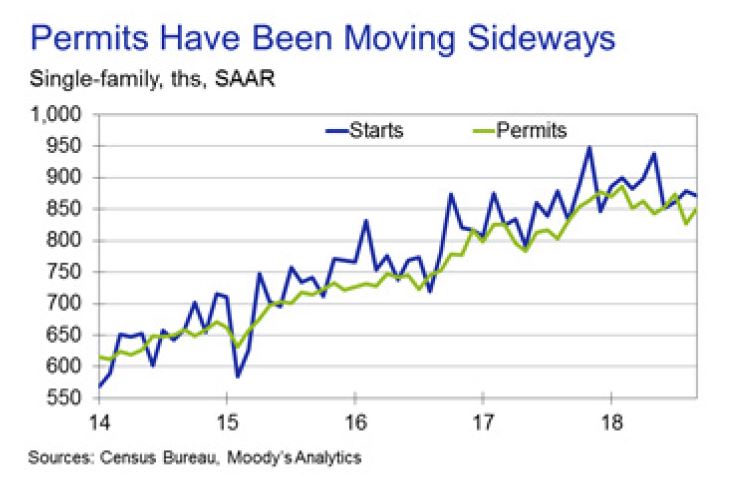
The U.S. housing market has garnered attention recently but for the wrong  reason amid numerous signs of some weakening. Parts of the housing market have likely peaked while others haven’t, including new-home sales and construction, which pack the biggest GDP and employment punch.

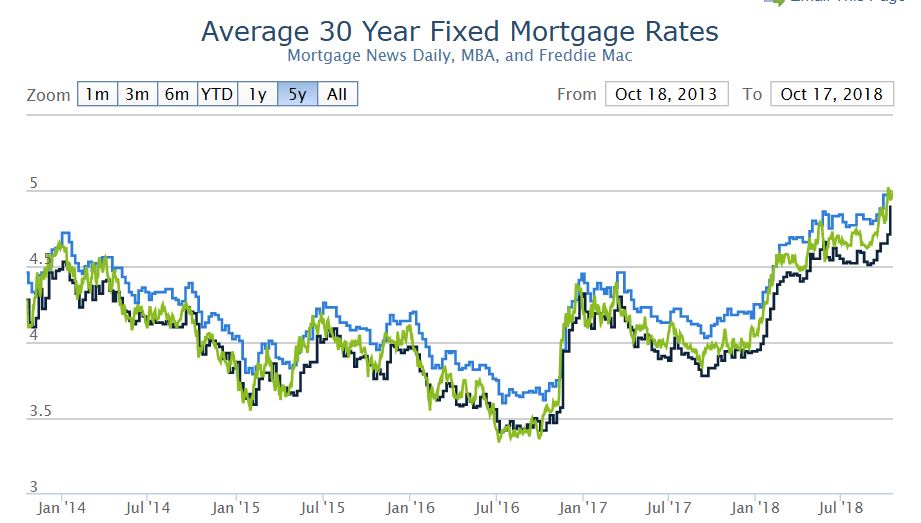
Source: Mortgage News Daily.

Before assessing where housing is headed, it’s important to identify the possible culprits in the recent weakness in sales and construction. Common theories being tossed around blame the tax legislation that reduced the incentive to be a homeowner by increasing the standard deduction, lowering the deduction for a new mortgage, and capping the deductible amount of state and local taxes (which include property taxes) at $10,000 per year. More time is needed to assess the law’s impact on housing, since evidence is lacking. Sales of higher-priced homes, which would be most vulnerable, have been climbing. The tax legislation’s drag on housing will likely play out by reducing home sales and pushing some households to rent instead of buy, potentially putting upward pressure on rents.

We believe that affordability issues, mainly mortgage rates, are a more credible reason for housing’s recent slump. Affordability is a function of house prices, mortgage rates and income. Earlier this year, we noted that there was evidence that the housing market’s sensitivity to mortgage rates is increasing. The recent weakness in housing is consistent with this, since past increases in mortgage rates have been sufficient enough to be a drag.

To assess the impact, we ran through our U.S. macro model a scenario of a permanent increase in mortgage rates of 1 percentage point in the first quarter. That would be roughly the average of the gain during the taper tantrum and following the presidential election. The results show that the hit to residential investment is noticeable over the course of the subsequent year; real residential investment would be 7% lower than the baseline —enough to shave 0.1 to 0.2 percentage point off GDP growth for the year.

So far, mortgage rates have risen by 60 basis points this year, so the hit is smaller than our exercise, but it supports our view that higher interest rates are hurting housing.

Though there are headwinds, new-home sales and construction haven’t peaked, as fundamentals remain supportive. To estimate the underlying demand for new housing units, we broke it up into its main components, the trend in household formations, demand for second homes, and scrappage or obsolescence. The biggest source of demand is household formations, which have been running around 1.3 million per annum recently and this should continue over the next couple of years.

Demand for second homes tends to grow with the total number of housing units. We estimate that demand is running around 200,000 per annum. Housing units are scrapped from the housing stock each year because of demolition, disaster and disrepair. We estimate scrappage at 200,000 per year.

Even though underlying demand for new housing units is 1.7 million,  housing starts should exceed that. Each year some housing units are started but never completed; assuming this is 1% of total housing starts—likely conservative—that would be an additional 17,000 starts. Underlying  demand is about 25% below housing starts in the first half of this year. To close this gap over the next two years, would require homebuilding to rise 15% per annum. However, given the constraints facing builders this is unlikely. Alternatively, closing the gap in four years would require  approximately an 8% gain per annum. Therefore, residential investment won’t be booming but it will be respectable.

What Does A Yield Curve Inversion Really Signal?

We look at the latest US data, and check the history of yield curve inversions and their link to recessions.

Please consider supporting our work via Patreon

FRED

Economics and Markets
What Does A Yield Curve Inversion Really Signal?
Loading
/

You Ain’t Seen Nothing Yet

We look at the FED QT and its potential impact.

Please consider supporting our work via Patreon

Please share this post to help to spread the word about the state of things….

Economics and Markets
You Ain't Seen Nothing Yet
Loading
/

US Bank Supervision Gets The Hump

From The St. Louis Feds On The Economy Blog.

The health of banks is important to everyone, whether a borrower or a saver, an individual or a business. Subject to certain restrictions, bank deposits up to $250,000 are insured by the Federal Deposit Insurance Corp. The agency’s deposit insurance fund is financed by banks through fees. For catastrophic events, the fund is further supported by a $100 billion line of credit at the Treasury Department, meaning that taxpayers serve as the ultimate backstop in the event of a crisis.1

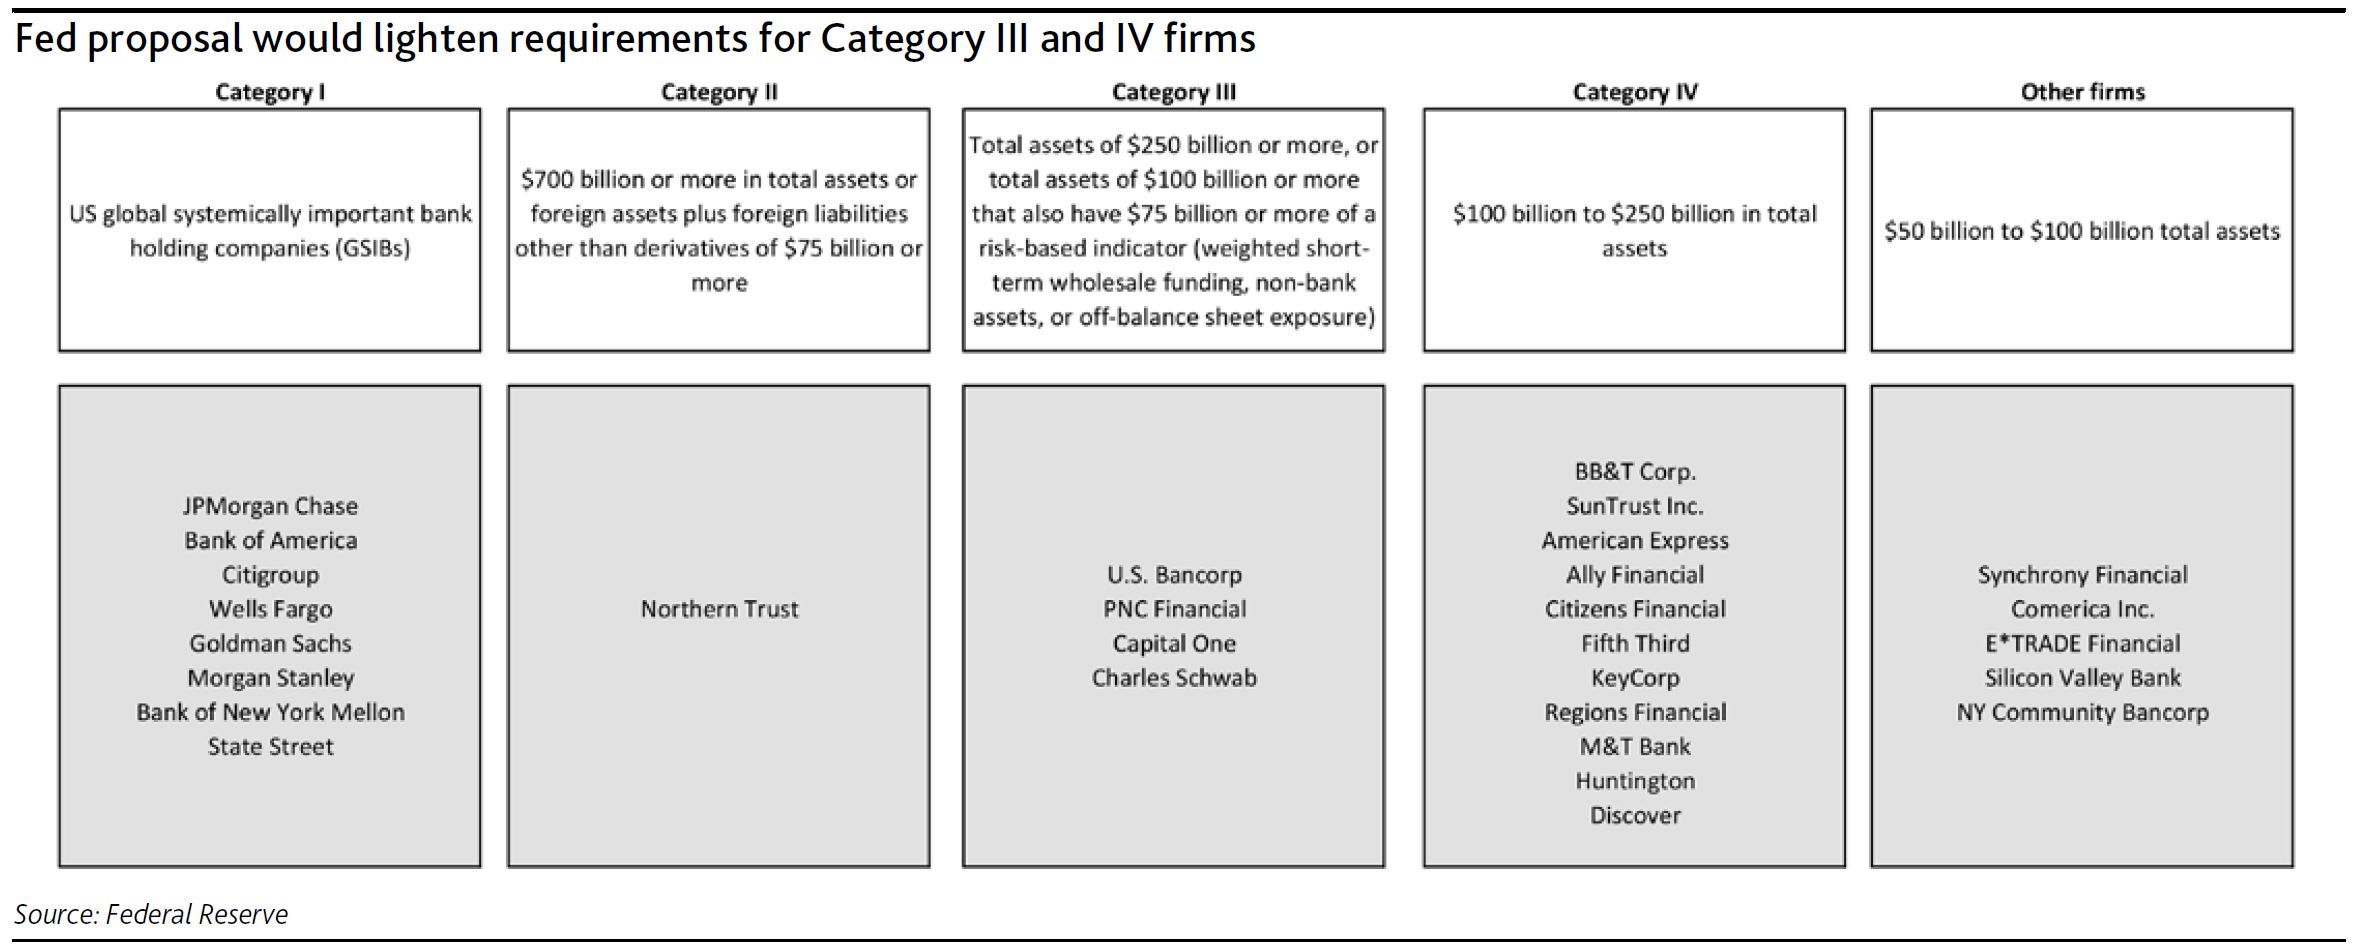
Because of the government safety net and in support of financial stability, bank supervisors monitor the health of banks through periodic examinations. At the conclusion of its exam, each bank is assigned a rating—called CAMELS—that allows comparisons of bank health over time and with peers.

CAMELS as a Health Monitor

CAMELS is an acronym representing its six components:

  • Capital adequacy
  • Asset quality
  • Management
  • Earnings
  • Liquidity
  • Sensitivity to market risk

Banks are rated on each component, and a composite rating is also computed. Ratings range from one to five:

  • 1 is “strong.”
  • 2 is “satisfactory.”
  • 3 is “less than satisfactory.”
  • 4 is “deficient.”
  • 5 is “critically deficient.”

To earn a 1 on any component, a bank must show the strongest performance and risk management practices in that area. Alternatively, a rating of 5 indicates weak performance, inadequate risk management practices and the highest degree of supervisory concern.

The overall, or composite, rating for each bank is based on the six components. However, it is not an arithmetic average of the individual component ratings. Rather, some components are weighed more heavily than others based on examiner judgment of risk.

For community banks, the asset quality rating is critical because of the size of the loan portfolio at small banks. We’ll take a deeper dive into asset quality and the other individual components of CAMELS in upcoming posts.

Who Sees the Rating?

At the conclusion of each examination, the bank’s rating is revealed to senior bank management and the board of directors. If the rating is 3, 4 or 5, the board is typically required to enter into an agreement with bank supervisors to correct the issues. The most serious deficiencies can result in formal supervisory actions that can be enforced in court.

Each bank’s CAMELS ratings and examination report are confidential and may not be shared with the public, even on a lagged basis. In fact, it is a violation of federal law to disclose CAMELS ratings to unauthorized individuals.2 Outsiders may monitor bank health through private-sector firms that use publicly available financial data to produce their own analysis of bank health, sometimes even using their own rating system.

Notes and References

1 The FDIC may borrow money from the U.S. Treasury, the Federal Financing Bank and individual banks to replenish the fund on a temporary basis. See the FDIC’s Federal Deposit Insurance Act page for more information.

2 Violators may be assessed criminal penalties under 18 USC §641.

US Corporate Trade Warnings Portend Softer Capex – Fitch

Growing concerns in the US business community about the potentially adverse effects of tariffs could cause modest deterioration in US manufacturing activity and capital spending by YE 2018, according to Fitch Ratings.

The escalation of the US-China trade dispute and the notable absence of constructive negotiations point to a continuation of trade-related uncertainty for US businesses through the second half of the year.

We expect approximately 3% growth in aggregate capital spending for Fitch’s universe of rated US corporates in 2018, following 6% growth in 2017, due in part to the cash benefits of tax reform. However, warnings that business strategies may be altered and capital projects delayed, along with potential pressure on exports, suggest capex trends could weaken. We currently expect aggregate capex to decline 0.8% in 2019. This may mark a potential inflection point in the current late-stage business cycle.

Several US companies, including Harley Davidson, Brown-Forman, and General Motors (GM), have spoken out on the potential adverse effects of escalating trade tensions. Harley-Davidson plans to move production of motorcycles for EU markets to its non-US plants to avoid retaliatory tariffs that would add an average of $2,200 to the cost of motorcycles exported to the region from the US. Brown-Forman cautioned that trade issues could negate benefits of a strong economy with the uncertainty making it difficult to accurately forecast earnings. GM indicated that potential US auto tariffs would raise prices of its vehicles, reduce its global competitiveness and lead to a loss of US jobs.

Comments by companies across various sectors, including electrical equipment, appliances and components, and food, beverage, and tobacco, were noted in the Federal Reserve’s June meeting minutes and the Institute for Supply Management’s (ISM) Purchasing Manager survey. This reflects broadening concern over the influence trade-related uncertainty is having on business sentiment and growth plans. Moreover, industry groups such as the US Chamber of Commerce and the Alliance of Automobile Manufacturers that support the business community are lodging complaints to the Trump Administration.

US leading economic indicators currently suggest overall business sentiment remains strong and manufacturing activity continues to expand due to a healthy growth outlook. The US Purchasing Manager’s Index (PMI) was near peak levels, rising to 60.2% in June from 58.7% in May. The index has only exhibited slight volatility in response to trade developments over the past year. The Philadelphia Fed’s survey of business intentions, a good bellwether of future capital spending plans, has recently declined slightly from very healthy levels, perhaps in response to protectionist threats.

Eurozone PMIs continue to signal expansion but have consistently declined since the beginning of 2018. Earlier in July, we noted increased trade tensions have raised the risk that additional tit-for-tat measures could have a greater impact on global economic growth than those seen so far. This would particularly be the case given the fact that investment and net exports are key components of GDP.

According to the ISM, expansion in new orders, production and employment drove the increase in the June US PMI reading. Inventories continue to struggle to maintain expansion levels, as a result of supplier deliveries slowing further. Labor constraints and supply chain disruptions continue to limit full production potential and price increases across all industry sectors remain on the rise. Additional rounds of tariffs could place further upward pressure on input costs, disrupt supply chains and weaken manufacturing activity in the near-term.