Overnight the US markets took a dive on the back of higher interest rates with the S&P 500 and the Dow marking their biggest daily declines since Feb. 8, and technology stocks at the center as investors jettisoned more risky assets. Plus, Investors were also worried about the impact of trade tensions on corporate profits and Hurricane Michael’s landfall in Florida adding to the uncertainty.
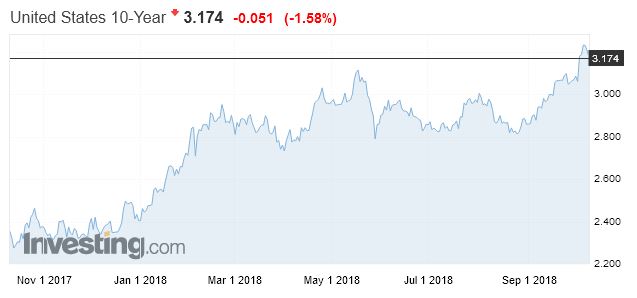
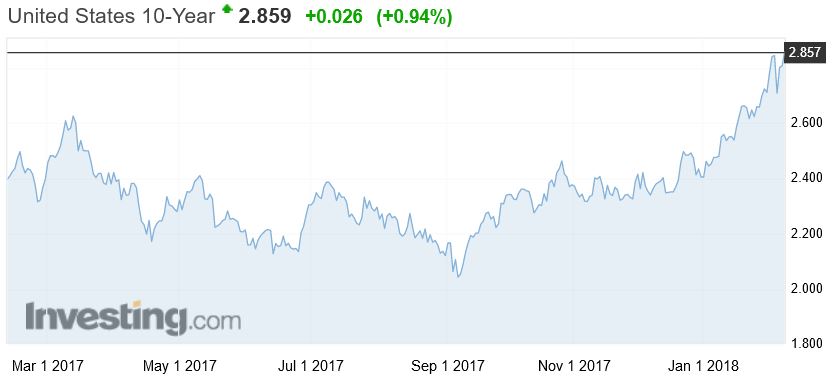
The U.S. 10 Year Treasury yields rose again in extension of a trend over the last few weeks fuelled by solid U.S. economic data that reinforced expectations of multiple interest rate hikes over the next 12 months.
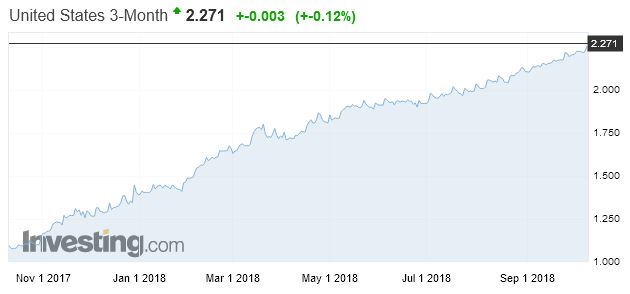
It ended at 3.17, down 1.58% on the day, while the 3-month Treasury was up 0.12% to 2.27.
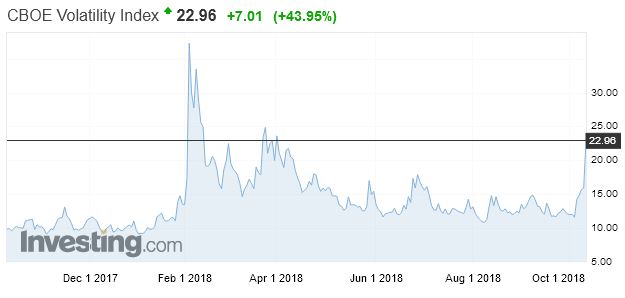
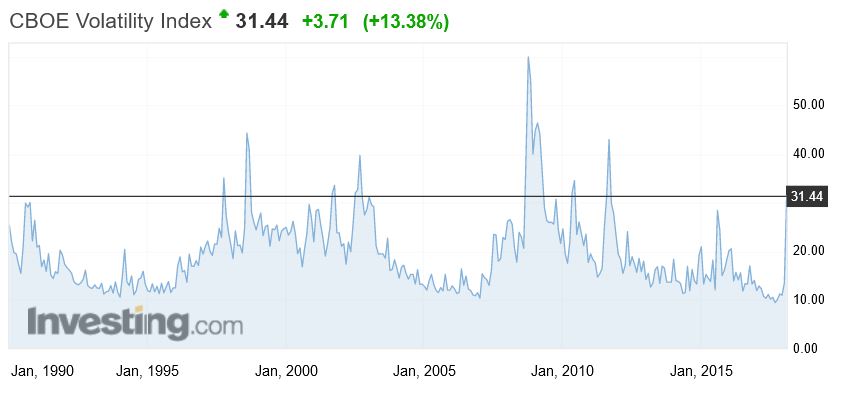
The CBOE Volatility Index (VIX), Wall Street’s “fear gauge,” rose 7 points, or nearly 44 percent, to 22.96, going above 20 for the first time since April 11 and hitting its highest close since April 2.
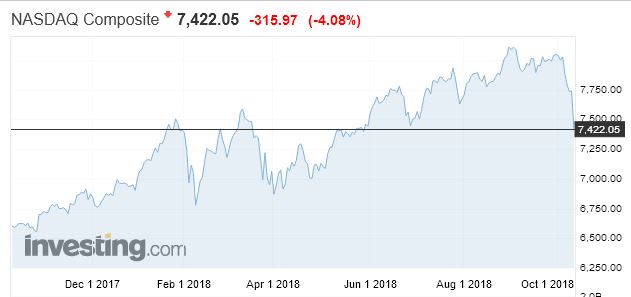
The Nasdaq ended at 7,422 and registered its biggest daily drop since June 24, 2016, hurt by technology stocks which had their biggest one-day drop since August 2011.
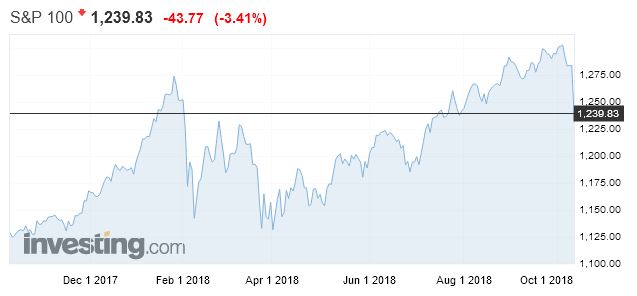
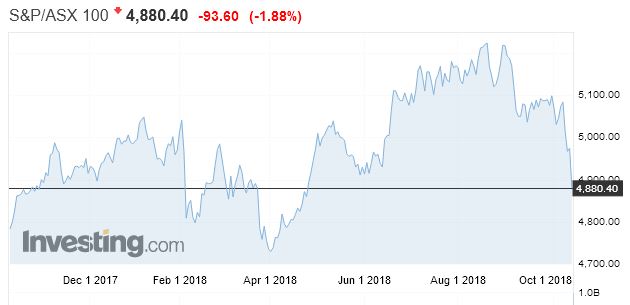
The S&P 100 ended the day down 3.41 percent, to 1,239, nearly 5% off its recent September highs.
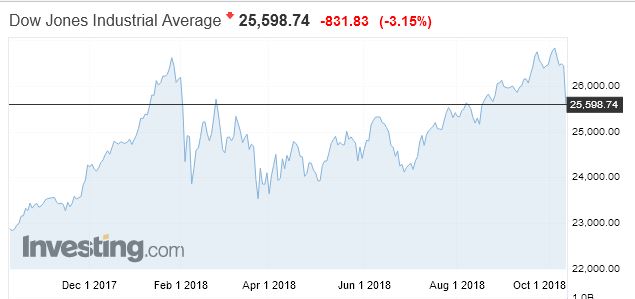
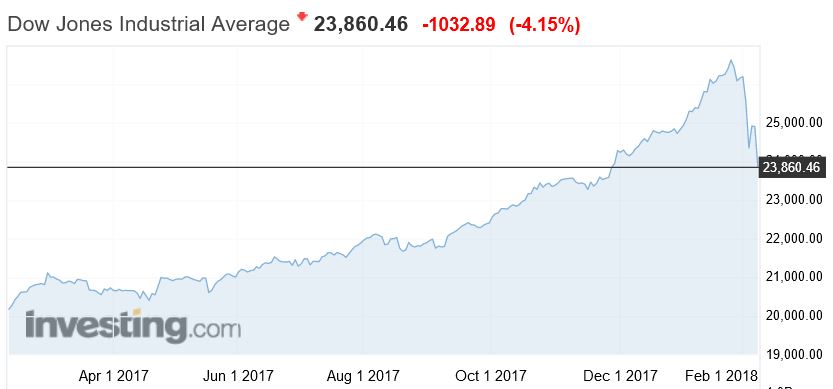
The Dow Jones Industrial Average (DJI) fell 831.83 points, or 3.15 percent, to 25,598.74, a reversal from recent highs.
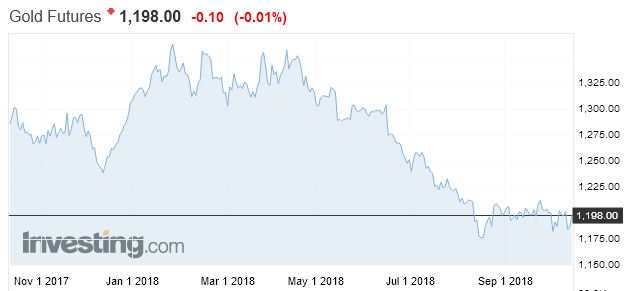
Gold however hardly moved, sitting at 1,198 almost flat for the day.
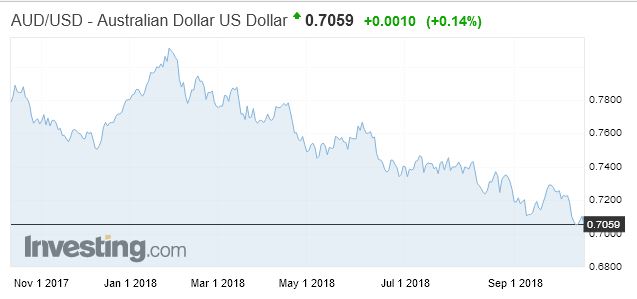
The Aussie slide further against the US dollar, and is currently silting at 70.59.
Expect more bad news from the local market today as uncertainty reigns supreme. It’s too soon to tell is this is another blip, of a more fundamental swing in confidence, but we think the higher US rates are the key. So expect more falls ahead.
Thus far, the corporate credit market has been relatively steady amid equity market turmoil. Corporate credit’s comparative calm stems from expectations of continued profit growth that underpins a still likely slide by the high-yield default rate. The record shows that 90% of the year-to-year declines by the default rate were joined by year-to-year growth for the market value of U.S. common stock.
Today’s positive outlooks for business sales and operating profits suggest that equities will recover once issues pertaining to interest rates are sufficiently resolved. For now, equities may be paying dearly for having been more richly priced vis-a-vis fundamentals when compared to corporate bonds.
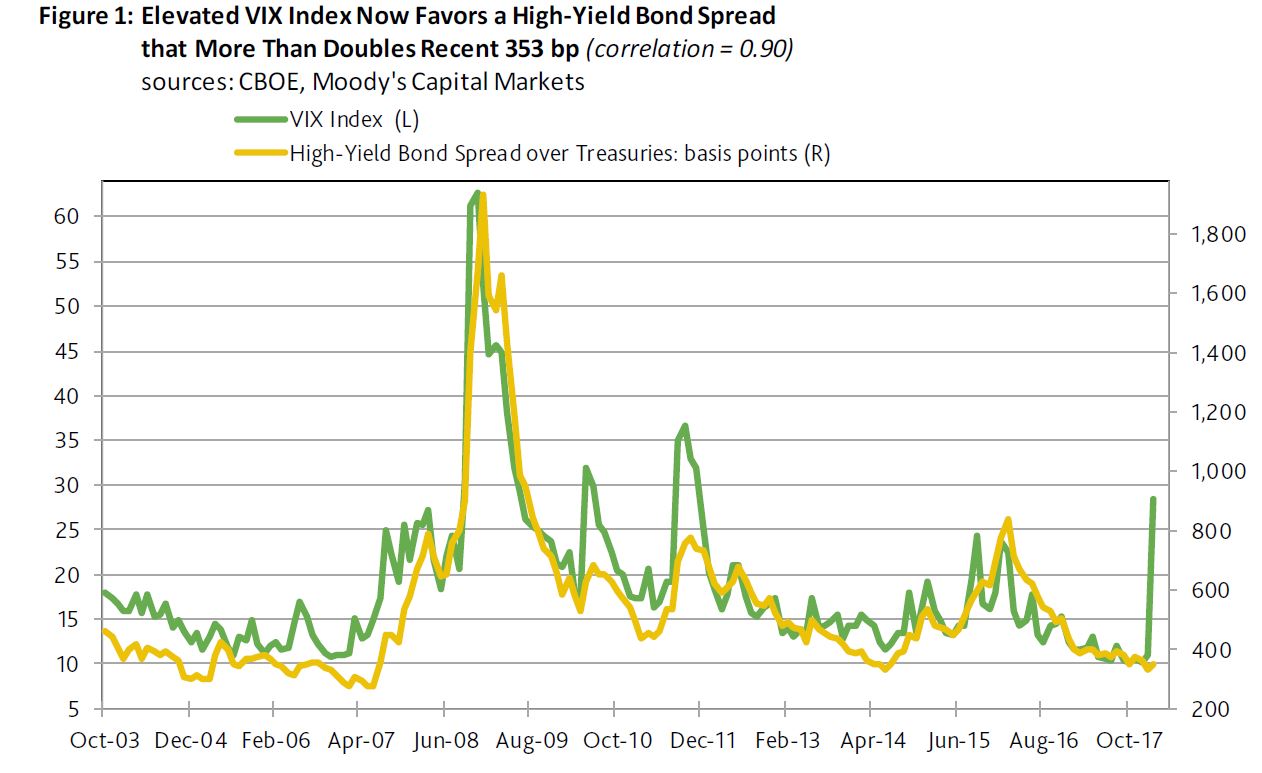
Since the VIX index’s current estimation methodology took effect in September 2003, the high-yield bond spread has generated a strong correlation of 0.90 with the VIX index. However, for now that ordinarily tight relationship has broken down. Never before has the high-yield bond spread been so unresponsive to a skyrocketing VIX index.
The VIX index’s 28.5-point average of February-to-date has been statistically associated with an 832-basis-point midpoint for the high-yield bond spread. Instead, the high-yield bond spread recently approximated 353 bp. Thus, the high-yield spread predicted by the VIX index now exceeds the actual spread by a record 479 bp.
The old record high gap was the 364 bp of October 2008, or when the actual spread of 1,398 bp would eventually surpass the 1,762 bp predicted by the VIX index. Not long thereafter, the actual high-yield spread would peak at the 1,932 bp of December 2008.
More recently, or during the euro zone crisis of 2011, the 1,018 bp high-yield spread predicted by the VIX index was as much as 323 bp above August 2011’s actual spread of 695 bp. After eventually peaking at October 2011’s 775 bp, the spread narrowed to 590 bp by August 2012.
What transpired following August 2011 and October 2008 warns against being too quick to dismiss the possibility of at least a 100 bp widening by the latest high-yield spread. Nevertheless, high-yield spreads would be significantly thinner one year after the gap between the predicted and actual spreads peaked.
For example, by August 2012, the high-yield spread had narrowed to 590 bp, while the spread had thinned to 737 bp by October 2009.
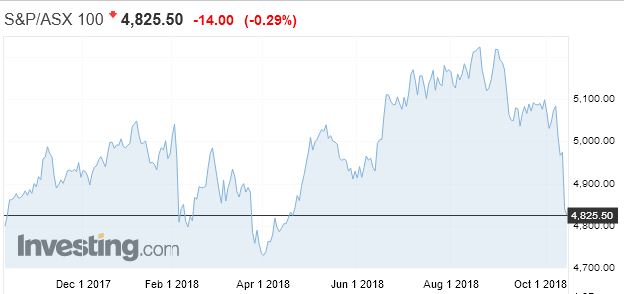
The latest print of the VIX or fear index highlights the switch in sentiment over the past week.
Given the ongoing gyrations in the major markets, (US down more than 4% today) it appears that the explanation of the correction as a flash crash thanks to programme trading is too simplistic.
This is going to play out over weeks and months, and it is all about interest rate hikes.
The Bank of England inflation statement over night also underscored rates are on the up, though they kept the rate at 0.5% and movements will be gradual
Any future increases in Bank Rate are expected to be at a gradual pace and to a limited extent. The Committee will monitor closely the incoming evidence on the evolving economic outlook, and stands ready to respond to developments as they unfold to ensure a sustainable return of inflation to the 2% target.
The US T10 Bond Yields are still elevated, and signals higher rates ahead.
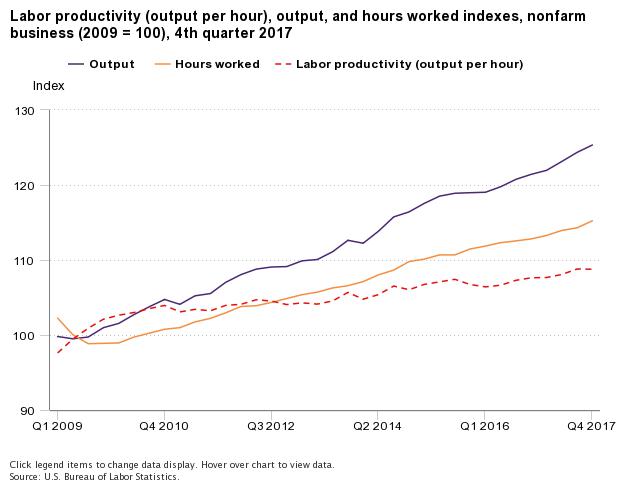
The latest data from the US Bureau of Labor signals more economic momentum, and supports the rate rise thesis.
From the fourth quarter of 2016 to the fourth quarter of 2017, nonfarm business sector labor productivity increased 1.1 percent, reflecting a 3.2-percent increase in output and a 2.1-percent increase in hours worked. Annual average productivity increased 1.2 percent from 2016 to 2017.
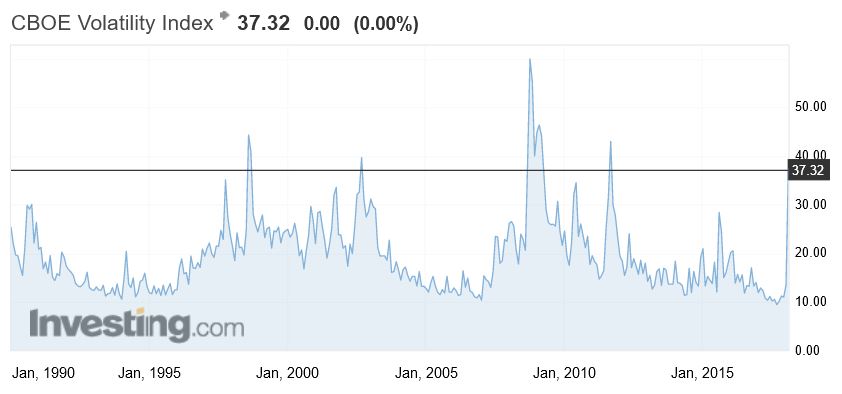
The volatility index (VIX) has roared back to life, having been asleep for months. This index gives an indication of market sentiment and is a popular measure of the stock market’s expectation of volatility implied by S&P 500 index options. This volatility is meant to be forward looking, is calculated from both calls and puts, and is a widely used measure of market risk, often referred to as the “investor fear gauge.”
On this basis, fear is stalking the halls, only 4 times since 1990 has the VIX index been higher.

 But the financials are being hit harder:
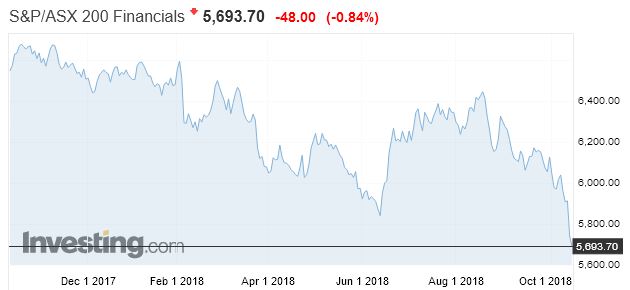 Still above the 5,466 level reached back in 2016.
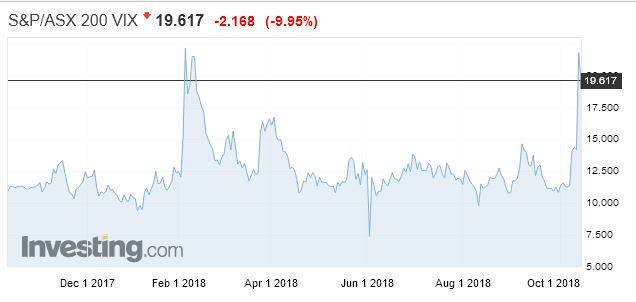
 From the fourth quarter of 2016 to the fourth quarter of 2017, nonfarm business sector labor productivity increased 1.1 percent, reflecting a 3.2-percent increase in output and a 2.1-percent increase in hours worked. Annual average productivity increased 1.2 percent from 2016 to 2017.