Household Spending Remains Key to U.S. Economic Growth

From The St. Louis Fed On The Economy Blog.

Household-related spending is driving the economy like never before, according to a recent Housing Market Perspectives analysis.

Since the U.S. economy began to recover in 2009, close to 83 percent of total growth has been fueled by household spending, said William R. Emmons, lead economist with the St. Louis Fed’s Center for Household Financial Stability.

“Hence, the continuation of the current expansion may depend largely on the strength of U.S. households,” noted Emmons.

An Examination of the Current Expansion

In July, the U.S. economic expansion entered its ninth year, and it should soon become the third-longest growth period since WWII, Emmons said. He noted that it would become the longest post-WWII recovery if it persists through the second quarter of 2020.

However, the current expansion has been weak and ranks ninth among the 10 post-WWII business cycles, as shown in the figure below.1 “Only the previous cycle, ending in the second quarter of 2009, was weaker,” he said. “That cycle was dominated by the housing boom and bust and culminated in the Great Recession.”

business cycles

The Changing Composition of Economic Growth

Emmons noted that the composition of economic growth also has changed in recent decades and has generally shifted in favor of housing and consumer spending,2 as shown in the figure below.

GDP Growth

“Only during the brief 1958-61 cycle did residential investment—which includes both the construction of new housing units and the renovation of existing units—contribute proportionally more to the economy’s growth than it has during the current cycle,” Emmons said.

He noted that, perhaps surprisingly, homebuilding subtracted significantly from economic growth during the previous cycle even though it included the housing bubble. “The crash in residential investment was so severe between the fourth quarter of 2005 and the second quarter of 2009 that it erased all of housing investment’s previous growth contributions,” he said.

He noted that residential investment typically subtracts from growth during recessions. Thus, its ultimate contribution to the current cycle likely will be less than currently shown because the next recession will be included as part of the current cycle.

At the same time, he said, personal consumption expenditures (i.e., consumer spending) also have been very important in recent cycles.

Emmons noted that consumer spending has contributed close to 75 percent of overall economic growth during the current cycle. The share was higher in only two other cycles. “Not surprisingly, strong residential investment and strong consumer spending tend to coincide when households are doing well,” he said.

Notes and References

1 The current business cycle began in the third quarter of 2009 and has not yet ended. The provisional “end date” used is the second quarter of 2017, which was the most recent quarter ended at the time this analysis was done.

2 The other components of gross domestic product (GDP) are business investment, exports and imports of goods and services, and government consumption expenditures and gross investment.

Digital Drives US Consumer Remote Payments Higher

US consumers are making more “remote” payments according to new payments data collected by the Federal Reserve. Remote general-purpose credit card payments, including online shopping and bill pay; all enabled by digital.

The number of credit card payments grew 10.2 percent in 2016 to 37.3 billion with a total value of $3.27 trillion. The increase in the number of payments compares with an 8.1 percent annual rate from 2012 to 2015 and was boosted by continued strong growth in the number of payments made remotely. Remote general-purpose credit card payments, including online shopping and bill pay, rose at a rate of 16.6 percent in 2016. More broadly, remote payments in 2016 represented 22.2 percent of all general-purpose credit and prepaid debit card payments, up 1.5 percentage points from an estimated 20.7 percent in 2015. By value, remote payments represented 44.0 percent of all general-purpose card payments, a slight increase from an estimated 42.9 percent in 2015.

The 2016 data on trends in card payments, as well as Automated Clearing House (ACH) transactions and checks, are the product of a new annual collection effort that will supplement the Federal Reserve’s triennial payments studies. Information released today compares the annual growth rates for noncash payments between 2015 and 2016 with estimates from previous studies.

Key findings include:

  • Total U.S. card payments reached 111.1 billion in 2016, reflecting 7.4 percent growth since 2015. The value of card payments grew by 5.8 percent and totaled $5.98 trillion in 2016. Growth rates by number and value were each down slightly from the rates recorded from 2012 to 2015.
  • Debit card payment growth slowed by number and value from 2015 to 2016 as compared with 2012 to 2015, growing 6.0 percent by number and 5.3 percent by value compared with a previous annual growth rate of 7.2 percent by number and 6.9 percent by value.
  • Use of computer microchips for in-person general-purpose card payments increased notably from 2015 to 2016, reflecting the coordinated effort to place the technology in cards and card-accepting terminals. By 2016, 19.1 percent of all in-person general-purpose card payments were made by chip (26.9 percent by value), compared with only 2.0 percent (3.4 percent by value) in 2015.
  • Data also reveal a shift in the value of payments fraud using general-purpose cards from predominantly in person, estimated at 53.8 percent in 2015, to predominantly remote, estimated at 58.5 percent in 2016. This shift can also be attributed, in part, to the reduction in counterfeit card fraud, the sort of fraud that cards and card-accepting terminals using computer chips instead of magnetic stripes help to prevent.
  • From 2012 to 2015, ACH network transfers, representing payments over the ACH network, grew at annual rates of 4.9 percent by number and 4.1 percent by value. Growth in both of these measures increased for the 2015 to 2016 period, rising to 5.3 percent by number and 5.1 percent by value. The average value of an ACH network transfer decreased slightly from $2,159 in 2015 to $2,156 in 2016.
  • Data from the largest depository institutions show the number of commercial checks paid, which excludes Treasury checks and postal money orders, declined 3.6 percent between 2015 and 2016. By value, commercial checks are estimated to have declined 3.7 percent during the same period. The steeper decline in value versus volume suggests the average value of a commercial check paid has declined slightly since 2015.

GOP tax plan doubles down on policies that are crushing the middle class

From The Conversation.

The U.S. middle class has always had a special mystique.

It is the heart of the American dream. A decent income and home, doing better than one’s parents, and retiring in comfort are all hallmarks of a middle-class lifestyle.

Contrary to what some may think, however, the U.S. has not always had a large middle class. Only after World War II was being middle class the national norm. Then, starting in the 1980s, it began to decline.

President Donald Trump has portrayed the tax plan Congress is wrapping up as a boon for the middle class. The sad reality, however, is that it is more likely to be its final death knell.

To understand why, you need look no further than the history of the rise and decline of the American middle class, a group that I’ve been studying through the lens of inequality for decades.

The middle class rises

The middle class, which Pew defines as two-thirds to two times the national median income for a given household size, began to grow after World War II due to a surge in economic growth and because President Franklin Delano Roosevelt’s New Deal gave workers more power. Before that, most Americans were poor or nearly so.

For example, legislation such as the Wagner Act established rights for workers, most critically for collective bargaining. The government also began new programs, such as Social Security and unemployment insurance, that helped older Americans avoid dying in poverty and supported families with children through tough times. The Home Owners’ Loan Corporation, set up in 1933, helped middle-class homeowners pay their mortgages and remain in their homes.

Together, these new policies helped fuel a strong postwar economic boom and ensured the gains were shared by a broad cross-section of society. This greatly expanded the U.S. middle class, which reached a peak of nearly 60 percent of the population in the late ‘70s. Americans’ increased optimism about their economic future prompted businesses to invest more, creating a virtuous cycle of growth.

Government spending programs were paid for largely with individual income tax rates of 70 percent (and more) on wealthy individuals and high taxes on corporate profits. Companies paid more than one-quarter of all federal government tax revenues in the 1950s (when the top corporate tax was 52 percent). Today they contribute just 5 percent of government tax revenues.

Despite high taxes on the rich and on corporations, median family income (after accounting for inflation) more than doubled in the three decades after World War II, rising from $27,255 in 1945 to nearly $60,000 in the late 1970s.

The fall begins

That’s when things started to change.

Rather than supporting workers – and balancing the interests of large corporations and the interests of average Americans – the federal government began taking the side of business over workers by lowering taxes on corporations and the rich, reducing regulations and allowing firms to grow through mergers and acquisitions.

Since the late 1980s, median household incomes (different from family incomes because members of a household live together but do not need to be related to each other) have increased very little – from $54,000 to $59,039 in 2016 – while inequality has risen sharply. As a result, the size of the middle class has shrunk significantly to 50 percent from nearly 60 percent.

One important reason for this is that starting in the 1980s the role of government changed. A key event in this process was when President Ronald Reagan fired striking air-traffic control workers. It marked the beginning of a war against unions.

The share of the labor force that is organized has fallen from 35 percent in the mid-1950s to 10.7 percent today, with the largest drop taking place in the 1980s. It is not a coincidence that the share of income going to earners in the middle fell at the same time.

In addition, Reagan cut taxes multiple times during his time in office, which led to less spending to support and sustain the poor and middle class, while deregulation allowed businesses to cut their wage costs at the expense of workers. This change is one reason workers have received only a small fraction of their greater productivity in the form of higher wages since the 1980s.

Meanwhile, the real buying power of the minimum wage has been allowed to erode since the 1980s due to inflation.

While the middle class got squeezed, the very rich have done very well. They have received nearly all income gains since the 1980s.

In contrast, household median income in 2016 was only slightly above its level just before the Great Repression began in 2008. But according to new unpublished research I conducted with Monmouth University economist Robert Scott, the actual living standard for the median household fell as much as 7 percent due to greater interest payments on past debt and the fact that households are larger, so the same income does not go as far.

As a result, the middle class is actually closer to 45 percent of U.S. households. This is in stark contrast to other developed countries such as France and Norway, where the middle class approaches nearly 70 percent of households and has held steady over several decades.

The Republican tax plan

So how will the tax plan change the picture?

France, Norway and other European countries have maintained policies, such as progressive taxes and generous government spending programs, that help the middle class. The Republican tax package doubles down on the policies that have caused its decline in the U.S.

Specifically, the plan will significantly reduce taxes on the wealthy and large companies, which will have to be paid for with large spending cuts in everything from children’s health and education to unemployment insurance and Social Security. Tax cuts will require the government to borrow more money, which will push up interest rates and require middle-income households to pay more in interest on their credit cards or to buy a car or home.

The benefits of the Republican tax bill go primarily to the very wealthy, who will get 83 percent of the gains by 2027, according to the Tax Policy Center, a nonpartisan think tank.

Meanwhile, more than half of poor and middle-income households will see their taxes rise over the next 10 years; the rest will receive only a small fraction of the total tax benefits.

Trump touts the GOP tax plan with a group of ‘middle-class families.’ Reuters/Kevin Lamarque

From virtuous to vicious

While Republicans justify their tax plan by claiming corporations will invest more and hire more workers, thereby raising wages, companies have already indicated that they will mainly use their savings to buy back stock and pay more dividends, benefiting the wealthy owners of corporate stock.

So with most of the gains of the $1.5 trillion in net tax cuts going to the rich, the end result, in my view, is that most Americans will face falling living standards as government spending goes down, borrowing costs go up, and their tax bill rises.

This will lead to less economic growth and a declining middle class. And unlike the virtuous circle the U.S. experienced in the ‘50s and ’60s, Americans can expect a vicious cycle of decline instead.

Author: Steven Pressman, Professor of Economics, Colorado State University

US Financial Stability In The Spotlight

The US Financial Stability Oversight Council has published their 2017 Annual Report. Their mandate under the Dodd-Frank Act is to identify risks to the financial stability of the US, promote market discipline and respond to emerging threats. At more than 150 pages, its is a long read, but well worth the effort. Also compare and contrast with the high household debt levels here!

A couple of things caught my attention. First, the rise in the 2-Year Treasury Bonds, as rate are normalized.   Rates are in their way up.

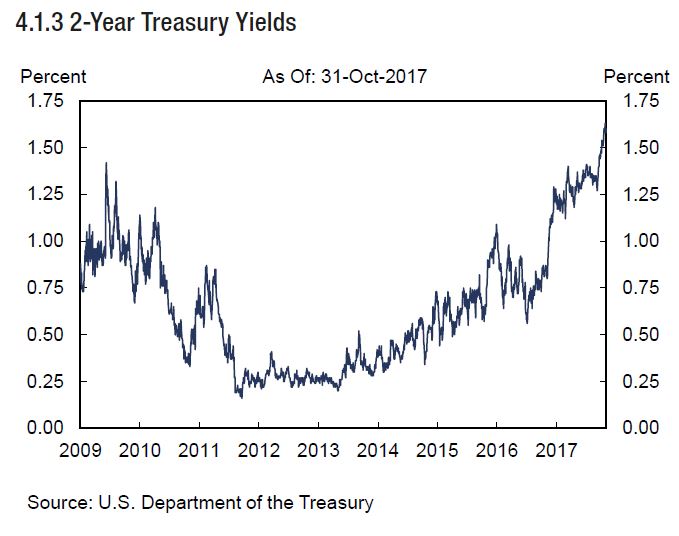
Yields on 2-year Treasury notes fell in the first half of 2016, reaching a low of 0.56 percent in July before reversing course (Chart 4.1.3). The 2-year Treasury yield has since risen 104 basis points to 1.60 percent, as of October 2017. The Federal Open Market Committee (FOMC) raised its target range for the federal funds rate 25 basis points four times since December 2016. Also, in October 2017, the Federal Reserve began normalizing its balance sheet.

Next, household debt to disposable income is around 100%, significantly lower than Australian households, and on a very different trajectory.

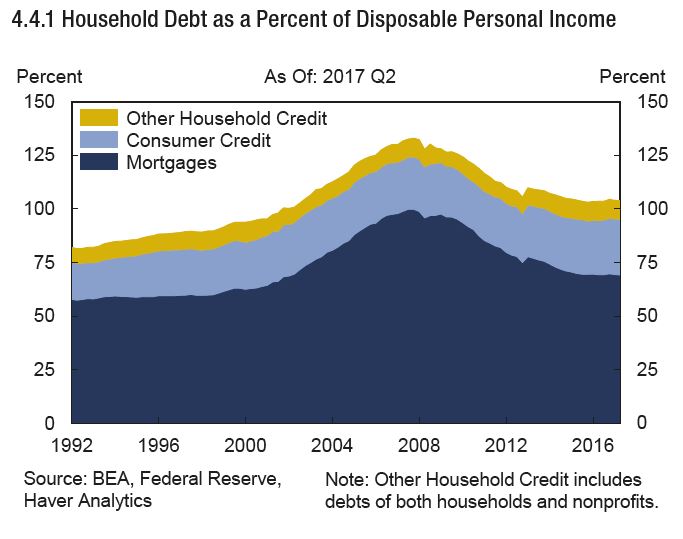
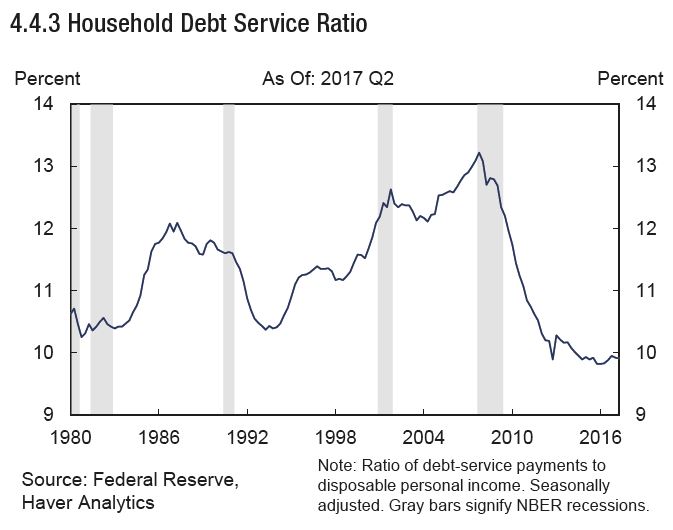
There has been significant growth in auto loans and student loans, compared with mortgage debt.  But the household debt service ratio is lower than here, a low interest rates helped keep the debt service ratio—the ratio of debt service payments to disposable personal income—unchanged in 2016 and the first half of 2017, near a 30-year low (Chart 4.4.3). Although the ratio of debtservice payments to disposable personal income for consumer credit has edged steadily upward since 2012, this trend has been fully offset by a decrease in the service ratio of mortgage debt.

Finally loan delinquency is lower now than back in 2009.

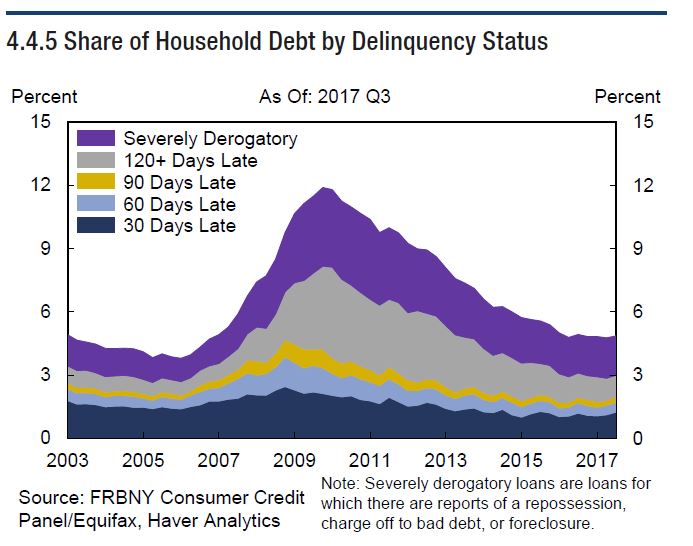
Continued decreases in delinquency rates on home equity lines of credit (HELOCs) and mortgage debt pushed household debt delinquencies to less than 5 percent, the lowest year-end level since 2006 (Chart 4.4.5).  Decreased overall delinquency among subprime borrowers, continued write-downs of mortgage debt accumulated during the pre-crisis housing bubble, and a shift from subprime to prime mortgage balances drove the decline. The delinquency rate on student loans remained unchanged at 11 percent over the past few years after nearly doubling between 2003 and 2013. Despite elevated delinquency rates on student loans, default risk is generally limited for private lenders, since the federal government owns or guarantees most student loan debt outstanding. Signs of stress have emerged in auto lending in recent years, driven by increased subprime borrower delinquency. In the second quarter of 2017, auto loan balances that were delinquent for at least 90 days reached 3.9 percent of total auto loan balances, up from 3.3 percent three years prior. In recent quarters, credit card delinquency rates have increased slightly, and the percent of credit card loans that were delinquent for at least 90 days increased to 4.4 percent, compared to 3.7 percent three years prior. Despite this trend, the balance of credit card debt that was delinquent for at least 90 days has remained relatively stable at 7.4 percent in the second quarter of 2017, compared to 7.8 percent three years prior.

They discussed some highly relevant issues:

Managing Vulnerabilities in an Environment of Low, but Rising, Interest Rates – In previous annual reports, the Council identified vulnerabilities that arise from a prolonged period of low interest rates. In particular, as investors search for higher yields, some may add assets with higher credit or market risks to their portfolios. They may also use more leverage or rely on shorter-term funding. These actions tend to raise the overall level of financial risk in the economy and may put upward pressure on prices in certain markets. If prices in those markets were to fall sharply, owners could face unexpectedly large declines in their overall portfolio value, potentially creating conditions of financial instability. Although both short-term and long-term interest rates have risen since the last annual report, the consequences of past risk-taking may persist for some time. While the rise in short-term rates has benefitted net interest margins (NIMs) and net interest income at depository institutions and broker-dealers, a flatter yield curve and expectations for higher funding costs going forward may increasingly lower the earnings benefits from higher interest rates. In addition, the transition to higher rates may expose vulnerabilities among some market participants through a reduction in the value of their assets or an uncertain rise in costs of funding for depository institutions. These vulnerabilities can be mitigated by supervisors, regulators, and financial
institutions closely monitoring increased risk-taking incentives and risks that might arise from rising rates.

Housing Finance Reform – The government-sponsored enterprises (GSEs) are now into their tenth year of conservatorship. While regulators and supervisors have taken great strides to work within the constraints of conservatorship to promote greater investment of private capital and improve operational efficiency with lower costs, federal and state regulators are approaching the limits of their ability to enact wholesale reforms that are likely to foster a vibrant, resilient housing finance system. Housing finance reform legislation is needed to create a more sustainable system that enhances financial stability.

They called out a number of areas for focus where technology intersects finance:

Cybersecurity – As the financial system relies more heavily on technology, the risk that significant cybersecurity incidents targeting this technology can prevent the financial sector from delivering services and impact U.S. financial stability increases. Through collaboration and partnership, substantial gains have been made by both government and industry in response to cybersecurity risks, in part by refining their shared understanding of potential vulnerabilities within the financial sector. It is important that this work continue and include greater emphasis on understanding and mitigating the risk that significant cybersecurity incidents have business and systemic implications.

Financial Innovation – New financial market participants and new financial products can offer substantial benefits to consumers and businesses by meeting emerging needs or reducing costs. But these new participants and products may also create unanticipated risks and vulnerabilities. Financial regulators should continue to monitor and analyze the effects of new financial products and services on consumers, regulated entities, and financial markets, and evaluate their potential effects on financial stability.

And finally, a range of other material structural issues:

Central Counterparties – Central counterparties (CCPs) have the potential to provide considerable benefits to financial stability by enhancing market functioning, reducing counterparty risk, and increasing transparency. These benefits require that CCPs be highly robust and resilient. Regulators should continue to coordinate in the supervision of all CCPs that are designated as systemically important financial market utilities (FMUs). Member agencies should continue to evaluate whether existing rules and standards for CCPs and their clearing members are sufficiently robust to mitigate potential threats to financial stability. Agencies should also continue working with international standard-setting bodies to identify and address areas of common concern as additional derivatives clearing requirements are implemented in other jurisdictions. Evaluation of the performance of CCPs under stress scenarios can be a very useful tool for assessing the robustness and resilience of such institutions and identifying potential operational areas for improvement. Supervisory agencies should continue to conduct these exercises. Regulators should also continue to monitor and assess interconnections among CCPs, their clearing members, and other financial institutions; consider additional improvements in
public disclosure; and develop resolution plans for systemically important CCPs.

Short-Term Wholesale Funding – While some progress has been made in the reduction of counterparty risk exposures in repurchase agreement (repo) markets in recent years, the potential for fire sales of collateral by creditors of a defaulted broker-dealer remains a vulnerability. The SEC should monitor and assess the effectiveness of the MMF rules implemented last year. Regulators should also monitor the potential migration of activity to other cash management vehicles and the impact of money market developments on other financial markets and institutions.

Reliance on Reference Rates – Over the past few years, regulators, benchmark administrators, and market participants have worked toward improving the resilience of the London Interbank Offered Rate (LIBOR) by subjecting the rate and its administrator to more direct oversight, eliminating little-used currency and tenor pairings, and embargoing the submissions of individual banks to the panel for a three-month period. However, decreases in the volume of unsecured wholesale lending has made it more difficult to firmly ground LIBOR submissions in a sufficient number of observable transactions, creating the risk that publishing the benchmark may not be sustainable. Regulators and market participants have been collaborating to develop alternatives to LIBOR. They are encouraged to complete such work and to take appropriate steps to mitigate disruptions associated with the transition to a new reference rate.

Data Quality, Collection, and Sharing – The financial crisis revealed gaps in the data needed for effective oversight of the financial system and internal firm risk management and reporting capabilities. Although progress has been made in filling these gaps, much work remains. In addition, some market participants continue to use legacy processes that rely on data that are not aligned to definitions from relevant consensus-based standards and do not allow for adequate conformance and validation to structures needed for data sharing. Regulators and market participants should continue to work together to improve the coverage, quality, and accessibility of financial data, as well as data sharing between and among relevant agencies.

Changes in Financial Market Structure and Implications for Financial Stability – Changes in market structure, such as the increased use of automated trading systems, the ability to quote and execute transactions at higher speeds, the increased diversity in the types of liquidity providers in such markets, and the expansion in trading venues all have the potential to increase the efficiency and improve the functioning of financial markets. But such changes and complexities also have the potential to create unanticipated risks that may disrupt financial stability. It is therefore important that market participants and regulators continue to try to identify gaps in our understanding of market structure and fill those gaps through the collection of data and subsequent analysis. In addition, evaluation of the appropriate use or expansion of coordinated tools such as trading halts across interdependent markets, particularly in periods of market stress, will further the goal of enhancing financial stability, as will collaborative work by member agencies to analyze developments in market liquidity.

Is Record High Consumer Debt a Boon or Bane?

From The St.Louis Fed on The Economy Blog.

Amidst of lot of captivating headlines over the last few months, one may have missed the news that consumer debt has hit an all-time high of 26 percent of disposable income, as seen in the chart below.

In just the past five years, consumer debt (all household debts, excluding mortgages and home equity loans) has grown at about twice the pace of household income. This has largely been driven by strong growth in both auto and student lending.

But what does this say about the economy? Is it a sign of optimism or a cause for concern?

Increasing Debt Levels

Rising household debt levels could mean that:

  • More Americans are optimistic about the U.S. economy.
  • More people are making investments in assets that generally build wealth, like higher education and homes.
  • Consumers have paid off their loans to qualify for new ones.

At the same time, higher debt levels could reveal financial stress as families use debt to finance consumption of necessities. It could portend new waves of delinquencies and, eventually, defaults that displace these kinds of investments. And rising family debts could slow economic growth and, of course, even lead to a recession.

Three Key Themes

This dual nature of household debt is precisely why the Center for Household Financial Stability organized our second Tipping Points research symposium on household debts. We did so this past June in New York, in partnership with the Private Debt Project

We recently released the symposium papers, which were authored by my colleagues William R. Emmons and Lowell R. Ricketts and several leading economists, such as Karen Dynan and Atif Mian. They offer fascinating insights about how, when and the extent to which household debt impacts economic growth.

Looking at all the papers and symposium discussions together, a few key themes emerged.

No. 1: Short-Term vs. Long-Term Debt

Despite an incomplete understanding of the drivers and mechanism of household debt, we learned that increases in household debts can boost consumption and GDP growth in the shorter term (within a year or two) but suppress them beyond that.

Whether and how household debt affects economic growth over the longer term depends on three things:

  • Whether family debts improve labor productivity or boost local demand for goods and services
  • The extent of leverage concurrently in the banking sector, which is much less evident today than a decade ago
  • The stability of the assets, such as housing, being purchased with those debts

No. 2: Magnitude of Risk

Even with record-high levels of consumer debts, most symposium participants did not see household debts posing a systemic risk to the economy at the moment, though trends in student borrowing, auto loans and (perhaps) credit card debts are troubling to those borrowers and in those sectors.

Moreover, rising debt can be a drag on economic growth even if not a systemic risk, and longer-term reliance on debt to sustain consumption remains highly concerning as well.

No. 3: Public Policy

Public policy responses should also be considered. Factors that could further burden indebted families and impede economic growth include:

  • Low productivity growth
  • Higher interest rates
  • New banking and financial sector regulations
  • Rising higher-education costs

Indeed, levels of household debt have often served as a reflection of larger, structural, technological, demographic and policy forces that help or harm consumers. It only makes sense, then, that policy and institutional measures must be considered to ameliorate debt levels and their impact on families and the economy.

After all, what’s good for families is good for the economy, and vice versa.

The FCC just killed net neutrality

From The Verge.

US Net neutrality is dead — at least for now. In a 3-2 vote today, the Federal Communications Commission approved a measure to remove the tough net neutrality rules it put in place just two years ago. Those rules prevented internet providers from blocking and throttling traffic and offering paid fast lanes. They also classified internet providers as Title II common carriers in order to give the measure strong legal backing.

Today’s vote undoes all of that. It removes the Title II designation, preventing the FCC from putting tough net neutrality rules in place even if it wanted to. And, it turns out, the Republicans now in charge of the FCC really don’t want to. The new rules largely don’t prevent internet providers from doing anything. They can block, throttle, and prioritize content if they wish to. The only real rule is that they have to publicly state that they’re going to do it.

Advocates say internet providers will prioritize their own content over their competitors

Opponents of net neutrality argue that the rules were never needed in the first place, because the internet has been doing just fine. “The internet wasn’t broken in 2015. We were not living in some digital dystopia,” commission chairman Ajit Pai said today. “The main problem consumers have with the internet is not and has never been that their internet provider is blocking access to content. It’s been that they don’t have access at all.”

While that may broadly be true, it’s false to say that all of the harms these rules were preventing are imagined: even with the rules in place, we saw companies block their customers from accessing competing apps, and we saw companies implement policies that clearly advantage some internet services over others. Without any rules in place, they’ll have free rein to do that to an even greater extent.

Read the dissenting statements of the Democratic FCC commissioners

Supporters of net neutrality have long argued that, without these rules, internet providers will be able to control traffic in all kinds of anti-competitive ways. Many internet providers now own content companies (see Comcast and NBCUniversal), and they may seek to advantage their own content in order to get more eyes on it, ultimately making it more valuable. Meanwhile, existing behaviors like zero-rating (where certain services don’t count toward your data cap) already encourage usage of some programs over others. If during the early days of Netflix, you were free to stream your phone carrier’s movie service instead, we might not have the transformational TV and movie company it’s turned into today.

One of the two Democrats on the commission, Jessica Rosenworcel, called today’s vote a “rash decision” that puts the FCC “on the wrong side of history, the wrong side of the law, and the wrong side of the American public.” This vote, Rosenworcel says, gives internet providers the “green light to go ahead” and “discriminate and manipulate your internet traffic,” something she says they have a business incentive to do.

When Holding Cash Beats Paying Debt

From The US On The Economy Blog.

For families who are struggling financially, there are times when it is better to keep some cash on hand, even if they hold high-interest debt.

A recent In the Balance article highlights the importance of emergency savings to the financial stability of struggling households. It was authored by Emily Gallagher, a visiting scholar at the St. Louis Fed’s Center for Household Financial Stability, and Jorge Sabat, a research fellow at the Center for Social Development at Washington University in St. Louis.

The Struggle to Make Ends Meet

Many families continue to struggle to make ends meet, the authors said, noting a recent Federal Reserve survey that estimated that almost half of U.S. households could not easily handle an emergency expense of just $400.

Given this, they asked: “Should more families be encouraged to hold a liquidity buffer even if it means incurring more debt in the short-term?”

In explaining why it might make sense, for example, to keep $1,000 in a low-earning bank account while owing $2,000 on a high-interest-rate credit card, Gallagher and Sabat’s research suggests this type of cash buffer greatly reduces the risk that a family will:

  • Miss a rent, mortgage or recurring bill payment
  • Be unable to afford enough food to eat
  • Be forced to skip needed medical care within the next six months

Linking Balance Sheets and Financial Hardship

Gallagher and Sabat investigated which types of assets and liabilities predicted whether a household would experience financial hardship over a six-month period.

Their survey encompassed detailed financial and demographic results that covered two time-period observations for the same household: one at tax time, and the other six months after tax time.

“This feature of our data set is ideal for capturing the probability that a household that is currently financially stable falls into financial hardship in the near term,” the authors explained. “Furthermore, the survey samples only from low-to-middle income households, our population of interest for understanding the antecedents of financial hardship.”

They tracked families in the first survey who said they hadn’t recently experienced any of these four main types of financial hardship:

  • Delinquency on rent or mortgage payments
  • Delinquency on regular bills, such as utility bills
  • Skipped medical care
  • Food hardship (going without needed food)

Gallagher and Sabat also asked if the family had any balances in:

  • Liquid assets, such as checking and saving accounts, money market funds and prepaid cards
  • Other assets, including businesses, real estate, retirement or education savings accounts
  • High-interest debt, such as that from credit cards or payday loans
  • Other unsecured debt, such as student loans, unpaid bills and overdrafts
  • Secured debt, including mortgages or debts secured by businesses, farms or vehicles

Controlling for factors such as income and demographics, they then tracked whether the 5,000 families in the survey had suffered a financial shock that would affect the results.

Cash on Hand Matters Most

The authors found that having liquid assets or other assets always predicted lower risk of encountering hardship of any kind, while having debts generally increased the risk of hardship.

Liquid assets had the most predictive power, Gallagher and Sabat said. They noted that a $100 increase (from a mean of $6) was associated with a 4.6 percentage point reduction in a household’s probability of rent or mortgage delinquency.

Liquid assets also significantly reduced the likelihood of entering into more common forms of hardship. A $100 increase in liquidity was associated with declines in the rates of:

  • Regular bill delinquency (by 8.3 percentage points)
  • Skipped medical care (by 6.3 percentage points)
  • Food hardship (by 5.2 percent percentage points)

“These estimated effects are substantial relative to the probability of encountering each hardship,” they said.

Conclusion

“Our findings suggest that households should be encouraged to maintain at least a small buffer of liquid savings, even if the cash in that buffer is not being used to pay down high-interest debt,” Gallagher and Sabat concluded.

FED Lifts Rate As Expected

The FED has lifted the federal funds rate to 1.5% after their two day meeting – the third hike this year. The move was expected and had been well signalled.  This despite inflation still running below target, though they expect it will move to 2% later.  More rate rises are expected  in 2018.  This will tend to propagate through to other markets later.

Information received since the Federal Open Market Committee met in November indicates that the labor market has continued to strengthen and that economic activity has been rising at a solid rate. Averaging through hurricane-related fluctuations, job gains have been solid, and the unemployment rate declined further. Household spending has been expanding at a moderate rate, and growth in business fixed investment has picked up in recent quarters. On a 12-month basis, both overall inflation and inflation for items other than food and energy have declined this year and are running below 2 percent. Market-based measures of inflation compensation remain low; survey-based measures of longer-term inflation expectations are little changed, on balance.

Consistent with its statutory mandate, the Committee seeks to foster maximum employment and price stability. Hurricane-related disruptions and rebuilding have affected economic activity, employment, and inflation in recent months but have not materially altered the outlook for the national economy. Consequently, the Committee continues to expect that, with gradual adjustments in the stance of monetary policy, economic activity will expand at a moderate pace and labor market conditions will remain strong. Inflation on a 12‑month basis is expected to remain somewhat below 2 percent in the near term but to stabilize around the Committee’s 2 percent objective over the medium term. Near-term risks to the economic outlook appear roughly balanced, but the Committee is monitoring inflation developments closely.

In view of realized and expected labor market conditions and inflation, the Committee decided to raise the target range for the federal funds rate to 1-1/4 to 1‑1/2 percent. The stance of monetary policy remains accommodative, thereby supporting strong labor market conditions and a sustained return to 2 percent inflation.

In determining the timing and size of future adjustments to the target range for the federal funds rate, the Committee will assess realized and expected economic conditions relative to its objectives of maximum employment and 2 percent inflation. This assessment will take into account a wide range of information, including measures of labor market conditions, indicators of inflation pressures and inflation expectations, and readings on financial and international developments. The Committee will carefully monitor actual and expected inflation developments relative to its symmetric inflation goal. The Committee expects that economic conditions will evolve in a manner that will warrant gradual increases in the federal funds rate; the federal funds rate is likely to remain, for some time, below levels that are expected to prevail in the longer run. However, the actual path of the federal funds rate will depend on the economic outlook as informed by incoming data.

Voting for the FOMC monetary policy action were Janet L. Yellen, Chair; William C. Dudley, Vice Chairman; Lael Brainard; Patrick Harker; Robert S. Kaplan; Jerome H. Powell; and Randal K. Quarles. Voting against the action were Charles L. Evans and Neel Kashkari, who preferred at this meeting to maintain the existing target range for the federal funds rate.

Fed Keeps Countercyclical Capital Buffer at 0 percent

The Federal Reserve Board announced on Friday it has voted to affirm the Countercyclical Capital Buffer (CCyB) at the current level of 0 percent. In making this determination, the Board followed the framework detailed in the Board’s policy statement for setting the CCyB for private-sector credit exposures located in the United States.

The buffer is a macroprudential tool that can be used to increase the resilience of the financial system by raising capital requirements on internationally active banking organizations when there is an elevated risk of above-normal future losses and when the banking organizations for which capital requirements would be raised by the buffer are exposed to or are contributing to this elevated risk–either directly or indirectly. The CCyB would then be available to help banking organizations absorb higher losses associated with declining credit conditions. Implementation of the buffer could also help moderate fluctuations in the supply of credit.

The Board consulted with the Federal Deposit Insurance Corporation and the Office of the Comptroller of the Currency in making this determination. Should the Board decide to modify the CCyB amount in the future, banking organizations would have 12 months before the increase became effective, unless the Board establishes an earlier effective date.

Digital Lending; On The Up

S&P Global just published their 2017 U.S. Digital Lending Landscape report.

They estimate that 15 of the most prominent U.S. digital lenders grew originations at a compound annual growth rate of 129.4% during the five-year period ended Dec. 31, 2016. Going forward, they project slower growth for the industry as lenders focus on building sustainable businesses
with higher quality borrowers.

They predicts that these lenders will originate $62.84 billion in new loans during 2021, up from $29.31 billion in 2016. This represents a CAGR of 16.5% for the five-year period ending Dec. 31, 2021.

Personal-focused lending is projected to grow at a CAGR of 12.4% to $24.31 billion by 2021. The small and medium enterprise and student-focused lending segments are projected to grow faster, with respective CAGRs of 21.5% and 18.4%.

Regulation remains unclear for the industry, but signs of progress have emerged during the past year. Regulators have started to take a closer look at digital lending in an attempt to create a fair and clear regulatory framework.

Venture activity picked back up during the first three quarters of
2017, with $832.5 million raised by the lenders in our analysis.
Student-focused lender Earnest was acquired by student loan
servicer Navient for $155 million in November.

Interest rates and loan sizes have remained relatively unchanged over the past year as lenders focus more on adjusting the rates and loan sizes associated with specific credit grades.

As regulators take a harder look at digital lending, corporate
governance and management teams must ensure that their
companies are beyond reproach. 2017 was the second consecutive year in which a high-profile CEO has been forced to
leave their company.