Fed Lifts Smaller Mortgage Loan Threshold

The Consumer Financial Protection Bureau (CFPB), Board of Governors of the Federal Reserve System, and Office of the Comptroller of the Currency (OCC) today announced that the threshold for exempting loans from special appraisal requirements for higher-priced mortgage loans during 2018 will increase from $25,500 to $26,000.

The threshold amount will be effective January 1, 2018, and is based on the annual percentage increase in the Consumer Price Index for Urban Wage Earners and Clerical Workers (CPI-W) as of June 1, 2017.

The Dodd-Frank Wall Street Reform and Consumer Protection Act of 2010 amended the Truth in Lending Act to add special appraisal requirements for higher-priced mortgage loans, including a requirement that creditors obtain a written appraisal based on a physical visit to the home’s interior before making a higher-priced mortgage loan.

The rules implementing these requirements contain an exemption for loans of $25,000 or less and also provide that the exemption threshold will be adjusted annually to reflect increases in the CPI-W. If there is no annual percentage increase in the CPI-W, the agencies will not adjust this exemption threshold from the prior year. However, in years following a year in which the exemption threshold was not adjusted, the threshold is calculated by applying the annual percentage change in CPI-W to the dollar amount that would have resulted, after rounding, if the decreases and any subsequent increases in the CPI-W had been taken into account.

Is Peer To Peer Lending Mirroring Sub-Prime?

An interesting paper from the Federal Reserve Bank of Cleveland “Three Myths about Peer-to-Peer Loans” suggests these platforms, which have experienced phenomenal growth in the past decade, resemble predatory loans in terms of the segment of the consumer market they serve and their impact on consumers’ finances and have a negative effect on individual borrowers’ financial stability.

This is of course what triggered the 2007 financial crisis. There is no specific regulation in the US on the borrower side.  Given that P2P lenders are not regulated or supervised for antipredatory laws, lawmakers and regulators may need to revisit their position on online lending marketplaces.

While P2P lending hasn’t changed much from the borrowers’ perspective since 2006, the composition and operational characteristics of investors have changed considerably. Initially, the P2P market was conceived of as individual investors lending to individual borrowers (hence the name, “peer-to-peer”). Yet even from the industry’s earliest days, P2P borrowers attracted institutional investors, including hedge funds, banks, insurance companies, and asset managers. Institutions are now the single largest type of P2P investor, and the institutional demand is almost solely responsible for the dramatic, at times triple-digit, growth of P2P loan originations (figure 2).

The shift toward institutional investors was welcomed by those concerned with the stability of the financial sector. In their view, the P2P marketplace could increase consumers’ access to credit, a prerequisite to economic recovery, by filling a market niche that traditional banks were unable or unwilling to serve. The P2P marketplace’s contribution to financial stability and economic growth came from the fact that P2P lenders use pools of private capital rather than federally insured bank deposits.

Regulations in the P2P industry are concentrated on investors. The Securities and Exchange Commission (SEC) is charged with ensuring that investors, specifically unaccredited retail investors, are able to understand and absorb the risks associated with P2P loans.

On the borrower side, there is no specific regulatory body dedicated to overseeing P2P marketplace lending practices. Arguably, many of the major consumer protection laws, such as the Truth-in-Lending Act or the Equal Credit Opportunity Act, still apply to both P2P lenders and investors. Enforcement is delegated to local attorney general offices and is triggered by repeat violations, leaving P2P borrowers potentially vulnerable to predatory lending practices.

Signs of problems in the P2P market are appearing. Defaults on P2P loans have been increasing at an alarming rate, resembling pre-2007-crisis increases in subprime mortgage defaults, where loans of each vintage perform worse than those of prior origination years (figure 1). Such a signal calls for a close examination of P2P lending practices. We exploit a comprehensive set of credit bureau data to examine P2P borrowers, their credit behavior, and their credit scores. We find that, on average, borrowers do not use P2P loans to refinance pre-existing loans, credit scores actually go down for years after P2P borrowing, and P2P loans do not go to the markets underserved by the traditional banking system.1 Overall, P2P loans resemble predatory loans in terms of the segment of the consumer market they serve and their impact on consumers’ finances. Given that P2P lenders are not regulated or supervised for antipredatory laws, lawmakers and regulators may need to revisit their position on online lending marketplaces.


US Tax Plan Will Be Revenue Negative, Result in Higher Deficits

United States: Outlook for Public Finances Worsens says Fitch Ratings who expects a version of the tax cuts presented in the Tax Cuts and Jobs Act to pass the US Congress.

Such reform would deliver a modest and temporary spur to growth, already reflected in growth forecasts of 2.5% for 2018. However, it will lead to wider fiscal deficits and add significantly to US government debt. As such, Fitch has revised up its medium-term debt forecast.

US federal debt was 77% of GDP for this fiscal year. Fitch believes the tax package will be revenue negative, even under generous assumptions about its growth impact. Under a realistic scenario of tax cuts and macro conditions, the federal deficit will reach 4% of GDP by next year, and the US debt/GDP ratio would rise to 120% of GDP by 2027.

The Republican tax plan delivers a tax cut on corporations, seeking to lower the corporate tax rate to 20% from 35%, and removing many exemptions, while eliminating some tax breaks affecting corporate and personal filers. It would leave the overall personal tax burden somewhat lower, although the effects would differ depending on circumstances.

Tax cuts may lead to a short-lived boost to output, but Fitch believes that they will not pay for themselves or lead to a permanently higher growth rate. The cost of capital is already low and corporate profits are elevated. In addition, the effective tax rate paid by large corporations is well below the existing statutory rate. From a macroeconomic perspective, adding to demand at this point in the economic cycle could add to inflationary pressures and lead to additional monetary policy tightening.

Fitch expects US economic growth to peak at 2.5% in 2018 before falling back to 2.2% in 2019. The US will enter the next downturn with a general government “structural deficit” (subtracting the impact of the economic cycle) larger than any other ‘AAA’ sovereign, leaving the US more exposed to a downturn than other similarly rated sovereigns.

The US is the most indebted ‘AAA’ country and it is running the loosest fiscal stance. Long-term debt dynamics are also more negative than those of peers, with health and social security spending commitments set to rise over the next decade. In Fitch’s view, these weaknesses are outweighed by financing flexibility and the US dollar’s reserve currency status, underpinning its ‘AAA’/Stable rating. The main short-term risk to the rating would be a failure to raise the debt ceiling by 1Q18, when the Treasury’s scope for extraordinary measures is expected to be exhausted. The debt ceiling is currently suspended until early December.

US Corporate Tax Reform: Implications for the Rest of the World

The Treasure has released a paper “US Corporate Tax Reform: Implications for the rest of the world” which examines the likely impacts of the US reforms on the US and on the rest of the world, placing the US changes in the context of the global trend toward lower corporate taxes.

The paper says that the economic impact of the Republicans’ tax plan will depend on how time and compromise shape the package that is ultimately legislated. Key in this regard is the size of the cut, how it is funded and whether investors believe it is a permanent reduction.

On 27 September 2017, the United States (US) Administration and Republican Congressional leadership released a framework for US tax reform, including a reduction in the federal corporate tax rate from 35 to 20 per cent.

The key elements of tax framework with respect to corporate tax are:

  • a reduction in the federal corporate income tax rate from 35 to 20 per cent;
  • immediate expensing of depreciable assets (except structures) for at least 5 years;
  • limitations on interest deductions;
  • the removal of the domestic production deduction;
  • an exemption for dividends paid by foreign subsidies to US companies (where the US company owns 10 per cent or more of the foreign company); and
  • a one-time tax on overseas profits.

These proposals were reflected in the draft of the Tax Cuts and Jobs Act released by the House Ways and Means Committee on 2 November 2017.

This paper examines the likely impact of this reform on the US and rest of the world, placing the US changes in the context of the global trend toward lower corporate taxes.

In theory, a corporate tax rate cut stimulates investment by making more investment opportunities sufficiently profitable to attract financing. The extent to which this is the case in practice will depend on how the tax cut is funded and whether investors consider the tax cut to be permanent. If the corporate tax rate cut results in an overall reduction in tax on US investments and investors believe that the tax cut is permanent, we are likely to see an increase in the level of US investment. If investors believe that the tax cut is temporary, the effect on US investment may be minimal. Ultimately, the economic impact of the plan on the US will depend on how time and compromise shape the final package.

If a US corporate tax cut does result in an investment boom, goods, labour and funds will be required. In a scenario in which the investment boom is largely funded domestically from US savings, negative impacts on the rest of the world are likely to be short-lived and modest.

Realistically, however, a US investment boom is likely to be only partially funded domestically and would draw funds and goods from the rest of the world. In this scenario, the rest of the world would experience a decline in capital stock resulting from the flow of capital into the US. The magnitude of the resulting welfare loss in those countries will depend on the size of the US corporate tax cut; how it is funded; the elasticity of the US labour supply response and the US saving response. For Australia, the size of the negative impact will also depend on how other countries respond.

While the size of the US economy means changes to the US tax system have particular significance, it is important to consider these reforms as part of an ongoing trend. As capital markets have become increasingly global and business location increasingly mobile, governments have sought to drive economic growth in their jurisdictions by lowering corporate tax rates. The US reforms have the potential to accelerate tax competition between jurisdictions, making Australia’s current corporate tax rate increasingly uncompetitive internationally.

While the Administration and Republican Congressional leadership have indicated that they will ‘set aside’ the idea contained in the House Republicans’ 2016 plan to move to a destination-based cash flow tax (DBCFT), this paper also provides a discussion of the theoretical underpinnings of the proposal.

How Has the Economy Performed around Fed Chair Transitions?

From The On The Economy Blog.

Jerome Powell has been nominated to be the next chair of the Federal Reserve Board. Historically, what has happened to economic growth following a transition?

Average Growth Sometimes Slows in the Short Term

Whether a transition to a new Fed chair affects economic growth in the short term is not apparent at first glance, as can be seen in the figure below.

GDP per Fed Chair

Notable growth slowdowns occurred immediately after Chairs William McChesney Martin, Paul Volcker and Ben Bernanke took office. However, growth was stronger in the year after the terms began of Chairs Arthur Burns, G. William Miller, Alan Greenspan and Janet Yellen.

Taking the average of all seven Fed transitions since World War II, the economy grew about 0.6 percentage points more slowly in the year after a new Fed chair took office than during the year preceding the transition, as seen below.

GDP periods new Fed chair

Clearly, this is due to the very large slowdowns that occurred after Martin, Volcker and Bernanke took office. It was more common for growth to increase in the year after a transition than to decrease, but the magnitudes were smaller.

Average Growth More Often Slows over the Medium Term

In the two years following a Fed chair transition, average growth was about 0.7 percentage points less than during the two years prior to the transition, as seen in the figure above. Growth slowdowns in three-year and four-year before-and-after comparisons were somewhat larger, at 1.5 and 1.3 percentage points, respectively.

While only three of the seven transitions resulted in growth slowdowns at the two-year horizon, five of the seven transitions resulted in slower growth in both the three-year and four-year periods. In addition to transitions to Martin, Volcker and Bernanke, who experienced growth slowdowns at every horizon considered here, transitions to Miller and Greenspan also were followed with slower three- and four-year growth than had occurred prior to their terms.

Growth Slowdowns Are a Feature of the Recent Period, Too

It’s possible that early post-WWII Fed chairs faced unusual circumstances that aren’t relevant anymore:

  • Martin helped establish Fed independence from the Treasury after WWII and faced the disruption of the Korean War.
  • Burns served during the Vietnam War and, according to some observers, faced unusual political pressures.
  • Miller served the briefest term of all post-WWII chairs.

It turns out that the average growth slowdown around a Fed chair transition has been larger in recent decades (beginning in 1979) than it was before at each of the horizons considered here. The figure below shows the before-and-after growth averages for one-, two-, three- and four-year horizons for only the four most recent Fed chairs.1

GDP latest fed chairs

Remarkably, the average growth slowdown is nearly two full percentage points at both the three- and four-year horizons. As before, the large declines experienced after the Volcker and Bernanke transitions play the largest roles, but average growth also slowed in the three- and four-year periods after Greenspan took office.

Why Would a Transition Lead to Slower Growth?

The historical pattern shown here might be merely a coincidence. Another possibility is that it might reflect heightened uncertainty in financial markets and the economy as Fed leadership changes. It also might be the result of incoming Fed chairs pursuing monetary policy somewhat differently than their immediate predecessors.

Would a New Fed Chair Face a Growth Slowdown?

The number of Fed chair transitions since WWII is small, so it’s difficult to generalize about what might happen next. Nonetheless, the pattern of slower growth on average after a new Fed chair takes office is striking—especially at the three- and four-year horizons.

Notes and References

1 Janet Yellen has not been the Fed chair long enough for four full years of data, so her four-year data covers 3.5 years.

The US economy is outpacing Australia’s

From The Conversation.

Data this week pointed to a continued shakiness in the Australian economy, while the robust US recovery continued.

In Australia, private-sector lending grew at just 0.3%, compared to 0.5% in August. Perhaps more worryingly, business lending dropped 0.1%. It was, again, housing credit growth that propped up the overall figures, growing 0.5% for the month.

Worse still, new home sales fell 6.1% in September, compared to August, according to the Housing Industry Association. So Australians aren’t borrowing much, except to finance the swapping around of each other’s houses at higher and higher prices. Note to picky readers: yes, prices fell a tiny bit in Sydney last month (0.1%), but are still up 10.5% year-on-year.

The US labour market bounced back from the hurricane season, adding 235,000 private sector jobs, according to data from payroll provider ADP. This wasn’t merely a bounce back — it exceeded expectations of a 200,000 gain. This was the biggest gain since March and further evidence of the strong US recovery.

It was not surprising, then, that Conference Board figures showed strong consumer confidence. What was striking, however, was just how strong those figures were. The confidence index rose to 5.3 points to 125.9 – the highest since December 2000. The present conditions measure was also at its highest level since 2001.

The US Federal Reserve kept interest rates on hold at a band of 1.0-1.25% at this week’s meeting, but signalled a fairly high likelihood of a rate rise when they meet in December. As the statement put it:

The Committee expects that economic conditions will evolve in a manner that will warrant gradual increases in the federal funds rate.

Perhaps the only real wrinkle is that inflation remains stubbornly low, despite unemployment being at 4.2%. Some measures of inflation expectations are rising, so the best bet is for a 25 basis point rise in December.

The Fed’s statement made pretty explicit how they think about balance these factors, stating:

the Committee continues to expect that, with gradual adjustments in the stance of monetary policy, economic activity will expand at a moderate pace, and labor market conditions will strengthen somewhat further. Inflation on a 12-month basis is expected to remain somewhat below 2 percent in the near term but to stabilize around the Committee’s 2 percent objective over the medium term.

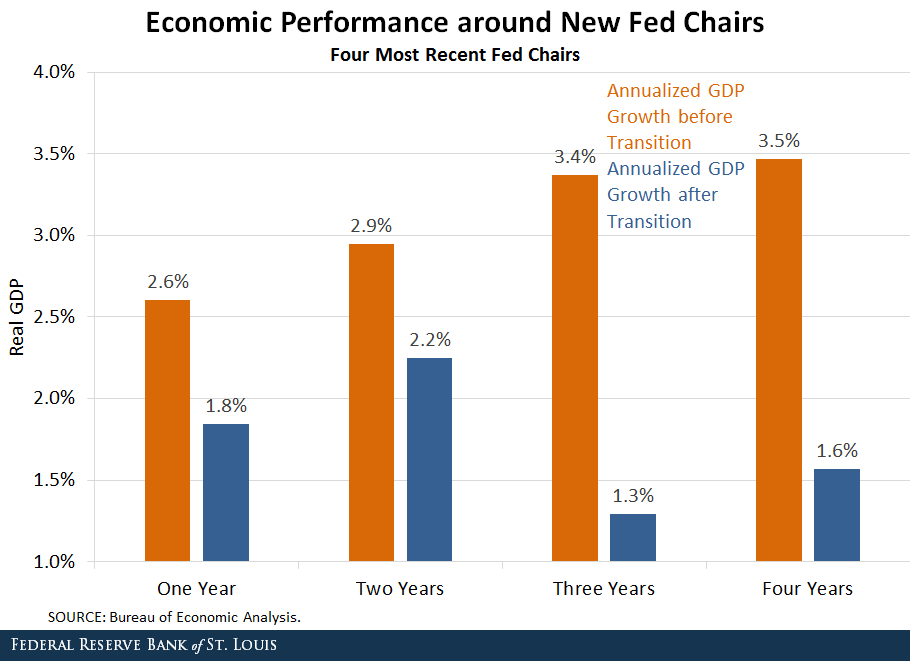
Of course, current Fed Chair Janet Yellen’s term concludes in February next year, and it is being widely reported that President Trump will not reappoint her. Rather he seems set (to the extent that is possible with him) to appoint Jay Powell as Chair.

I will have more to say about that in future columns, but the main thing to note here is that Powell is extremely likely to continue with the path of monetary policy that Yellen has laid out.

So why is it that the US – which suffered a major downturn – seems to have a stronger economy than Australia – which did not even go into recession in 2008-09?

One view is that the US went through a process of Schumpetarian “creative desctruction”. Homeowners who couldn’t afford their properties got foreclosed on, investment banks that weren’t viable went bust, and the rest of the financial system was recapitalised.

Australian banks, by contrast have made some progress in getting their funding structure to be less short-term and dependent on US capital markets – but only so much. And it seems quite possible that they continue to make questionable loans – particularly interest-only loans – as I wrote about here, and spoke about here.

A second view is that the US economy is better able to adapt to the changing nature of the modern economy. It has much more flexible labour markets – although much harsher and less rewarding for average workers.

Perhaps it is neither of these, but presumably both the Reserve Bank and Treasury are trying to understand what looks like a striking different between the US and Australian experiences.

Author: Richard Holden, Professor of Economics and PLuS Alliance Fellow, UNSW

FED Flags Rate Rises; Again, But Holds

The FED held their benchmark rate again, but the latest Federal Reserve FOMC statement contains a firm indication of rises ahead, if but slowly. Meantime, the balance sheet normalization is proceeding.

Information received since the Federal Open Market Committee met in September indicates that the labor market has continued to strengthen and that economic activity has been rising at a solid rate despite hurricane-related disruptions. Although the hurricanes caused a drop in payroll employment in September, the unemployment rate declined further. Household spending has been expanding at a moderate rate, and growth in business fixed investment has picked up in recent quarters. Gasoline prices rose in the aftermath of the hurricanes, boosting overall inflation in September; however, inflation for items other than food and energy remained soft. On a 12-month basis, both inflation measures have declined this year and are running below 2 percent. Market-based measures of inflation compensation remain low; survey-based measures of longer-term inflation expectations are little changed, on balance.

Consistent with its statutory mandate, the Committee seeks to foster maximum employment and price stability. Hurricane-related disruptions and rebuilding will continue to affect economic activity, employment, and inflation in the near term, but past experience suggests that the storms are unlikely to materially alter the course of the national economy over the medium term. Consequently, the Committee continues to expect that, with gradual adjustments in the stance of monetary policy, economic activity will expand at a moderate pace, and labor market conditions will strengthen somewhat further. Inflation on a 12-month basis is expected to remain somewhat below 2 percent in the near term but to stabilize around the Committee’s 2 percent objective over the medium term. Near-term risks to the economic outlook appear roughly balanced, but the Committee is monitoring inflation developments closely.

In view of realized and expected labor market conditions and inflation, the Committee decided to maintain the target range for the federal funds rate at 1 to 1-1/4 percent. The stance of monetary policy remains accommodative, thereby supporting some further strengthening in labor market conditions and a sustained return to 2 percent inflation.

In determining the timing and size of future adjustments to the target range for the federal funds rate, the Committee will assess realized and expected economic conditions relative to its objectives of maximum employment and 2 percent inflation. This assessment will take into account a wide range of information, including measures of labor market conditions, indicators of inflation pressures and inflation expectations, and readings on financial and international developments. The Committee will carefully monitor actual and expected inflation developments relative to its symmetric inflation goal. The Committee expects that economic conditions will evolve in a manner that will warrant gradual increases in the federal funds rate; the federal funds rate is likely to remain, for some time, below levels that are expected to prevail in the longer run. However, the actual path of the federal funds rate will depend on the economic outlook as informed by incoming data.

The balance sheet normalization program initiated in October 2017 is proceeding.

US Banks’ Net Interest Margins Are Still Increasing

The ANZ Net Interest Margin (NIM), reported last week was 1.99%, and typically banks in Australia are achieving a NIM slightly above this. So, it was interesting to see this note from Moody’s, discussing the NIM of US banks, which has risen to 3.21%, and continues a positive trend over the past year.

Last week, US banks’ reported third-quarter earnings and higher net interest margins (NIM), a credit positive because NIM is a key driver for net interest income, which accounts for more than half of most banks’ net revenue.

Quarter over quarter, the average NIM for the largest US regional banks increased three basis points (Exhibit 1) to 3.21% from 3.18%, continuing a four-quarter positive trend. However, the rate of improvement is slowing. The Federal Funds rate increased 25 basis point (bp) in each of the past three quarters. However, as the bars show, the rate of improvement for listed regional banks’ average NIM has declined each quarter.

Accelerating deposit costs explain why the NIM is not increasing at a consistent rate with each 25 bp increase in the Federal Funds rate. Exhibit 2 shows deposit betas for total deposits (interest-bearing and noninterest-bearing) for each of the past three quarters. Deposit beta is the increase in cost of deposits relative to the increase in the Federal Funds rate. There was a significant step up in beta in the second quarter, which continued in the third quarter. In their earnings calls, most bank managements indicated that retail deposits are not repricing upward, despite the rise in market interest rates. This is not the case with deposits from the banks’ wealth management clients, and especially from their commercial clients, which are both more price sensitive.

US GDP At 3% Says FED Likely To Raise Rates

According to the US Bureau of Economic Analysis real gross domestic product (GDP) increased at an annual rate of 3.0 percent in the third quarter of 2017, according to the “advance” estimate released by the Bureau of Economic Analysis. In the second quarter, real GDP increased 3.1 percent.

The Bureau emphasized that the third-quarter advance estimate released today is based on source data that are incomplete or subject to further revision by the source agency. The “second” estimate for the third quarter, based on more complete data, will be released on November 29, 2017.

The increase in real GDP in the third quarter reflected positive  contributions from personal consumption expenditures (PCE), private inventory investment, nonresidential fixed investment, exports, and federal government spending. These increases were partly offset by negative contributions from residential fixed investment and state and local government spending. Imports, which are a subtraction in the calculation of GDP, decreased.

The deceleration in real GDP growth in the third quarter primarily reflected decelerations in PCE, in nonresidential fixed investment, and in exports that were partly offset by an acceleration in private inventory investment and a downturn in imports.

Current-dollar GDP increased 5.2 percent, or $245.5 billion, in the third quarter to a level of $19,495.5 billion. In the second quarter, current-dollar GDP increased 4.1 percent, or $192.3 billion.

The price index for gross domestic purchases increased 1.8 percent in the third quarter, compared with an increase of 0.9 percent in the second quarter. The PCE price index increased 1.5 percent, compared with an increase of 0.3 percent. Excluding food and energy prices, the PCE price index increased 1.3 percent, compared with an increase of 0.9 percent.

Higher Bond Yields Could Depress Share Prices

From Moody’s

Any analysis regarding the appropriate valuation of a long-lived asset must account for the influence of interest rates. All else the same, a rise by the interest rates of lower-risk debt obligations, namely US Treasury debt, will reduce the prices of other financial and real assets. Whenever asset prices defy higher interest rates and rise, a worrisome overvaluation of asset prices may be unfolding. Today’s high price-to-earnings multiples of equities and narrow yield spreads of corporate bonds have increased the vulnerability of financial asset prices to a widely anticipated climb by short- and long-term Treasury yields.

As of 2017’s third quarter, the market value of US common stock was 15.4 times as great as the prospective moving yearlong average of US after tax profits. Third-quarter 2017’s ratio of common equity’s market value to yearlong after-tax profits was the highest since the 16.2:1 of second-quarter 2002. More importantly, the ratio last rose up to 15.4:1 in first-quarter 1998 and would ultimately peak at the 26.0:1 of third-quarter 2000. Stocks may be richly priced relative to after-tax profits, but that does not preclude a further overvaluation of equities vis-a-vis corporate earnings. (Note that the measure of after-tax profits employed in this discussion is from the National Income Product Accounts, excludes changes in the value of inventories and some extraordinary gains and losses, and uses economic depreciation instead of accounting depreciation.)

Today’s equity market differs from that of 1998-2000 for reasons extending beyond 1998-2000’s average aggregate price-to-earnings ratio (P:E) of 21.2:1, which was so much greater than the recent 15.4:1.

In addition, 1998-2000’s equity market seems even more overpriced compared to the current market because the recent 2.43% 10-year Treasury yield was so much lower than its 5.64% average of 1998-2000.

The valuation of equities very much depends on interest rates. Holding everything else constant, priceto-earnings multiples will climb higher as benchmark interest rates decline. If benchmark interest rates fall, the market will be willing to accept a lower earnings yield, or a lower ratio of earnings to the market value of common stock. At some level of corporate earnings, the attainment of a lower earnings yield will be achieved through an increase in share prices. To the contrary, a rise by interest rates will push the earnings yield higher. Barring a sufficient climb by after-tax profits, a higher earnings yield will require lower share prices.