The Recent Evolution of U.S. Local Labor Markets

Interesting post from the Federal Reserve Bank of ST. Louis, shows that Counties with severe declines in housing net worth during the 2007-09 recession experienced larger declines in employment.

The U.S. national labor market has recovered from the effects of the 2007-09 recession. The national unemployment rate was 10 percent at the end of 2009 but now stands at only 4.7 percent, which the Federal Open Market Committee considers close to the rate’s long-run value.1 Despite the national labor market recovery, significant regional variation remains. Recent economic research highlights links between regional labor and housing markets. This essay examines the recent recession and recovery by plotting county-level unemployment rates and changes in houses prices and finds a negative correlation between the two.

National unemployment reached its pre-recession low in December 2007, with the unemployment rate in 1 in 3 counties below 4 percent. Regions with higher unemployment rates included the West Coast, Central South, and Upper Peninsula of Michigan. The Midwest and South, from Minnesota to Texas, had the lowest unemployment rates—below 3.5 percent in most counties. As the recession deepened, unemployment rates rose until only 1 in 15 counties remained below 4 percent. Figure 1 shows the percentage-point changes in county-level unemployment rates from the pre-recession low to the peak of the U.S. unemployment rate (December 2007 to October 2009) and from the peak to the most recent data (December 2007 to April 2016). Shades of red (blue) indicate increases (decreases) in county unemployment rates.2 As shown in the top panel, by October 2009, the unemployment rate in most counties increased between 4 and 20 percentage points. The areas with higher unemployment rates before the recession experienced larger increases in unemployment during the recession. For a strip of counties in the Midwest, the unemployment rate remained low, increased only slightly, or even declined.

As shown in the bottom panel of Figure 1, although some county-level unemployment rates remain slightly above their pre-recession levels, most have recovered to or below those levels. As prior to the recession, the unemployment rate in about 1 in 3 counties is below 4 percent. The unemployment rates in most counties in Arizona, New Mexico, Nevada, and Utah remain above their pre-recession levels, while counties in the Midwest remain mostly below their pre-recession levels.

Why did unemployment rise so severely in some areas but stay low in others? One explanation may be related to the elasticity of the housing supply. Gascon, Arias, and Rapach (2016) argue that areas with an inelastic housing supply (i.e., the supply does not respond much to changes in house prices) are more vulnerable to recessions and experience worse downturns than areas with a more elastic supply. An inelastic housing supply leads to larger house price drops and declines in net worth during downturns, leading to larger declines in local consumption spending that further depress the local economy. Mian and Sufi (2014) show that counties with severe declines in housing net worth during the 2007-09 recession experienced larger declines in employment.3

We illustrate this correlation using county-level house price data from the CoreLogic Home Price Index. The scatter plots in Figure 2 show for the two periods noted above, respectively, the percent change in county house prices relative to the percentage-point change in the county unemployment rate, weighted by the county population in 2007.4 The size of each dot represents the county population. The figure shows a strong negative correlation between changes in house prices and changes in the unemployment rate: Dur­ing the recession, counties with larger decreases in house prices experienced larger increases in the unemployment rate (left panel), while during the expansion the opposite has been true (right panel).

Notes

1 For Federal Open Market Committee projections, see https://www.federalreserve.gov/monetarypolicy/fomcprojtabl20160316.htm.

2 We downloaded county-level unemployment data from GeoFRED® and then applied the Census Bureau’s X-13 ARIMA seasonal adjustment program to look at percentage-point changes in the unemployment rate from peak to trough and from peak to peak.

3 Mian and Sufi (2014) show that housing net worth mostly affects nontradable employment, or employment in industries that are not tradable outside the local labor areas. For example, restaurants and retail shops are nontradable, while agriculture production is tradable.

4 Because county-level house price data are not as available as unemployment rate data, fewer counties are included in Figure 2 than Figure 1. House price data were also seasonally adjusted using the Census Bureau’s X-13 ARIMA seasonal adjustment program. April 2016 is the most recent month for which county-level house price data are available.

Are Key Investment Indicators Signaling a Recession?

From The St Louis Fed On The Economy Blog.

A few key economic indicators may give some forecasters reason to think a recession is on the horizon. But when put into historical context, it seems that the economy is still expanding heading into the last half of the year.

On July 29, the Bureau of Economic Analysis (BEA) released the advance estimate for second-quarter gross domestic product (GDP). Also included in this report was the annual update to the national income accounts that resulted in revisions to the past three years of data.

The advance estimate indicated that real GDP rose at a 1.2 percent annual rate in the second quarter.1 Although the economy rebounded modestly from its anemic growth rate of 0.8 percent in the first quarter, the advance estimate was much weaker than the consensus estimate of 2.6 percent.2

Moreover, the BEA reported that real GDP growth was measurably weaker over the previous three quarters (2015:Q3 to 2016:Q1) than earlier estimates suggested. As a result, real GDP growth over the past four quarters now stands at 1.2 percent, its lowest four-quarter growth rate in three years.3

Slowing Economic Growth Rate

As seen in the figure below, the economy’s growth rate has decelerated sharply since the first quarter of 2015 (3.3 percent). Although the economy’s growth rate is barely above 1 percent, there have been episodes over the past few years when growth had also slowed sharply. Thus, this episode may be another example of a temporary slowdown, the result of periodic shocks that hit the economy. Still, it is also possible that this slowing is the leading edge of something more substantial—perhaps a recession.

FixedInvSignalRecessionGDP

The state of the business cycle plays an important role in the St. Louis Fed’s new characterization of the U.S. macroeconomic and monetary policy outlook.4 In this characterization, the economy is viewed as operating in a specific regime that tends to be persistent. These regimes could be periods of low productivity growth or business expansion or recession. And since optimal monetary policy is dependent on the regime the economy finds itself in, identifying when the economy slides into a recession is vitally important.

Recession Checkpoints

Although recessions are rarely forecastable events, economists nonetheless have a variety of checkpoints for examining the state of the economy. One checkpoint is consumer expenditures, especially on big-ticket items like autos and appliances. The outlook appears reasonably good based on this indicator: Real expenditures on durable goods rose at a robust 8.4 percent rate in the second quarter and are up nearly 4.5 percent from a year earlier.

Two other checkpoints in the national income accounts are expenditures on residential and nonresidential fixed investment. Like durable goods, a person’s decision to buy a house or a business’s decision to invest in a piece of equipment or to build a new structure depends importantly on the individual’s or the firm’s expectation of future income and earnings (and profits), respectively.

During periods of slow or slowing growth, real incomes, earnings and profits tend to slow as well. In response, firms and households typically trim their current and future expenditures. This is why fixed investment outlays are highly cyclical—that is, sensitive to the state of the business cycle.

Here is where the clouds appear a bit more ominous:

  • On the business side, real nonresidential fixed investment (NRFI) declined at a 2.3 percent rate in the second quarter. This was the third consecutive quarterly decline in NRFI.
  • On the housing side, real residential fixed investment (RFI) fell at a 6.1 percent rate in the second quarter, its largest decline in nearly six years. The decline in real RFI was somewhat unusual given the recent strength in the housing sector.

A Historical Look at Fixed Investment

By employing the lens of history, the two figures below can help gauge whether the declines in real NRFI and RFI are likely to be temporary developments or potentially signaling the next recession.

Each figure shows the average growth rate eight quarters before and after the business cycle peak, as determined by the National Bureau of Economic Research. By definition, business expansions occur before the peak and recessions occur after the peak. Recessions are much shorter than expansions.

The average growth rates are culled from periods around the eight business cycle peaks that prevailed from the second quarter of 1960 to the fourth quarter of 2007. In the figures, the average growth before and after the recession is indicated by the orange line. The shaded areas indicate the range of values before and after the business cycle peak. The blue line shows the growth rate of each series from the first quarter of 2014 to the second quarter of 2016.

NonresidentialFixedInvestment

PrivateResidentialFixed

The cyclical indicator properties of each fixed investment series is seen in the figures. On the business side, the growth of real NRFI tends to be positive until the peak, but then growth turns negative, on average, for six consecutive quarters.

On the housing side, the growth of real RFI, on average, turns negative two quarters before the business cycle peak. The growth of real RFI then remains negative during the first two quarters of the recession. But as the shaded areas indicate, there are exceptions to this pattern for both series.

Recession Looming?

Are current fixed investment developments worrisome from an historical standpoint? Two points are worth noting. First, the recent pattern of negative real NRFI growth is somewhat different than the pattern typically seen prior to a business cycle peak. On average, negative NRFI growth is associated with negative real GDP growth for more than one quarter, and we have yet to see that in the current expansion. Subsequent revisions may show that the economy entered into a recession during the fourth quarter of 2015 or the first quarter of 2016, when real GDP growth was less than 1 percent, but that seems unlikely given the economic strength in other areas—especially labor markets.

Second, the decline in real RFI would be consistent with previous prerecession patterns if the U.S. economy was nearing a tipping point in the expansion. Recall that the message from the above figure was that housing usually leads the economy into the recession, posting negative growth rates six months before the peak.

At this point, the majority of industry analysts and professional forecasters remain optimistic about the housing sector over the remainder of 2016 and into 2017. Key positive developments in this regard include expectations of continued strength in labor markets, low mortgage interest rates and relatively high levels of housing affordability.

Conclusion

To sum up, the declines in residential and nonresidential fixed investment are worrying because they are often viewed as reliable leading indicators of the cyclical strength or weakness of the economy. Although economists and other economic analysts find it very difficult—if not impossible—to predict recessions in real time, the available evidence suggests that the economy, though exhibiting stubbornly weak real GDP growth, continued to expand heading into the second half of 2016.

Notes and References

1 Unless noted otherwise, growth rates are expressed at compounded annual rates using seasonally adjusted data.

2 Consensus forecasts for key economic data can be found on the Calendar of Releases cover page of the Federal Reserve Bank of St. Louis’ U.S. Financial Data.

3 Over the past four quarters, the decline in business inventory investment has subtracted 0.6 percentage points from real GDP growth. In the national accounts, final sales is the measure of GDP that removes the contributions to growth from changes in inventory investment. Thus, while growth is measurably stronger according to real final sales, the pattern of final sales growth has also shown the sharp deceleration noted in the figure for real GDP.

4 See Bullard, James. “The St. Louis Fed’s New Characterization of the Outlook for the U.S. Economy,” Federal Reserve Bank of St. Louis, June 17, 2016.

Author Kevin Kliesen, Business Economist and Research Officer

Under Pressure, US Banks Vie for Instant Payment Market

From NY Times.

In this digital age when almost anything can be had in an instant, the movement of money can seem glaringly slow.

Most people paying a housekeeper or collecting money for an office pool still use cash or a check, which can take days to go through — a relative eternity that banking regulators worry is impeding commerce and economic growth.

MobilePay

The slowness has led many Americans to new mobile services, like PayPal’s Venmo or Square Cash, which make it possible to pay a friend instantly with just a phone.

Venmo processed nearly $4 billion in P2P payments last quarter, which represented 141% growth from the prior-year quarter. By comparison, mobile payments processed at PayPal’s core app rose 56% annually to $24 billion.

PayPal’s total processed payments — which include its website, third-party sites, retail stores, and Xoom — rose 29% on a constant-currency basis to $86 billion during the quarter. Venmo might seem small when compared to PayPal’s entire business, but it’s also its fastest-growing platform. However, Venmo is already facing lots of competition in the P2P payments space.

Now, the banks are catching up. On Monday, Wells Fargo joined JPMorgan Chase, Bank of America and US Bank in allowing customers to send money in seconds to one another’s bank accounts using just a phone number or email address. Customers of the biggest banks can now use their mobile phones, say, to send money instantly to a child in college who needs cash.

“We pay attention to what customers are asking for, and we are doing all the things we need to stay competitive,’’ said Brett Pitts, who leads digital initiatives at Wells Fargo.

The stakes are high: Banks are under broad pressure both from the Federal Reserve, which has a “faster payments committee” aimed at requiring immediate improvements, and from tech companies like PayPal and Apple, whose Apple Pay service was a bright spot in its recent earnings report.

All these companies, and Visa and MasterCard, are competing to build and control the payment network of the future.

Banks are promoting their new services as cool and convenient: One Chase advertisement shows the basketball star Stephen Curry dribbling a basketball while making an instant payment on his phone.

American bank executives fear that they could lose ground to plucky payment companies like Venmo, a popular choice among millennials who want to pay each other — and send emoji-filled messages to their friends.

The banks worry that if they do not respond with their own instant payment offerings, they will be relegated to performing less-profitable back-office functions for hip new payment companies, which make their money primarily by charging small fees to customers who pay by credit card rather than directly from a bank account.

The person-to-person payment market is valuable because it allows financial companies to gain the first point of contact with a consumer and then try to sell them other products like loans.

Analysts predict that eventually the new payments network could be extended to connect consumers with merchants, providing a potentially lucrative source of fees for banks.

“It’s like owning a toll road: You are going to get paid by everybody that uses it,” said Gareth Lodge, a payments analyst at Celent, a financial consulting firm.

Mastercard and Visa, which have a tight grip on payments made with credit and debit cards, are also trying to gain a foothold in these new networks.

Late last month, Mastercard acquired a majority stake in VocaLink, the company that operates a mobile and internet payment network in the United Kingdom and is helping to develop an even broader system in the United States. Also, Visa recently announced a broad partnership with PayPal that will make both of their offerings more instantaneous.

Instant person-to-person payment is something that people in many other countries have been able to do for years, and the absence of the service in the United States has been a marker of the relative backwardness of American banks.

The banks began developing the system being introduced this year in 2011, when Bank of America, JPMorgan and Wells Fargo created a network called clearXchange. That system has already allowed bank customers to send each other money using just an email address or cellphone number, but transactions were not instant until this year.

In addition to payments technology that the nation’s largest banks are rolling out this summer, banks that belong to an industry group called the Clearing House are developing a broader network that will allow businesses and even governments to make large instant payments.

A fast and efficient payment network also has implications for the economy. Federal officials and analysts say the current lag time between when a payment is sent and when the money is cleared to spend can hinder businesses from balancing their books and managing their supplies. The lag also puts the United States at a disadvantage compared with, say, Europe, where banks are far ahead in making payments instantaneous.

The banks now face a challenge to make their real-time technology easy enough to lure customers away from start-ups like Venmo.

With Venmo, a user can send money to anyone simply by tapping into the app and entering a phone number or email address. By contrast, customers of JPMorgan Chase, for example, must log into their Chase app using their password, then navigate through a series of somewhat clunky tabs to initiate a transaction with QuickPay. The banks also lack the social networking capabilities that have helped make Venmo a hit.

Talie Baker, a payments analyst at the Aite Group, a banking consultancy, said that even her friends who have Chase’s service often do not think it is worth using. “I can’t get anybody to accept a Chase QuickPay payment from me,” she said. “Banks are probably going to start losing market share if they don’t make their applications as easy to use as Venmo is.”

Chase and the other banks say the additional steps they ask of customers provide more security. The banks also say they are already handling significantly more personal payments than Venmo and other competitors like Square Cash.

Chase said that last year it processed about $20 billion in so-called peer-to-peer payments, while Venmo handled about $10 billion. PayPal as a whole made about $40 billion in such payments, the company said.

The banks should have a significant advantage over technology companies, given the sheer number of customers they already have, payment industry analysts say.

PayPal and the banks say the most immediate opportunity is not taking business from one another, but cannibalizing the enormous number of payments that are still made by cash and check, which represent more than three-quarters of all peer-to-peer transactions.

Bill Ready, who oversees Venmo at PayPal, said he was happy that American banks were finally catching up with the progress that has been made in most other developed countries.

“The rest of the world has already been here a long time,” he said. “To see an industry move is a great thing.”

Update On US Residential Mortgage Lending Practices

The Fed has released the latest Senior Loan Officer Survey on Bank Lending practices and discussed the responses from 71 domestic banks and 23 U.S. branches and agencies of foreign banks.

The FED says banks reported that demand for most types of Residential Real Estate loans strengthened over the second quarter.

Feb-RE-June-16-2 Responses to a set of special annual questions on the approximate levels of lending standards suggested that banks’ lending standards banks continued to report in the July 2016, that on balance, domestic banks lending standards for all five categories (GSE-eligible mortgages, government-insured mortgages, jumbo mortgages, subprime mortgages, and HELOCs) remained tighter than the midpoints of the ranges observed since 2005. Of note, a major net fraction of banks reported that the current level of standards on subprime residential mortgage loans is tighter than the reference point.

Feb-RE-June-16-1The report also discusses commercial lending and consumer loans.

Regarding loans to businesses, the July survey results indicated that, on balance, banks tightened their standards on commercial and industrial (C&I) and commercial real estate (CRE) loans over the second quarter of 2016. The survey results indicated that demand for C&I loans was little
changed, while demand for CRE loans had strengthened during the second quarter on net.

Banks’ lending standards for all categories of C&I loans are currently easier than the midpoints of the ranges that have prevailed since 2005, except
for syndicated loans to below-investment-grade firms. However, banks also generally indicated that standards on all types of CRE loans are currently tighter than the midpoints of their respective ranges.

Banks indicated that changes in standards on consumer loans were mixed, while demand strengthened across all consumer loan types.

Fed Holds US Cash Rate, Again

The Fed just released their latest update on monetary policy, and once again kept the rate at its current low level. The tone of the note was slightly more positive. They are still chasing the 2% inflation target and underscore that future cash rate lifts will be slow.  The market hardly moved on the news.

http://930e888ea91284a71b0e-62c980cafddf9881bf167fdfb702406c.r96.cf1.rackcdn.com/data/tvc_5de6dfd46975193db34a6ec4081564bb.png

Information received since the Federal Open Market Committee met in June indicates that the labor market strengthened and that economic activity has been expanding at a moderate rate. Job gains were strong in June following weak growth in May. On balance, payrolls and other labor market indicators point to some increase in labor utilization in recent months. Household spending has been growing strongly but business fixed investment has been soft. Inflation has continued to run below the Committee’s 2 percent longer-run objective, partly reflecting earlier declines in energy prices and in prices of non-energy imports. Market-based measures of inflation compensation remain low; most survey-based measures of longer-term inflation expectations are little changed, on balance, in recent months.

Consistent with its statutory mandate, the Committee seeks to foster maximum employment and price stability. The Committee currently expects that, with gradual adjustments in the stance of monetary policy, economic activity will expand at a moderate pace and labor market indicators will strengthen. Inflation is expected to remain low in the near term, in part because of earlier declines in energy prices, but to rise to 2 percent over the medium term as the transitory effects of past declines in energy and import prices dissipate and the labor market strengthens further. Near-term risks to the economic outlook have diminished. The Committee continues to closely monitor inflation indicators and global economic and financial developments.

Against this backdrop, the Committee decided to maintain the target range for the federal funds rate at 1/4 to 1/2 percent. The stance of monetary policy remains accommodative, thereby supporting further improvement in labor market conditions and a return to 2 percent inflation.

In determining the timing and size of future adjustments to the target range for the federal funds rate, the Committee will assess realized and expected economic conditions relative to its objectives of maximum employment and 2 percent inflation. This assessment will take into account a wide range of information, including measures of labor market conditions, indicators of inflation pressures and inflation expectations, and readings on financial and international developments. In light of the current shortfall of inflation from 2 percent, the Committee will carefully monitor actual and expected progress toward its inflation goal. The Committee expects that economic conditions will evolve in a manner that will warrant only gradual increases in the federal funds rate; the federal funds rate is likely to remain, for some time, below levels that are expected to prevail in the longer run. However, the actual path of the federal funds rate will depend on the economic outlook as informed by incoming data.

The Committee is maintaining its existing policy of reinvesting principal payments from its holdings of agency debt and agency mortgage-backed securities in agency mortgage-backed securities and of rolling over maturing Treasury securities at auction, and it anticipates doing so until normalization of the level of the federal funds rate is well under way. This policy, by keeping the Committee’s holdings of longer-term securities at sizable levels, should help maintain accommodative financial conditions.

Voting for the FOMC monetary policy action were: Janet L. Yellen, Chair; William C. Dudley, Vice Chairman; Lael Brainard; James Bullard; Stanley Fischer; Loretta J. Mester; Jerome H. Powell; Eric Rosengren; and Daniel K. Tarullo. Voting against the action was Esther L. George, who preferred at this meeting to raise the target range for the federal funds rate to 1/2 to 3/4 percent

US Households Now Less Likely to Say Using Credit Is OK

Interesting observations about household credit from the US Federal Reserve. In general, fewer households are responding that it is a good idea to buy things on credit. The share with positive answers decreased from 32.4 percent in 2004 to 29.7 percent in 2007 to 25.2 percent in 2013. A similar pattern is observed for answers about vacation, coat/jewelry, car and educational expense categories. The only category with an increase in the share with positive answers is “living expenses.”

Overall, the results suggest that households’ attitude toward credit has changed, signaling a reduction in credit demand. This is an important topic for further research, because the policy recommendations are very different if the reduction in household credit was caused by a reduction in the availability of credit (credit supply) or by households’ attitude toward credit.

In previous articles, we saw that household debt has been declining and why debt has dropped since the financial crisis. Total household debt, which peaked in 2009, stabilized at 13 percent below the previous peak in the first quarter of 2013. One of the most relevant questions regarding this trend is: Was it caused by supply or demand factors?

While credit supply factors capture the behavior of lenders (banks and other financial institutions), credit demand factors represent the willingness of households to borrow. In this blog post, we present data on households’ attitude toward credit to evaluate potential changes in credit demand.

We used data from the Survey of Consumer Finances (SCF). This survey asks households questions on credit attitudes. In particular, households are asked if they think it is generally a good or bad idea for people to buy things by borrowing or on credit. The survey also asked specifically about borrowing money:

  • To cover the expenses of a vacation trip
  • To cover living expenses when income is cut
  • To finance the purchase of a fur coat or jewelry
  • To finance the purchase of a car
  • To finance educational expenses

The figure below shows the percentage of individuals who answered that it is generally a good idea to buy things on credit.

BuyonCredit


US Bank Stress Tests Highlight Improving Resilience – Fitch

The first stage of this year’s US bank stress tests highlights improving resilience with solid results despite a severely harsher scenario that included a more severe downturn than previous tests and negative short-term US Treasury rates, Fitch Ratings says. All 33 US bank holding companies passed the minimum capital ratio requirements. Tested firms overall generally performed better, posting higher capital ratios and smaller declines in capital ratios than in the past.

The largest global banks generally performed better than last year, although they still account for over half of projected losses under the severely adverse scenario, since they are subject to global market shock and counterparty default component. Pre-provision net revenue (PPNR) projections were noticeably higher this cycle, particularly for the five largest global trading and universal banks – Goldman Sachs, JP Morgan, Morgan Stanley, Citigroup and Bank of America. This more than offset higher losses from the stress scenario and may mean that some large global firms that typically revised capital plans post-DFAST won’t do so this year.

The test hit Morgan Stanley hardest in terms of capital erosion, although very high starting risk-weighted capital ratios gives it greater flexibility. It is more constrained by the leverage ratio, which had a projected minimum of 4.9%, leaving only a 90bp cushion above the requirement.

Among other weaker performers, two firms in the midst of M&A performed significantly worse than last year. Capital ratios for Huntington Bancshares may have taken a hit from the pending FirstMerit acquisition, resulting in a projected minimum common equity tier 1 (CET1) ratio of 5% – the lowest of all 33 banks. The First Niagara merger may be a key driver for the erosion of KeyCorp’s CET1 ratio to minimum 6.4%. These banks and others close to the 4.5% CET1 minimum threshold may constrain their capital return requests.

For firms that fared well quantitatively, the threat of a capital plan rejection for qualitative reasons under the second stage – Comprehensive Capital Adequacy Review (CCAR) – is still a significant hurdle. Modeling negative interest rates is likely to be more challenging for regional banks than global banks, like Citigroup, that already operate in markets with negative rates. The qualitative assessment may also bring up issues for new participants. Both are foreign-owned banks, which historically haven’t performed as well in the CCAR.

Credit card issuers and trust and processing banks performed well with the least capital erosion. However, their pre-provision net revenue projections were down compared to 2015, probably because of negative rate assumptions depressing interest income, which particularly impacts processing banks. Bank of New York Mellon and State Street’s PPNR projections fell around 20%-30%. Still, as in previous cycles, these firms showed projected net income over the nine quarters of the stress horizon, in contrast to net losses for firms with other business models.

Negative rates also had more impact on regional banks. The Fed said that firms more focused on traditional lending activities were more affected by this assumption.

Almost three quarters of the $526 billion in losses projected under the severely adverse scenario stemmed from loans, while 21% arose from trading and counterparty positions subject to the global market shock and counterparty default component. Projected loan loss rates varied significantly from 3.2% on domestic first lien mortgages to 13.4% on credit cards. The loss rate for domestic commercial real estate loans improved by 160bp to 7%, the first rise since 2012. The rate for commercial and industrial (C&I) loans deteriorated, jumping 90bp to 6.3%. C&I loan growth has been strong and the weaker performance may reflect energy sector weakness within these portfolios.

Ex-Deutsche Bank trader pleaded guilty in U.S. to Libor scheme

According to Reuters, U.S. and European authorities investigations relating to LIBOR rate rigging have resulted in roughly US$9 billion in sanctions worldwide against financial institutions, and 16 people being charged by the Justice Department. We discussed the problem of these financial benchmarks yesterday. Now, U.S. prosecutors have secured a guilty plea from a second former Deutsche Bank AG trader for conspiring to manipulate Libor, the benchmark interest rate at the center of global investigations of various banks, court records show.

Timothy Parietti, a 50-year-old former managing director of Deutsche Bank’s New York money market derivatives trading desk, pleaded guilty on May 26 in Manhattan federal court to conspiring to commit wire fraud and bank fraud, records unsealed on Wednesday showed. According to a transcript, Parietti admitted that from 2006 to 2008, he participated in a scheme with other bank employees to manipulate Libor so that trades he made on financial instruments linked to the benchmark might be more profitable.

“At the time, I knew that this practice was dishonest. I participated in this dishonest practice and I accept responsibility for my role,” Parietti said. “I’m sorry for my conduct.”

The plea, pursuant to a cooperation agreement, was followed on June 2 by the U.S. Justice Department unveiling an indictment against two other former Deutsche Bank traders, Matthew Connolly of New Jersey and Gavin Campbell Black of London.

Both cases followed the earlier guilty plea in October of a former senior trader at Deutsche Bank, Michael Curtler of London. The bank agreed in April 2015 to pay $2.5 billion to resolve related U.S. and U.K. probes. According to charging papers, from 2005 to 2011 Parietti and others engaged in a scheme to manipulate Libor, which was tied to the profitability of derivative trades in which they had a financial interest. In charging Connolly and Black, prosecutors said that at least eight other people, including Curtler, were involved in the scheme to submit false estimates for some Libor rates in order to manipulate it. Connolly has pleaded not guilty. Black’s attorney has previously declined comment.


Credit Card Debt over the Life-cycle

Excellent analysis from the FED, looking at credit card debt in the US. Total credit card debt is down, because individuals younger than 46 deleveraged the most after the financial crisis of 2008.

Eggertsson and Krugman (2012) contend that “if there is a single word that appears most frequently in discussions of the economic problems now afflicting both the United States and Europe, that word is surely debt.” These authors and others offer theoretical models that present the debt phenomenon as follows: The economy is populated by impatient and patient individuals. Impatient individuals borrow as much as possible, up to a debt limit. When the debt limit suddenly tightens, impatient individuals must cut expenditures to pay their debt, depressing aggregate demand and generating debt-driven slumps. Such a reduction in debt is called deleveraging.

The evolution of total credit card debt around the financial crisis of 2008 appears consistent with that sequence: Credit card debt increased quickly before the financial crisis and then fell for six years after that episode. Although credit card debt began to rise again in 2015, the total remains 20 percent below its 2009 peak. In this essay, we analyze credit card debt by borrower age group for the 2004-08 and 2008-15 periods to determine whether the sequence of events holds at the micro (household) level.

The data used are from the Federal Reserve Bank of New York Consumer Credit Panel/Equifax. The first figure shows total credit card debt1 of individuals 20 to 70 years of age. Credit card debt increased by approximately $114 billion in the 2004-08 period, peaked in 2009, and then decreased by over $193 billion in the 2008-15 period.2

To better understand how individual credit card debt changed over the two periods, we calculate the share each age group contributed to the total changes. The results are presented in the second figure. In the 2004-08 period, credit card balances increased across all age groups. Most of the increase—almost 50 percent—however, was driven by individuals 56 years of age and older. Remarkably, individuals younger than 46 years of age, who arguably need to borrow the most, accounted for only 25 percent of the increase in total debt.

Deleveraging of credit card debt after the financial crisis of 2008 continued until 2015. Importantly, in clear contrast with the pre-crisis period (2004-08) when older individuals increased their credit card debt the most, younger individuals reduced theirs the most during the post-crisis (2008-15) period. Individuals 56 years of age and older accounted for virtually none of the decrease in credit card debt. For individuals 66 to 70, credit card debt actually increased. Strikingly, individuals younger than 46 accounted for 68 percent of the deleveraging.

These findings suggest that although the evolution of credit card debt at the aggregate level is consistent with the sequence of events described by Eggertsson and Krugman (2012), changes at the individual level are not. In particular, younger individuals—who contributed little to the pre-crises expansion of credit—deleveraged the most.

What accounts for the deleveraging by younger individuals? After the crisis, younger individuals, with arguably poor job prospects, decreased their debt and increased their savings. The deterioration of job prospects is well documented by Moscarini and Postel-Vinay (2016), who named it “the failure of the job ladder.” The deterioration of jobs prospects, however, would not have affected older individuals, who had arguably already climbed the job ladder and thus did not need to deleverage. Thus, labor market changes may have caused the deleveraging. And what explains the period of credit expansion? It’s possible that the relaxation of credit limits played a role. Of course, more evidence is needed to determine the accuracy of these possible explanations. Identifying the real factors that caused the deleveraging is important because policy recommendations may depend crucially on them.

Notes

1 The Equifax credit-reporting data include a nationally representative 5 percent sample of all adults with a Social Security number and a credit report. The credit card debt is called “bankcard” debt in the dataset. Since consumer credit profiles are recorded at the end of each quarter, credit card debt is not revolving.

2 Notice that the total differs from that of the United States because the data used here include only a sample of individuals. Actually, we use a subsample of the Federal Reserve Bank of New York Consumer Credit Panel/Equifax data.

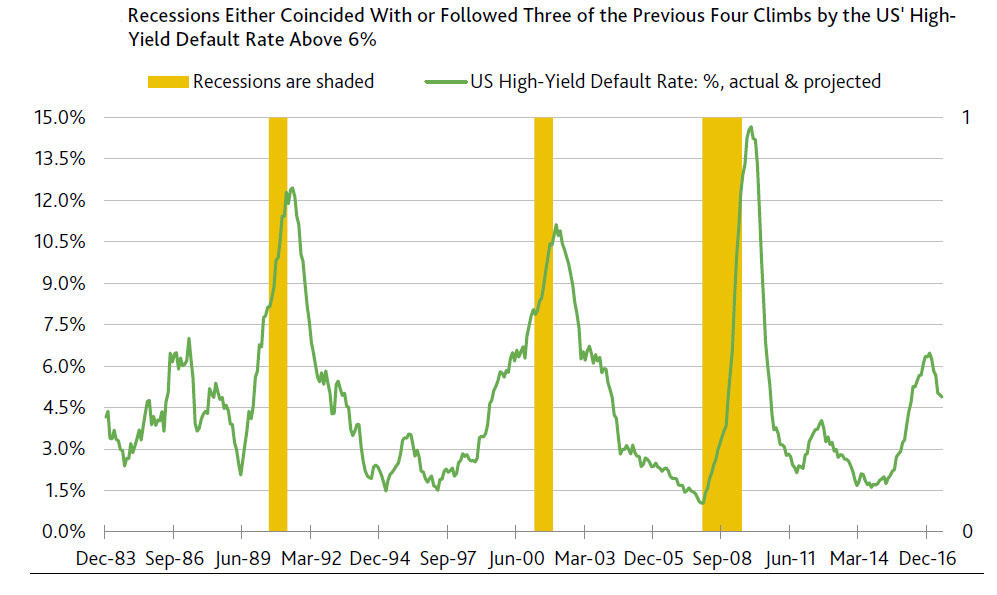
Is The US Heading For A Recession?

A research note from Moody’s suggests that based on an analysis of aggregate measures of corporate credit quality, the current business cycle in the US is in its latter stage. As a result, recession may be unavoidable.

They say the outlook for the credit cycle is likely to deteriorate, barring improved showings by cash flows and profit, where enhanced prospects for the latter two metrics depend largely on a sufficient rejuvenation of business sales. Their analysis suggests that recessions materialise within 12 months of the yearlong ratio of internal funds to corporate debt descending to 19.1% in Q1-2008, Q1-2000 and Q4-1989. As derived from the Federal Reserve’s Financial Accounts for the US, or the Flow of Funds, the moving yearlong ratio of internal funds to corporate debt for US none-financial corporations has eased from Q2-2011’s current cycle high of 25.4% to the 19.1% of Q1-2016.

US-CreditThey say, “if revenue growth does not quicken appreciably, internal funds will continue to lag debt and recession may be avoidable. Given the now mature phase of the current upturn, an enhancement of credit quality requires simultaneous accelerations of revenues and cash flows. By itself, slower growth by corporate debt may not be enough to extend the upturn”.