Immigration, Unemployment, Wages and House Prices

From The Conversation.

Australia should cut its immigration intake, according to Tony Abbott in a recent speech at the Sydney Institute. Abbott explicitly cites economic theory in his arguments: “It’s a basic law of economics that increasing the supply of labour depresses wages; and that increasing demand for housing boosts price.”

But this economic analysis is too basic. Yes, supply matters. But so does demand.

While migration has increased labour supply, it has done so primarily in sectors where firms were starved of labour, and at a time of broad economic growth.

Immigration has put pressure on infrastructure, but our problems are more a function of governments failing to upgrade and expand infrastructure, even as migrants pay taxes.

And while migrants do live in houses, the federal government’s fondness for stoking demand and the inactivity of state governments in increasing supply are the real issues affecting affordability.

The economy isn’t a fixed pie

Let’s take Abbott’s claims about immigration one by one, starting with wages.

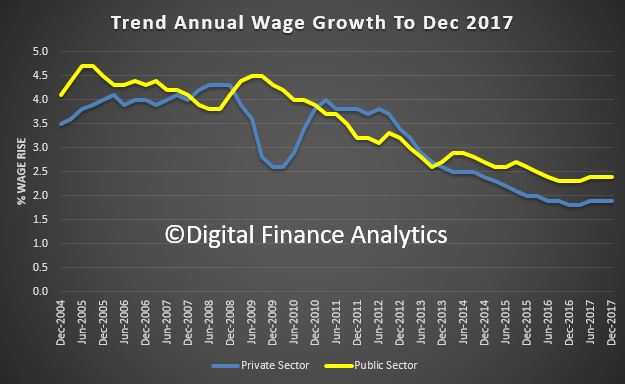
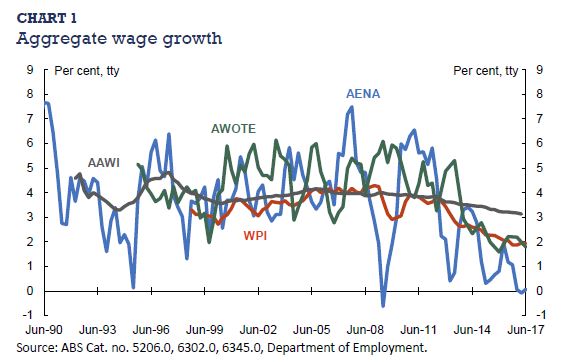
It’s true that if you increase labour supply that, holding other factors that affect wages constant, wages will decline. However, those other factors are rarely constant.

Notably, if the demand for labour is increasing by more than supply (including new migrants), then wages will rise.

This is a big part of the story when it comes to the relationship between wages and migration in Australia. Large migrant numbers have been an almost constant feature of Australia’s economy since the end of the second world war, if not earlier.

But these migrants typically arrived in the midst of economic growth and rising demand for labour. This is particularly true in recent decades, when we have had one of the longest periods of unbroken growth in the history of the developed world.

In our study of the Australian labour market, we found no relationship between immigration rates and poor outcomes for incumbent Australian workers in terms of wages or jobs.

Australia uses a point system for migration that targets skilled migrants in areas of high labour demand. Business is suffering in these areas. Migrants into these sectors don’t take jobs from anybody else because they are meeting previously unmet demand.

These migrants receive a higher wage than they would in their place of origin, and they allow their new employers to reduce costs. This ultimately leads to lower prices for consumers. Just about everybody benefits.

There’s an idea called the “lump of labour fallacy”, which holds that there is a certain amount of work to be done in an economy, and if you bring in more labour it will increase competition for those jobs.

But migrants also bring capital, investing in houses, appliances, businesses, education and many other things. This increases economic activity and the number of jobs available.

Furthermore, innovation has been shown to be strongly linked to immigration. In the United States, for instance, immigrants apply for patents at twice the rate of non-immigrants. And a large number of studies show that immigrants are over-represented in patents, patent impact and innovative activity in a wide range of countries.

We don’t entirely know why this is. It could be that innovative countries attract migrants, or it could be than migrants help innovation. It’s likely that the effect goes both ways and is a strong argument against curtailing immigration.

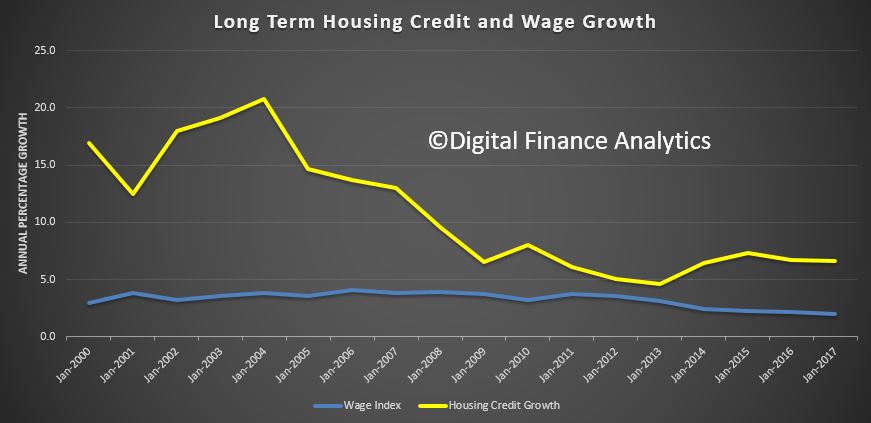
Abbott’s comments are more reasonable in the case of housing affordability because here all other things really are held constant. Specifically, studies show that housing demand is overheated in part by federal government policies (negative gearing and capital gains tax exemptions, for instance) and state governments not doing enough to increase supply.

Governments have responded to high housing prices by further stoking demand, suggesting that people dip into their superannuation, for instance.

In the wake of Abbott’s speech there has been speculation that our current immigration numbers could exacerbate the pressures of automation, artificial intelligence and other labour-saving innovations.

But our understanding of these forces is nascent at best. In previous instances of major technological disruption, like the industrial revolution, the long-run effects on employment were negligible. When ATMs debuted, for example, many bank tellers lost their jobs. But the cost of branches also declined, new branches opened and total employment did not decline.

In his speech, Abbott said that the government needs policies that are principled, practical and popular. What would be popular is if governments across the country could fix our myriad policy problems. Abbott identified some of the big ones – wages, infrastructure and housing affordability.

What would be practical is to identify the causes of these problems and address these directly. Immigration is certainly not a major cause. It would be principled to undertake evidence-based analysis regarding what the causes are and how to address them.

A lot of that has already been done, notably by the Grattan Institute. What remains is for governments to do the politically difficult work of facing the facts.

Authors: Robert Breunig, Professor of Economics, Crawford School of Public Policy, Australian National University; Mark Fabian, Postgraduate student, Australian National University

Want A Wage Rise? – Go To The Public Sector (In Victoria)!

The ABS released their wage price data today for the December 2017 Quarter.  You can clearly see the gap between trend public and private sector rates, with the private sector sitting at 1.9% and public sector 2.4%. The CPI was 1.9% in December, so no real growth for more than half of all households! Hardly stellar…

The seasonally adjusted Wage Price Index (WPI) rose 0.6 per cent in December quarter 2017 according to figures released today by the Australian Bureau of Statistics (ABS).

The WPI rose 2.1 per cent through the year seasonally adjusted to December quarter 2017.

ABS Chief Economist Bruce Hockman said “The annual rate of wage growth has increased for the second consecutive quarter reflecting falling unemployment and underemployment rates, and increasing job vacancy levels.”

Seasonally adjusted, private sector wages rose 1.9 per cent and public sector wages grew 2.4 per cent through the year to December quarter 2017.

In original terms, through the year wage growth to the December quarter 2017 ranged from 1.4 per cent for the Mining industry to 2.8 per cent for the Health care and social assistance industry.

Victoria was the highest through the year wage growth of 2.4 per cent and The Northern Territory recorded the lowest of 1.1 per cent.

Will APRA Loosen Lending Standards Next Year?

Interesting economic summary from Moody’s. They recognise the problem with household finances, and low income growth. They also suggest, mirroring the Reserve Bank NZ, that macroprudential policy might be loosened a little next year.

I have to say, given credit for housing is still running at three times income growth, and at very high debt levels, we are not convinced! I find it weird that there is a fixation among many on home price movements, yet the concentration and level of household debt (and the implications for the economy should rates rise), plays second fiddle.

Also, the NZ measures were significantly tighter, and the recent loosening only slight (and in the face of significant political measures introduced to tame the housing market). So we think lending controls should be tighter still in 2018.

It’s strange examining third quarter data when the fourth stanza has almost passed, but the Australian Bureau of Statistics isn’t known for timely national accounts data. Australia is the last major Asia-Pacific economy to release quarterly GDP numbers. Despite the tardiness, the national accounts gives valuable insight, especially on the investment front in the absence of a reliable monthly gauge.

Australia’s GDP growth hit 0.6% q/q in the September quarter following an upwardly revised 0.9% (previously reported as 0.8%) gain in the June stanza. Annual growth accelerated to 2.8% from the prior 1.8% gain. The annual growth figure is now hovering at potential, which we estimate is around 3%. However, momentum is overstated, given low base effects. In the September quarter of 2016, the Australian economy contracted by 0.5% q/q, only the fourth quarterly contraction in 25 years. This was driven by a sharp fall in investment alongside higher imports. During this period, annual growth slowed by 1.3 percentage point to 1.8%.

Private investment booms

Private investment was a bright spot in the third quarter because of a sharp rise in non-dwelling construction, which made the largest contribution to GDP growth at 0.9 percentage point.

Non-dwelling construction has often become a proxy for mining investment, and the third quarter gain is likely due to the installation of two liquefied natural gas platforms in Western Australia and the Northern Territory. LNG exports are expected to pick up late in the fourth quarter amid increased production capacity. The Wheatstone project began production earlier in October after a two-year construction phrase and
shipped its first export to Japan late in the month. Wheatstone is the sixth of eight projects included in a A$200 billion LNG construction boom that is now in its final stretch. Once the remaining two projects are finalized, Australia could topple Qatar as the world’s biggest LNG exporter. Australia has recently become the world’s second largest exporter of LNG.

Public investment didn’t score as well in the third quarter, declining by 7.5% q/q. This is mainly payback after a boost in the June quarter from the acquisition of the Royal Adelaide Hospital from the private sector.

The housing market has cooled in 2017, and price growth is expected to keep decelerating through 2018; this will keep downward pressure on dwelling investment. For instance, dwelling price growth in Sydney was 5% y/y in November, well down from its double-digit growth in 2016 and earlier in 2017.

This is the result of the lagged impact of earlier macroprudential action that has included higher borrowing costs for homebuyers, especially investors or those taking out interest-only loans. The Australian Prudential Regulation Authority has also imposed limits on bank portfolio exposure to new mortgages.

Owner-occupied housing finance commitments tend to track house price growth and are a good gauge of the underlying pulse. Data released this week show October commitments rose just 0.3% m/m on a trend basis. Growth has slowed substantially from earlier in 2017.

An interesting tidbit we have observed in recent years: Housing regulation in New Zealand tends to lead Australia’s by at least a year. The Reserve Bank of New Zealand was on the front foot trying to cool certain heated housing pockets such as Auckland well before the Australian Prudential Regulation
Authority introduced housing-targeted measures, even though both economies were experiencing strong price growth in some areas. Just recently, the RBNZ announced it had eased some macroprudential measures in light of softer house price growth. Now that Australia’s housing market has cooled, APRA may follow suit with minor reversals in the next year.

Households missing in action

At first glance it was a relief that consumption made a positive contribution to GDP growth, but the details were less pleasing, as spending was concentrated on essential items while discretionary purchases suffered. We calculated that nondiscretionary items rose an average 0.6% over the quarter, and discretionary spending fell by 0.7%.

Of the nondiscretionary items, utility spending rose 1.4% q/q, food was up 1%, rent gained 0.6%, and insurance and financial services grew 1.3%. On the discretionary front, clothing spending fell 1% q/q, recreation and culture was down 0.6%, and spending at cafes and restaurants fell by 0.9%.

All told, softness in the consumer sector was largely masked by spending on nondiscretionary items. The monthly retail trade data do not capture nondiscretionary spending as thoroughly as the national accounts; over the third quarter retail volumes were up just 0.1% q/q.

We know from earlier testing that consumer sentiment does not have a causal relationship with retail spending, but incomes do. Sentiment is a symptom of weak income growth, rather than a forward indicator of spending behaviour. The Westpac consumer sentiment index fell to 99.7 in November, below the neutral 100 that indicates optimists equal pessimists. Overall, consumers have been downbeat through most of 2017, concerned about family finances and the economic outlook. At 2% y/y, income growth is hovering near a record low, so it’s little surprise households have pulled
back on discretionary purchases, while other costs such as utilities rose in the third quarter because of seasonal price hikes. The net household saving ratio rose to 3.2% in the third quarter, higher than the decade low of 3% in the June quarter, suggesting that consumers aren’t willing to keep dipping into their savings to fund discretionary purchases. It’s concerning that household consumption is weak, given that it constitutes 75% of GDP.

Businesses are faring better than consumers at the moment. This is reflected in soaring private investment, lofty gains in company profits, and strong employment growth, particularly full-time, through 2017. Unfortunately, this has not yet flowed through to stronger income growth, and there are likely several factors at play. The first is cyclical: Low productivity is mooted as a reason for benign wages in the developed world. More Australia-specific is that underemployment has been very high in
Australia and the correlation with income growth is around -0.88. Underemployment has started to edge lower as full-time positions outpace part-time, and our baseline scenario is for the tighter labour market to yield stronger income growth by mid-2018. Although Australia’s Phillips curve has flattened in the past decade, there is still a reasonable relationship between unemployment and income growth.

Some structural factors: The rise of the gig economy has contributed to the rise in casual employment. These positions are more flexible and more easily adapt to changing demand, but there’s no union representation, which can hurt wage bargaining. Also, as the positions are more flexible, there’s more acceptance that lower wages can be a consequence.

Another structural reason for low incomes could be the higher prevalence of offshoring roles. There’s no reliable industry- or economy-wide data measuring the extent of offshoring, but we know that it is an unrelenting phenomenon, given the disparity in operating costs between Australia and the developed world. Employers are not locally replacing jobs lost offshore, so they are not potentially driving up labour costs to secure the appropriate candidate.

All told, these structural factors suggest that national income growth is unlikely to enjoy a significant rebound but rather gradual and modest improvement in 2018.

How’s the fourth quarter tracking?

Our high-frequency GDP tracker suggests a 2.7% y/y expansion in the December quarter following the barrage of October activity data this week. Retail trade came in at a strong 0.5% m/m, although this was payback for sustained weakness through the third quarter, when retail turnover fell an average 0.3% m/m.

October foreign trade data weren’t inspiring, as merchandise exports fell by 2% m/m amid lower iron ore prices and, to a lesser extent, volumes. The iron ore spot price increased by 22% from its late-October slump to US$71.51 per metric tonne in early December. We expect this will enable iron ore export receipts to improve heading into 2018 as higher global prices are incorporated into contracts; usually the lag is short. It’s too early to determine whether volumes will be adversely affected by higher prices.

We maintain our view that monetary tightening is firmly off the table for at least another year as the central bank sits on the sidelines waiting for consumption to show meaningful signs of a pickup. Our expectation is that the Australian dollar will depreciate around an additional 3% against the U.S. dollar over the next six months, serving to encourage more  consumption onshore and lift export competitiveness and helping core inflation return to and creep through the central bank’s 2% to 3%
target range.

Wages Growth, Under The Skin, Is Concerning

The Treasury published a 66-page report late on Friday – “Analysis of Wage Growth“.

It paints a gloomy story, wage growth is low, across all regions and sectors of the economy, subdued wage growth has been experienced by the majority of employees, regardless of income or occupation, and this mirrors similar developments in other developed western economies. Whilst the underlying causes are far from clear, it looks like a set of structural issues are driving this outcome, which means we probably cannot expect a return to “more normal” conditions anytime some. This despite Treasury forecasts of higher wage growth later (in line with many other countries).

We think this has profound implications for economic growth, tax take, household finances and even mortgage underwriting standards, which all need to be adjusted to this low income growth world.

Here are some of the salient points from the report:

On a variety of measures, wage growth is low. Regional mining areas have experienced faster wage growth, but wage growth has slowed in both mining and non-mining regions. Wage growth has been fairly similar across capital cities and regional areas, although the level of wages is higher in the capital cities.

The key driver of wage growth over the long-term is productivity and inflation expectations. This means that real wage growth – wage growth relative to the increase in prices in the economy – reflects labour productivity growth. However, fluctuations across the business cycle can result in real wage growth diverging from productivity growth. There are two ways of measuring real wages. One is from the producer perspective and the other is from the consumer perspective. Producers are concerned with how their labour costs compare to the price of their outputs.

Consumers are concerned with how their wages compare with the cost of goods and services they purchase.

Generally, consumer and producer prices would be expected to grow together in the long-term, so the real producer wage and real consumer wage would also grow together. Consumer and producer prices diverged during the mining investment boom due to strong rises in commodity export prices. The unwinding of the mining investment boom and spare capacity in the labour market are important cyclical factors that are currently weighing on wage growth.

It is unclear whether these cyclical factors can explain all of the weakness in wage growth. Many advanced economies are also experiencing subdued wage growth. In particular, labour productivity growth has slowed in many economies. However, weaker labour productivity growth seems unlikely to be a cause of the current period of slow wage growth in Australia. Over the past five years, labour productivity in Australia has grown at around its 30-year average annual growth rate.

Wage growth is weaker than the unemployment rate implies. There may be more spare capacity than implied by the employment rate. [Is The Phillips curve broken?]. Labour market flexibility is a possible explanation for the change in the relationship between wage growth and unemployment, and the rise in the underemployment rate. Employers may be increasingly able to reduce hours of work, rather than reducing the number of employees when faced with adverse conditions. This may be reflected in elevated underemployment.

It is difficult to draw firm conclusions on the effect of structural factors on wage growth, given they have been occurring over a long timeframe and global low-wage growth is a more recent phenomenon. Three key trends are the increasing rates of part-time employment, growth in employment in the services industries, and a gradual decline in the share of routine jobs, both manual and cognitive, and a corresponding rise in non-routine jobs.
Both cyclical and structural factors can affect growth in real producer wages and labour productivity, so such factors can also affect the labour share of income. Changes in the labour share of income occur as a result of relative growth in the real producer wage and labour productivity. Since the early 1990s, the labour share of income has remained fairly stable. Nonetheless, different factors have placed both upward and downward pressure on the labour share of income.

An examination of wage growth by employee characteristics using the Household Income and Labour Dynamics in Australia (HILDA) survey and administrative taxation data suggests that recent subdued wage growth has been experienced by the majority of employees, regardless of income or occupation. Workers with a university education had higher wage growth than those with no post-school education over the period 2005-2010, but have since experienced lower wage growth than individuals with no post-school education.

An examination of wage growth by business characteristics using the Business Longitudinal Analysis Data Environment (BLADE) suggests that higher-productivity businesses pay higher real wages and employees at these businesses have also experienced higher real wage growth. Larger businesses (measured by turnover) tend to be more productive, pay higher real wages and have higher real wage growth. Capital per worker appears to be a key in differences in labour productivity and hence real wages between businesses, with more productive businesses having higher capital per worker.

Wage growth is low across all methods of pay setting. In recent years, increases in award wages have generally been larger than the overall increase in the Wage Price Index. At the same time, award reliance has increased in some industries while the coverage of collective agreements has fallen. There are a range of reasons for the decline in bargaining including the reclassification of some professions, the technical nature of bargaining, natural maturation of the system and award modernisation which has made compliance with the award system easier than before.

Increasing wages would make the Australian economy safer

From The Conversation.

Australian wages have again failed to meet expectations – rising by just 2% on an annual basis. This is bad not just for workers, but for the economy in general. Wages need to rise, especially for those on low to middle incomes.

Research shows that even a small increase in interest rates disproportionately harms borrowers who are on lower incomes, and especially those at the start of the debt repayment process.

The Bank of England recently raised interest rates for the first time in a decade. The US Federal Reserve and European Central Bank will eventually follow suit. And as interest rates rise across the developed world, Australia will also be forced to follow.

Around 29% of Australian households are “over-indebted”. As interest rates rise, many of these households will be unable to meet their mortgage repayments. An increase in mortgage defaults will hit banks’ balance sheets, and will spread through the financial system.

Increasing wages would not only ease some of this financial stress, but would also jolt inflation as these newly enriched workers buy themselves things. Rising inflation will erode some of the debt repayment the household sector faces over the coming years.

Warning signs

A study in Ireland (which has similar household debt levels to Australia) found that a 1-2% increase in interest rates leads to a 2-4% reduction in a typical borrower’s disposable income after debt repayments.

Households are considered “vulnerable” if their debt service ratio (the share of debt repayments to income) is over 30%. If you earn A$1,500 after taxes every week, but are barely making a A$850 mortgage repayment, you’re going to be in trouble if repayments rise to $A900.

Part of the reason for the increased household debt is that the “labour share” of the Australian economy has been declining.

In 1960, Australian workers took home 62% of the value of what they produced. Australian owners of capital got 38%. This split was similar in the rest of the developed world.

In 2018, workers will most likely take home less than 50% of the value of what they produce. The average drop in the labour share as a percentage of GDP since 1960 is 12% across the OECD.

Wages have been growing at less than 2% a year since 2014. This is despite the fact that unemployment is 5.5% and falling, which is around the level where we would expect to see wages rise because workers can command a premium in the market.

But the Australian labour market is also changing. Underemployment (workers who would like to work more hours) is a key problem in many households. Underemployment is relatively high among 15-24-year-olds and is projected to rise.

According to the Oxford Internet Institute’s online labour index, Australia is number three in the world for “gig economy” jobs, behind Britain and the United States. These jobs provide cash flow but no security. They also build up other vulnerabilities – many Uber drivers will be short on Super, for example.

As you can see from the previous chart, Australian corporations aren’t doing too badly even as the labour share declines. The chart shows the gross profits, compared to the last month of 2008 – pretty much the peak of the crisis. This comparison allows us to see the changes in profits before and after the crisis more clearly.

The raw data show the same pattern.

You can see clearly a drop after the global financial crisis hits, and then a very sharp recovery in 2015 and 2016. Gross operating surplus, our rough measure of the profits of the private sector, are more than 24% higher than they were in 2008. One important reason for the increase in profits is the lack of wage growth for households.

What should be done?

In the longer term the ratio of debt to income and assets will have to fall. This could happen via write-offs, sell-ons and bankruptcies, or via increases in incomes. But we don’t live in the longer term.

Right now, middle-income workers need more cash in their pockets. There are a couple of options available.

The first is to reduce the burden of debt repayment on those new entrants to the mortgage market. One solution is to provide tax relief on the interest that a household pays in the first few years of a mortgage (as Ireland and the United Kingdom do). This will keep the property market working well and support younger borrowers, if only temporarily. But it could also bid up house prices if not properly targeted.

The second is the simplest approach – reduce taxes, combined with tax reform. But the federal government is already running a budget deficit of around 2% of GDP, so this doesn’t work in the short term.

The third option is to reduce the cost of living by making public transport easier to access, improving early education, and reducing energy prices. But research shows that the “worst” infrastructure projects are the ones that generally get built, so this isn’t advisable either.

The solution, then, is to increase wages, especially at the middle of the income distribution. Minimum wages have already gone up by more than 3% this year, but this is unlikely to help those on middle incomes, who have access to enough credit to afford current house prices and so have become stretched.

There are models Australia can learn from internationally. In Germany, the Variable Payment System links pay increases to profit sharing and bonuses. When the company or the sector does well, the worker does well. The reverse is also true.

A survey of 23 different wage-increasing mechanisms found almost all countries bar the US, Hungary and Poland have some collective bargaining and minimum wages. These range from hard wage indexation enforced by law, to intra-associational coordination (roughly what we have here in Australia). The right model for the 21st century and the changing nature of work may be very different, however.

As we’ve seen, private sector is doing very well and can afford a wage hike. And productivity increases in the Australian workforce has long outpaced wage increases. A wage increase is not only feasible and justified, it is in the national interest.

Wages Growth Stalls Again

The seasonally adjusted Wage Price Index (WPI) rose 0.5 per cent in the September quarter 2017 and 2.0 per cent over the year, according to figures released today by the Australian Bureau of Statistics (ABS). This was below consensus expectation, and continues the slow grind in household income, for many falling below the costs of living.  Those in the public sector continue to do better than those in the private sector.

The WPI, seasonally adjusted, has recorded quarterly wages growth in the range of 0.4 to 0.6 per cent for the last 13 quarters (from the June quarter 2014).

ABS Chief Economist Bruce Hockman said: “Annual wages growth increased marginally to 2.0 per cent in the September quarter 2017. The higher wage growth in the September quarter was driven by enterprise agreement increases, end of financial year wage reviews and the Fair Work Commission’s annual minimum wage review.”

Seasonally adjusted, private sector wages rose 1.9 per cent and public sector wages grew 2.4 per cent through the year to the September quarter 2017.

In original terms, through the year wage growth to the September quarter 2017 ranged from 1.2 per cent for the Mining industry to 2.7 per cent for Health care and social assistance and Arts and recreation services.

Western Australia recorded the lowest through the year wage growth of 1.3 per cent and Victoria, Queensland and Tasmania the highest of 2.2 per cent.

Even the PM is warning of low wage growth

From The New Daily.

Prime Minister Malcolm Turnbull has blamed low wage growth for the worst monthly drop in consumer spending since 2010.

Retail turnover in August declined for a second month in a row, according to official data released on Thursday, with the -0.6 per cent drop in trade the worst monthly performance in more than four years – putting economic growth at risk.

“While we’re seeing strong growth in employment, we’re yet to see stronger growth in wages so people feel as though they’re not getting ahead,” Mr Turnbull told Neil Mitchell on 3AW radio on Friday.

“That’s why economic growth is so important.”

The Prime Minister said wages would naturally rise as unemployment falls. “It’s supply and demand. Phil Lowe, the Governor of the Reserve Bank, was making this point just the other day,” he said.

Mr Turnbull also blamed higher energy bills, while some economists pointed the finger of blame at rising household debt and cooling house prices.

August retail trade slumped the most at ‘Newspaper and book retailing’, down -2.3 per cent; ‘Cafes, restaurants and catering services’, down -1.8 per cent; and at ‘Electrical and electronic goods retailing’, down -1.6 per cent.

Nowhere in Australia escaped, with retail sales falling in every state and territory, with New South Wales, Victoria and the ACT tied for worst performance at -0.8 per cent.

retail turnover
It was the worst month-on-month result, in seasonally adjusted terms, in four years. Source: ABS

The link between low wage growth, low spending and low economic growth has been a growing area of concern in recent months.

Commonwealth Bank CEO Ian Narev said in a speech on Friday that wage growth was the “No.1 metric” that policymakers should be concerned about.

The reason experts are so concerned is that any drop in consumer spending from cash-poor workers could have big consequences for economic growth, as household consumption currently accounts for roughly 57 per cent of Australia’s economic growth.

The full impact of the August slump will be seen when the September quarter GDP figures are released. In the GDP figures for the June quarter, the share of economic growth flowing to wage earners fell to 51.3 per cent in trend terms, the lowest since 1964, while the profit share soared to 27.3 per cent, the highest since 2012.

Dr Richard Holden, an economist at the University of New South Wales, has previously warned The New Daily that a drop in consumer spending “goes round in a vicious cycle”.

“If you have more of a drop on consumer spending, you’re going to see a contraction on the business side. It flows straight into business investment and business expansion, and that has a multiplier effect,” Dr Holden said at the time.

Commonwealth Bank economist Gareth Aird has described the August retail report as a “shocker”.

“It’s not surprising to see such weak retail trade outcomes given household income growth is so soft. But two consecutive monthly falls look at odds with the recent strength in the labour market.”

Mr Aird also said mortgage interest payments are taking up a larger proportion of household income, acting as “a handbrake on consumer spending and the retail sector in general”.

The expected arrival of online giant Amazon, and the growth of online retail in general, is also putting pressure on retailers, he said.

Australian Retailers Association executive director Russell Zimmerman blamed increased energy costs, higher tax burdens and an inflexible wage system for the concerning result and called for government action to lift confidence.

JP Morgan economist Ben Jarman said further weakness in household consumption would put at risk the Reserve Bank’s forecasts for a return to economic growth of 3 per cent, from the current annual rate of 1.8 per cent.

“The consumption data challenge the RBA’s assertion that growth will move back above potential,” he said.

Labor leader Bill Shorten told a media conference on Friday that the misuse of labour hire contracts were a major contributing factor to Australia’s low wage growth.

How market forces and weakened institutions are keeping our wages low

From The Conversation.

Within the political class there is a low level moral panic about low wages growth. The irony is that those lamenting this situation are simply witnessing the ultimate outcome of policies they have long advocated.

While Australia still has systems like Industrial Tribunals and Awards – given how they interact with market forces today, these institutions now work to entrench wage inequality rather than reduce it.

Wage rates and movements are determined by a combination of market and institutional forces. Technology, human capital, levels of labour supply and the profitability of companies in laggard and leading set the lower and upper bounds for sustainable wage levels.

As economist and philosopher Adam Smith noted, the income workers require to survive sets what’s called a “market floor” for wages – the lowest acceptable limit. Rates of profit in the best performing firms set the upper limit, as Australia’s executive class has shown very clearly for over three decades now. What rates actually prevail within these very broad limits are determined by institutional forces – in Australia, the award system of minimum wages and unions collective bargaining rights.

Historically Australia has had the great benefit of having institutional arrangements that balanced these forces well. The key elements of this were a network of industrial tribunals that regularly assessed the overall economic and social situation and determined what rates and movements in pay were sustainable.

These rates were not set unilaterally, but in coordination with what employers and organised workers indicated was possible, in industry level collective agreements.

The defacto rule was that wage movements should equate to movements in productivity plus the cost of living. The standards set in the leading profitable sectors then spread to the entire workforce through the maintenance of award relativities (ie standard comparative rates of pay set by reference to benchmark occupations like metal fitter, carpenter and truck driver). During this time awards rates approximated pretty closely to going rates of pay.

These underlying principles were not unique to Australia. In the era following the second world war it meant that in most countries workers shared in productivity growth and wages tracked pretty closely with it.

Since the mid 1970s and especially since the 1980s all this has changed.

Australia has not seen anything like full employment since the early 1970s. While unemployment has been cyclical, it has usually been 5% or more since that time. More importantly, underemployment has been on the rise.

This has not been cyclical. It has racketed up after each recession.

And that is just in terms of hours worked. If we took into account workers with skills not being used, levels of labour underutilisation are much higher. Estimates of underutilisation of this nature vary as being between 15 and 25%.

High levels of indebtedness also weaken workers bargaining power. Today few can hold out for long bargaining periods – either individually or collectively. This gives employers a huge advantage in setting wages.

The legacy of labour market ‘reform’

In the 1970s and 1980s Australia’s wage setting institutions worked well to protect wage rates against the full force of these downward pressures. Since the early 1990s, however, those institutions have been transformed.

The key issue here has not just been the weakening of unions and their bargaining power. Just as significant has been the uncoupling of wage rates set by wage leaders, from the wages of the weak. Workers in benchmark setting sectors like construction used to establish wage norms. These were recognised by industrial tribunals as a community standard which they then passed on to workers in weaker sectors like retail through generalised award wage base rises. In this way the wages of the strong supported movement in the wages of the weak.

This was a key “reform” of the Keating government, introduced with the active support of the ACTU. It was explicitly designed to let wages of the strong grow faster than the wages of the weak to maintain macroeconomic balance as the wages system decentralised.

The Howard governments’ labour law changes – first the Workplace Relations Act (1996) and then Workchoices (2006) – merely extended the logic of this reform trajectory. The current Fair Work Act merely codifies this trajectory as the law of the land today.

Today Austraila’s minimum wages remain among the highest in the world. The difference is they operate in relative isolation from the rest of the workforce.

Until the 1990s they were part of an interconnected system that ensured wages gains of the strong were widely shared. Today they provide the ultimate safety for those with the weakest levels of bargaining power – currently about 15% of the workforce directly and a further 15% indirectly.

We should also not forget the new found role of Treasury departments. Immediately after its election, the O’Farrell government in NSW legislated to cap wage rises in the NSW public sector to no more than 2.5% per annum.

Pubic sector teachers and nurses, especially in NSW, were emerging at the new wage leaders. This meant that their wages were now capped and this Treasury edict – and not collective bargaining and arbitration – set community wage norms.

Today our wages system has a different logic. The recent cut in penalty rates is a case of the wages of the weak putting pressure on the wages of the strong. While the Fair Work Commission quarantined the rest of the workforce from this cut by limiting its recent decision to low paid service workers – the precedent is there. Future movement in wage standards for anti-social hours will be down and not up.

Over the course of the twentieth century Australia devised a remarkable set of institutions to manage the complex problem of wages and labour standards. It’s time we built on what little remains of that legacy to remedy low wage growth.

Building on these institutions doesn’t mean restoring what was. New policies need to engage with new realities. Even former enthusiastic supporters for reducing labour standards and wages such as the IMF now recognise growth needs to be inclusive if it is to sustainable.

It’s much easier to destroy institutions that deliver fair pay than build them. Australia found ways of achieving fair pay over the course of the twentieth century – it can to so again.

Author: John Buchanan, Head of the Discipline of Business Analytics, University of Sydney Business School, University of Sydney

Income Growth Stagnant

The latest data from the ABS shows that income growth remains in the doldrums, putting more pressure on households who are experiencing rising costs (including mortgages), as our Household Finance Confidence Index shows. Given where inflation sits (1.9% on the official figures, but understated we think), many continue to go backwards. This also kills the Treasury budget assumptions. We do not see any reversal of this trend, despite recent positive business lending.

The seasonally adjusted Wage Price Index (WPI) rose 0.5 per cent in June quarter 2017 and 1.9 per cent over the year, according to figures released today by the Australian Bureau of Statistics (ABS).

The WPI, seasonally adjusted, has recorded quarterly wages growth in the range of 0.4 to 0.6 per cent for the last 12 quarters (from September quarter 2014).

ABS Chief Economist Bruce Hockman noted: “Low wages growth continued in the June quarter 2017, with annual wages growth continuing to hover around 2 per cent. This low wages growth reflects, in part, ongoing spare capacity in the labour market. Underemployment, in particular, is an indicator of labour market spare capacity and a key contributor to ongoing low wages growth.”

The annual trend is clear to see. Public servants are doing a little better than the private sector.

Seasonally adjusted, private sector wages rose 1.8 per cent and public sector wages grew 2.4 per cent through the year to June quarter 2017.

In original terms, through the year wage growth to the June quarter 2017 ranged from 1.1 per cent for the Mining industry to 2.6 per cent for Health care and social assistance industries.

Western Australia recorded the lowest through the year wage growth of 1.4 per cent and South Australia and Northern Territory the highest of 2.1 per cent.


Fair Work Commission to cut wages within four weeks

From The New Daily.

More than 600,000 low-wage workers in the services sector will suffer a wage cut on the first day of next month, after a judicial bench refused pleas to cancel or delay cuts to penalty rates.

In a decision handed down on Monday, the Fair Work Commission denied requests from unions for the wage cuts to be postponed for two years or, at the very least, for currently employed Australians to be quarantined from the cuts.

Instead, the Commission chose to stagger the cuts to Sunday loadings, which means workers will have their wages cut every year on July 1 until 2019 or 2020, depending on their industry.

The verdict applies to workers paid Award rates in the hospitality, fast food, retail and pharmacy sectors.

ACTU secretary Sally McManus urged Parliament to legislate against the “devastating” cuts.

“This can be stopped. Our Parliament can stop it. Malcolm Turnbull can stop it,” she told reporters.

“There is a bill before Parliament as we speak and it can be voted on in the next two weeks and bring a stop to these penalty rate cuts.

“These cuts are devastating. It’s $70 a week in total on average for workers. These are the lowest paid workers in our community.”

Employer groups had urged the Commission to not phase in penalty rate cuts at all, arguing this would boost employment sooner.

The Commission dismissed this argument by acknowledging it was “cautious” about any boost to employment flowing from lower rates of pay. Instead, it argued that workers would benefit from “an increase in overall hours worked”.

However, it did decide to impose the public holiday penalty cuts all at once, from July 1, 2017.

Ms McManus disagreed, telling The New Daily that workers would end up “working longer for less pay”.

From July 1, Sunday penalty rates will be cut by 5 percentage points across the four sectors for full- and part-time workers, bringing penalty rates to 145 per cent for fast food; 195 per cent for pharmacy and retail; and 170 per cent for hospitality.

The McKell Institute, commissioned by the ACTU, has calculated, based on 2011 census data, that if the Sunday penalty rate cuts had been implemented in full on July 1, roughly 621,000 workers would have lost $1.4 billion in disposable income a year, with rural and regional areas the worst hit.

Some, such as Warren Entsch, Liberal MP for the worst affected electorate of Leichardt, have dismissed these numbers as exaggerated.

But even if the disposable income and affected worker numbers were overstated by the McKell Institute’s methodology, it would not affect the rankings. Rural and regional workers would remain the worst hit.

penalty rates electorates

The Australian Industry Group said the Commission’s decision was “fair”, but that it would have preferred for the cuts to be implemented straight away, not phased in.

Rob Mitchell, Labor MP for Australia’s second-worst affected electorate, told The New Daily that penalty rates are important because weekend workers “are missing out on what we value in Australia”.

“I know from my experience when I was with the RACV, having to work on Christmas Day and doing weekend work on both day shifts and night shifts, how this had a big impact on family life and the loss of participation in special family occasions,” Mr Mitchell said.

“This cut attacks the young, it attacks the vulnerable. The FWC does its work, and in this case it got it wrong – very badly wrong.”

Mr Mitchell was especially concerned about the impact of the cuts on consumer spending.

“For many in our communities, these cuts will mean that people have less discretionary spend. If they’ve got less discretionary spend, they’re going to be tightening things up, they won’t be going to restaurants or to the shops, so you could actually see a contraction in small town economies.”

How the changes will be phased in: