We look at the ructions on the financial markets today. What does it mean?
 Blog")
/
RSS Feed
Digital Finance Analytics (DFA) Blog
"Intelligent Insight"

We look at the ructions on the financial markets today. What does it mean?
We look at the ructions on the financial markets today. What does it mean?
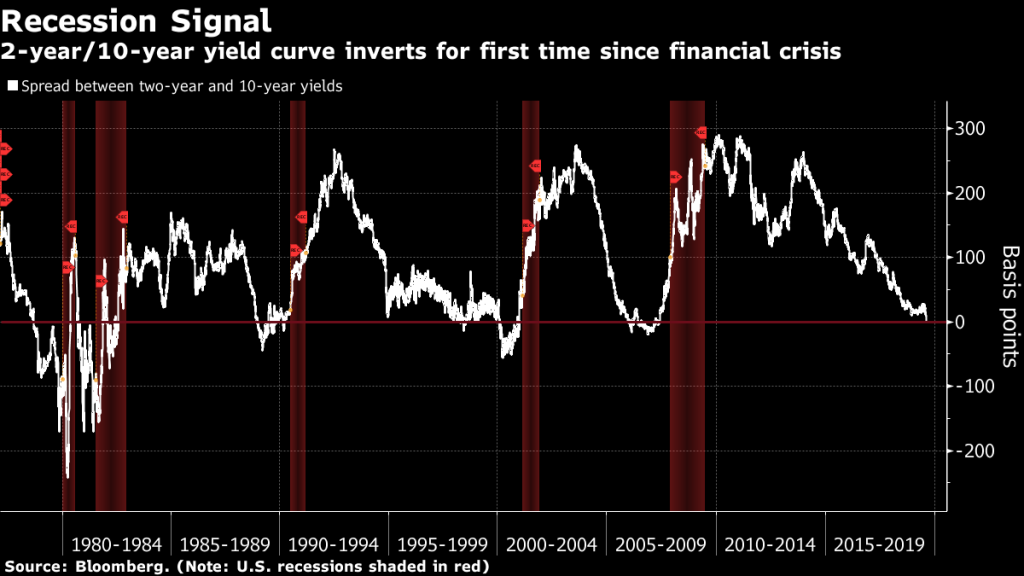
Today we consider whether the shape of the yield curve is a good indicator of a future recession in the US.
 To answer that question, let’s look at the longer term trends, using data from one of our favourite data sources FRED. FRED is the St. Louis Fed datasets, which contains a wide range of useful indices.
Here is plot of the 10 year rates since 1980. The shaded areas are US recessions, when the economy shrank (generally seen as a negative indicator), certainly unemployment rose as is clearly evident as a direct result of the recession.
But now let’s look at the 10-year rate from the 1980’s, and overlay the 3-month rate also. In the video we follow the inflection points, and here is the thing. Prior to each of the last three US recessions, the short-term rate overtook the long term rate in a classic inversion of the yield curve. And we see recessions follow.
The logic behind the inverted yield curve as a recession indicator is simple: if long-term yields are lower than short-term yields, the market’s view is that growth will slow in the coming years. More often than not, that view has been right.
From this, we can say there is clear evidence that once the yield curve does reverse, a recession will likely follow. But what does that tell us about the current situation? Well currently short term rates have been rising sharply, more so than long term rates, as the Fed draws in their QE horns. If that trend continues, the yield curve will go negative, and in that case a US recession is highly likely. And on current trajectory that could happen within a couple of years.
However, beware, because there were cases when the US yield curve inverted but a recession did not follow. For example, in the late 1980s, the yield curve inverted and then steepened again, before inverting again later on before a recession hit. The curve also inverted very briefly in the late 1990s, too, and again in 2005-2006. However, the trends to my mind do signal a recession, but the timing does vary. Sometimes it happens in just a few months, in other cases it’s taken a year or two. But it does look like a yield inversion is an important signal to watch for, worth bearing in mind when people are taking about all the reasons why the stock market in the US should go higher still.