
Both the RBA and APRA released their respective credit aggregates to end August today. And its not running to script, despite the rate cuts, some stronger buying signs in some housing markets (but on low, low volumes), and increased competition for loans. Overall credit growth rates continue to decline.
The RBA data over the rolling 12 months showed that credit growth dropped to 2.9%, compared with 4.5% just one year ago. That is the slowest rate of growth since 2011. It peaked in 2015 at 6.6%.
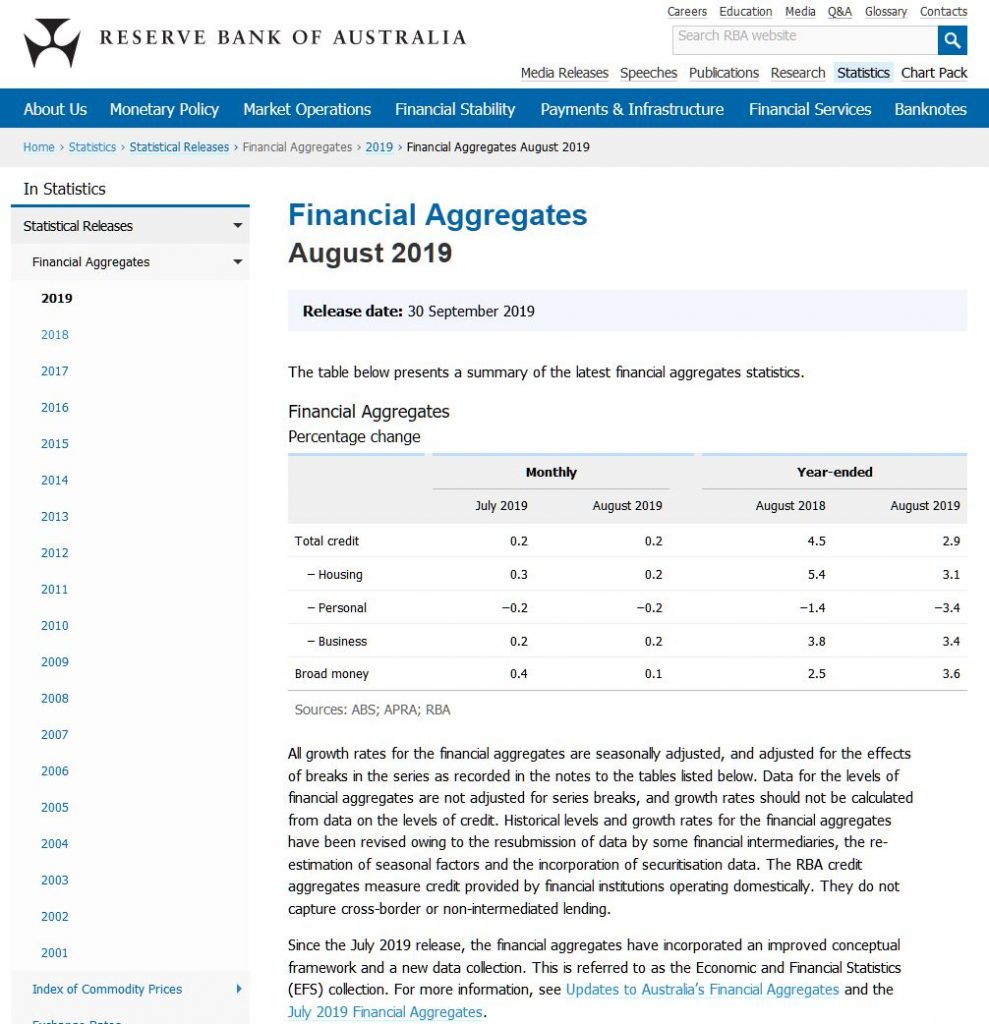
Housing sector growth rose 3.1% over 12 months, compared with 5.4% a year back and from a high of 7.4% back in 2015. Within that owner occupied lending fell to 4.7%, compared with 9.1% back in 2016, and investment lending rose at just 0.1% over 12 months, compared with 10.8% back in May 2015.
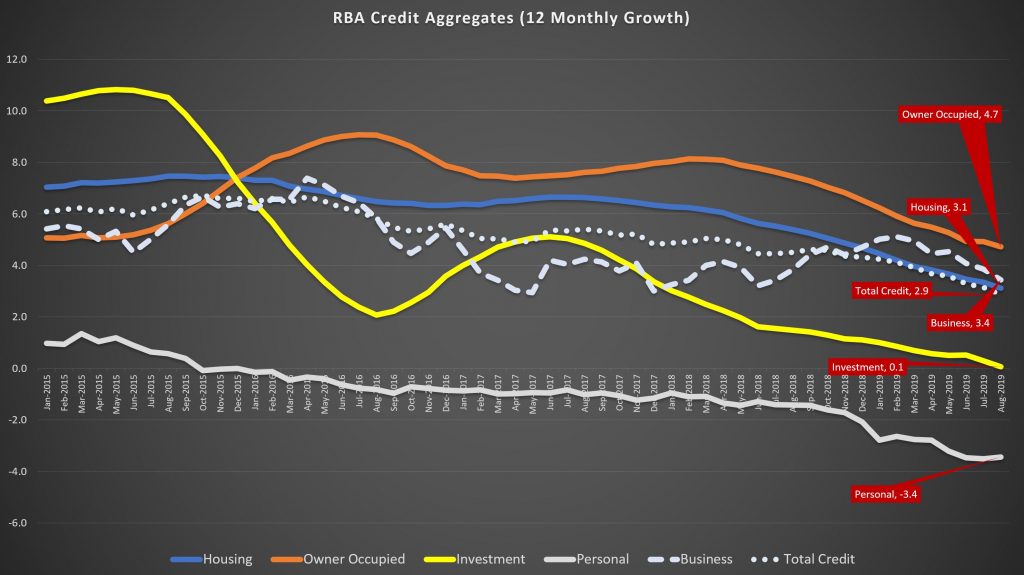
Business credit growth eased back to 3.4% annualised, from 3.8% a year ago, and 7.4% back in 2016, reflecting weaker business confidence and concerns about the local and international economic outlook.
Annual personal credit is down 3.4%, compared with down 1.4% a year ago, and up 0.3% in 2015.
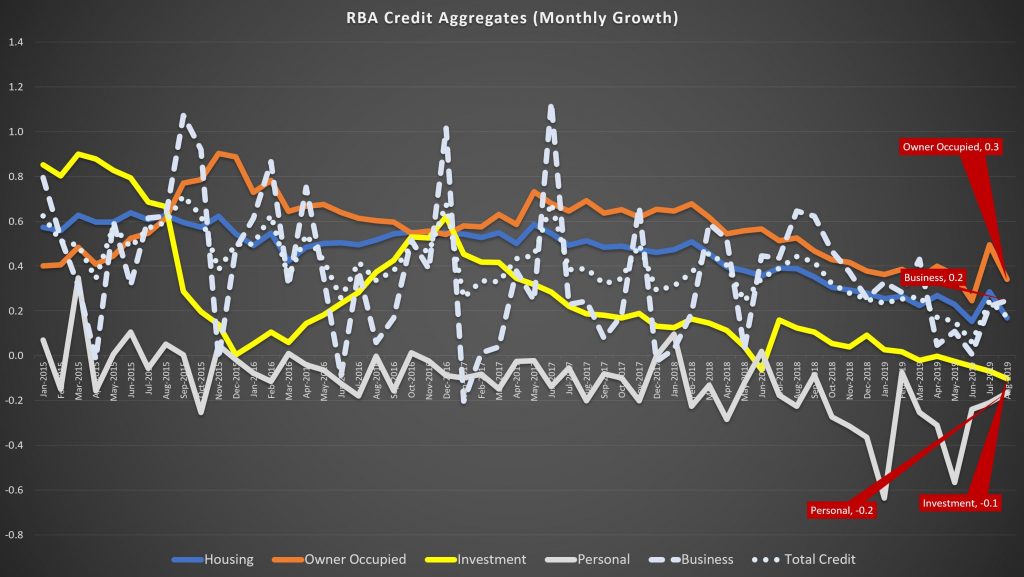
The more noisy one month series shows that owner occupied lending rose 0.3%, compared with 0.9% in 2015, investment lending fell 0.1%, compared with a rise of 0.9% in 2015, business credit rose 0.2%, way lower than peaks of more than 1% in 2015 and 2017, and personal credit fell 0.2% again.
Note the RBA makes seasonal adjustments to the data – though they do not disclose the basis of these adjustment, and this year has been far from typical.
They also say:
Historical levels and growth rates for the financial aggregates have been revised owing to the resubmission of data by some financial intermediaries, the re-estimation of seasonal factors and the incorporation of securitisation data. The RBA credit aggregates measure credit provided by financial institutions operating domestically. They do not capture cross-border or non-intermediated lending.
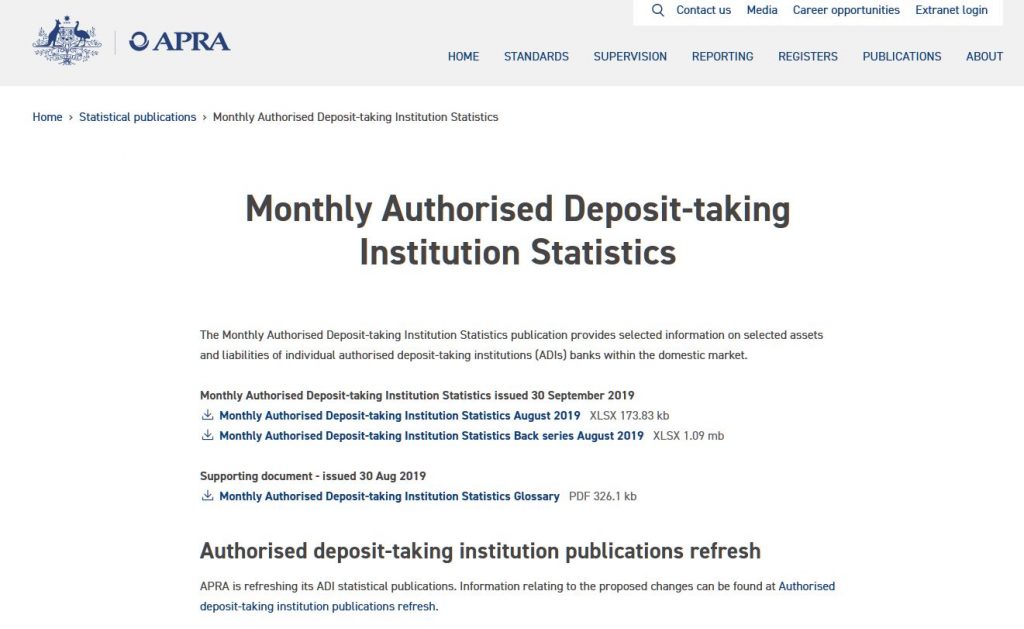
So more data noise. And talking of that the new APRA data is all over the shop. They started running a parallel series in March, and as we discussed last month, the proportion of investment loans in the stock data have risen.
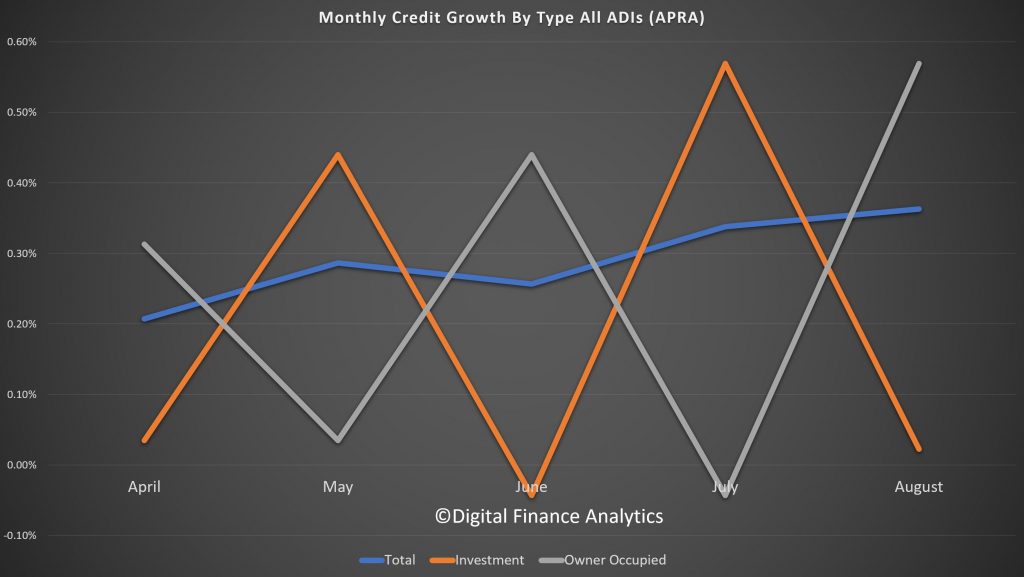
Overall credit stock of housing loans for the ADI’s is running at 0.36% and appears to be rising since April. However, the swings between growth in investor and owner occupied loans are massive, (and in opposite directions). This is not a sign of good data collection in my view.
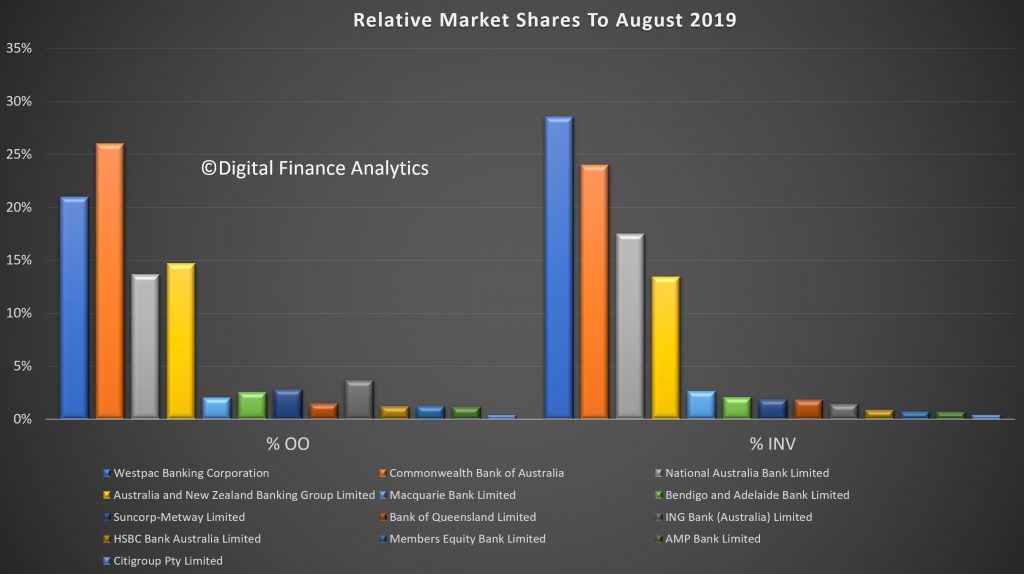
The overall portfolio market shares indicate that CBA remains the largest lender for owner occupied loans, with a 26.1% share, followed by Westpac 21%, and ANZ at 14.7%. In investment lending, Westpac remains a clear leader, with 28.6% of all lending, followed by CBA at 24% and NAB at 17.5%.
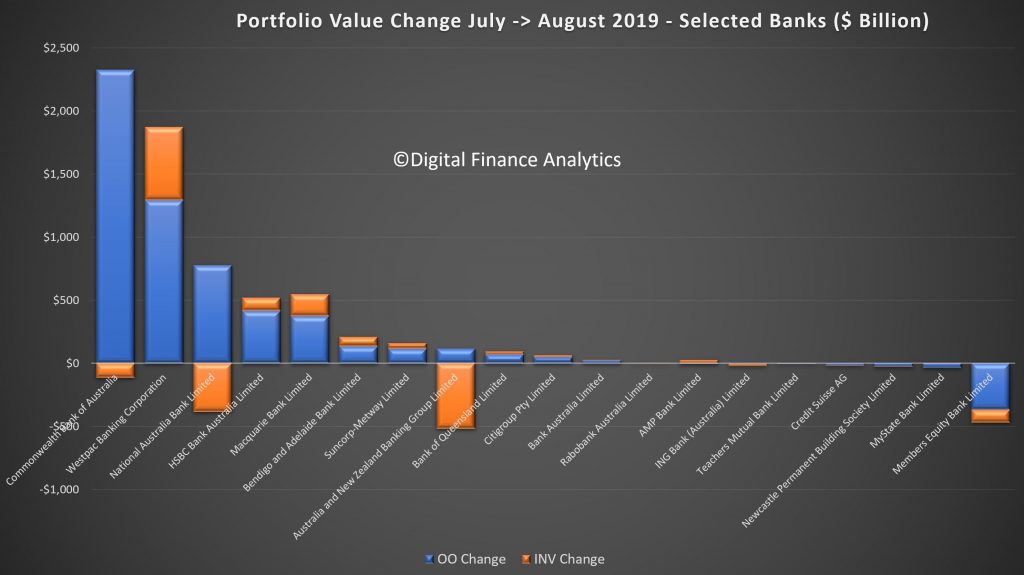
The monthly movements tells an interesting story, with CBA driving the largest growth in owner occupied loans (2.3 billion), while dropping investment loans by a small amount. Westpac extended its investment loans by $0.6 billion, and owner occupied loans by $1.3 billion. NAB and ANZ both lost investor share and ME Bank lost owner occupied and investor loans. Other lenders picked some of these up.
Finally, our analysis of the proportion of individual bank portfolios in investment loans (generally more risky in a down-turn), shows that 44.9% of Westpac’s portfolio is investment lending (worth $185 billion), compared with an ADI market average of 37.4%. NAB is at 43.4% and Macquarie at 43.7% and Bank of Queensland at 42.7%. On the other hand CBA is at 35.6% and ANZ at 35.3%.
Data from our surveys suggests weakening demand for credit, and if this eventuates, it is quite possible recent home prices will be confirmed as a bear trap. While some down traders and more affluent households are in the market, many other segments are sitting this one out.
Remember that falling credit growth will translate to falling home prices, the math is that simple. And more rate cuts won’t help much at all!