
The RBA and APRA both released their statistics today to end of October. The data clearly shows the mortgage flows are easing, which is a key indicator of weaker home prices ahead. Remember it is the RATE of credit growth, or the credit impulse we need to watch. Essentially, for home prices to rise, the rate of credit growth needs to accelerate, and the reverse is also true as can be clearly seen.
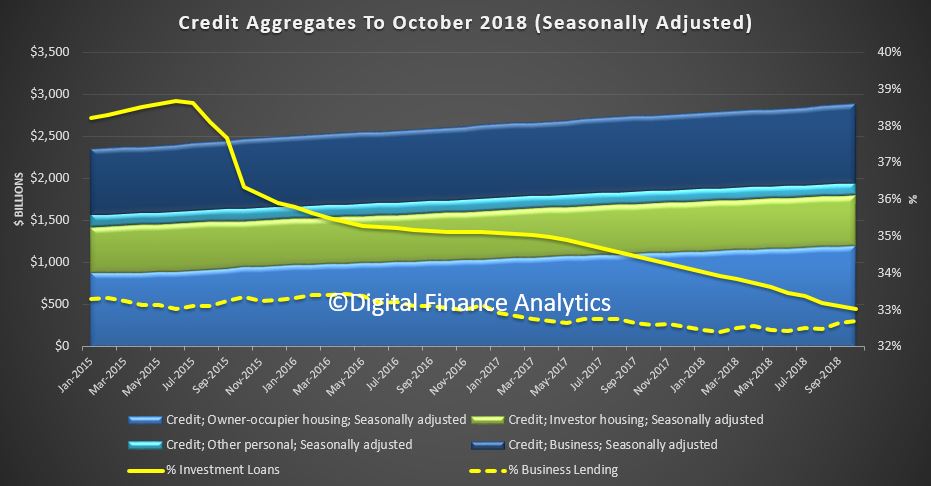
The RBA credit aggregates shows that overall credit rose by 0.4% last month, or 4.6% over the past year. Housing credit rose by 0.3% in October, or 5.1% over the past year. Business credit rose 4.7% over the past year and 0.6% in October. Personal credit fell 1.6% over the year, and broad money rose by 1.9%, compared with 6.8% last year – the credit impulse is easing!
Total housing lending rose by 0.28% to $1.78 trillion. Within that owner occupied lending rose 0.42% or $5 billion to $1.2 trillion while investment lending rose by just 0.1% to $593.6 billion. Investment loans fell to 33% of all loans, down from 38.6% in 2015.
Business lending was 32.7% of all lending, lower than 2015.
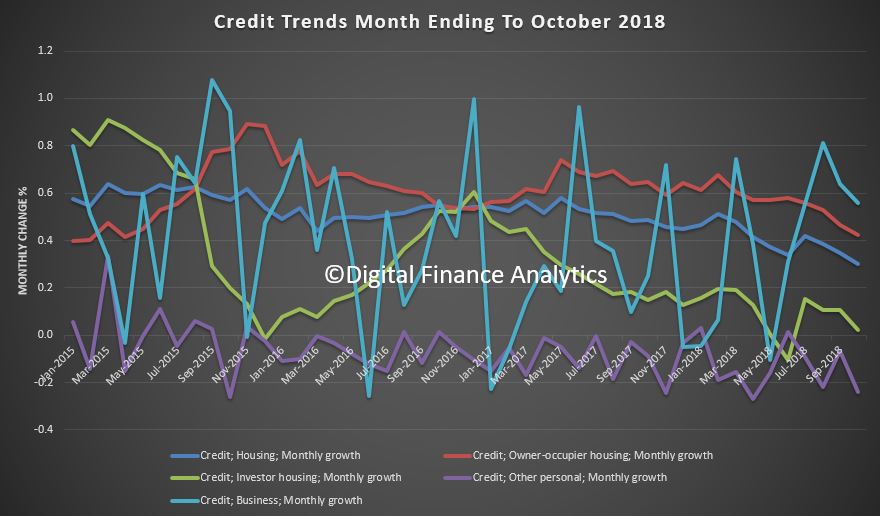
The monthly flows continue to show significant noise…
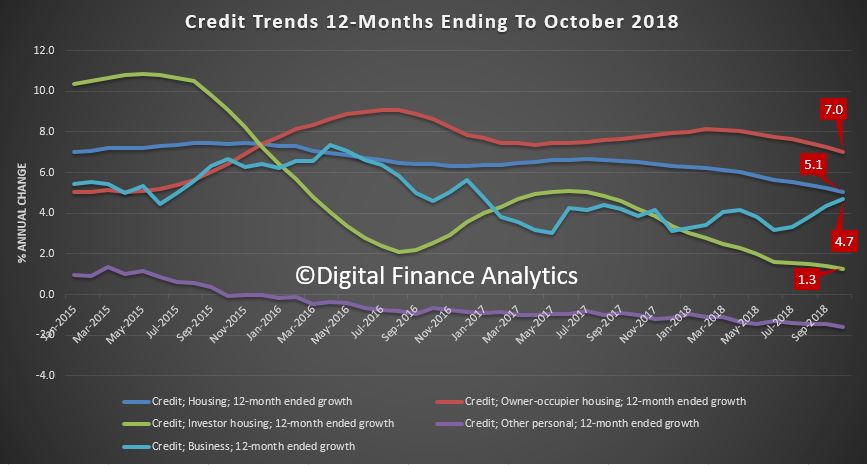
… but the annualised figures show the fall in housing lending across the board.
Turning to the APRA banking stats, we can look at individual lender portfolios. We see that Westpac and ANZ both reduced their investor loan portfolios between September and October, while NAB and CBA grew theirs.
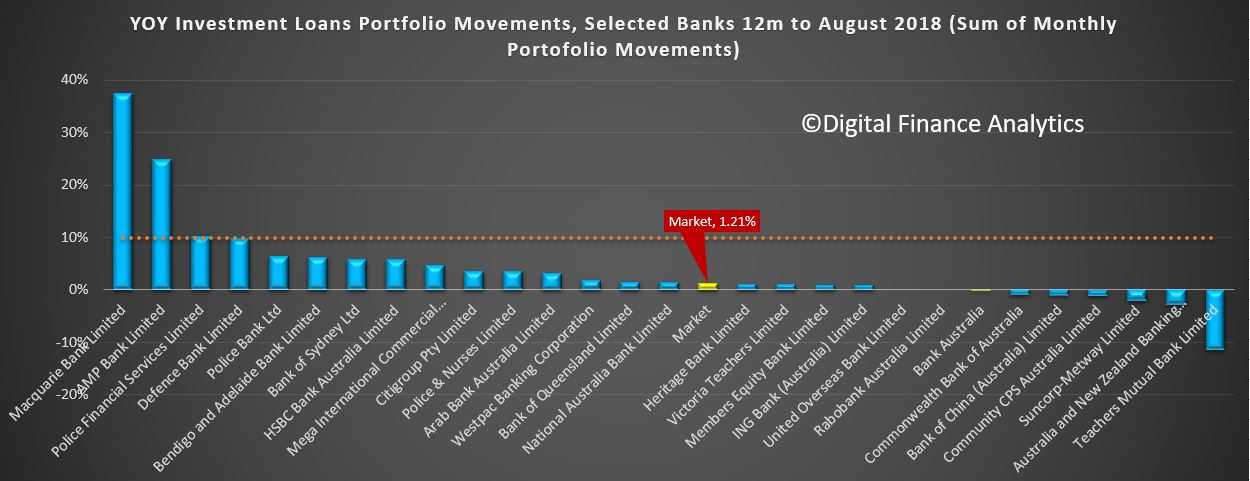
Macquarie Bank is still growing its investor pools (well above the now obsolete APRA 10% speed limit).
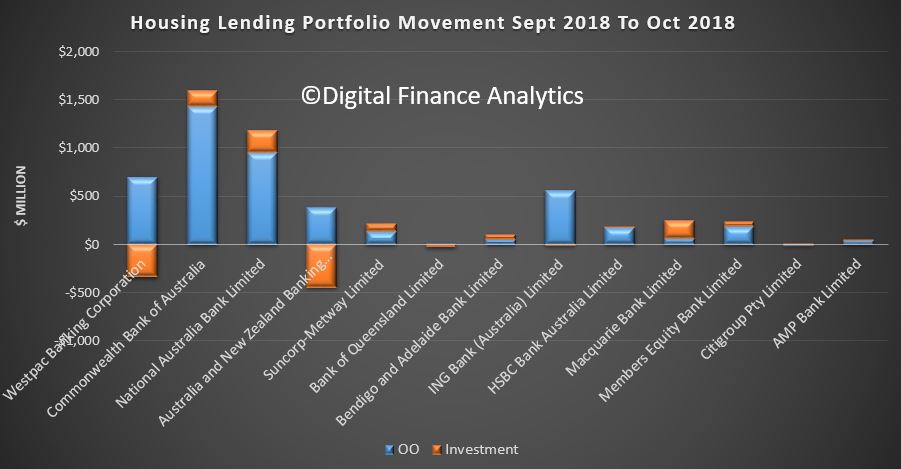
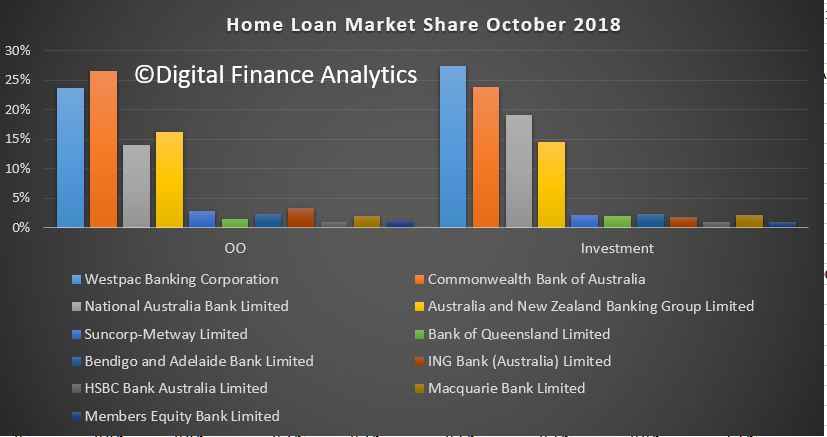
ADI portfolios hardly moved overall with CBA still the largest owner occupied lending, and Westpac the largest investment lender.
We can still plot the annualised movements of investor loans, and we see a small number of lenders well above the 10% speed limit (which was removed a few months ago). Significantly many lenders are well below that rate.
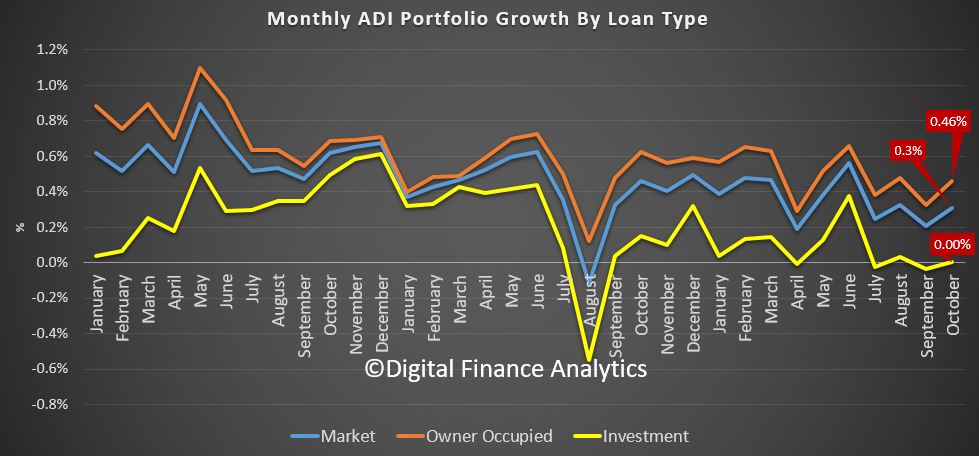
At an aggregate level, lending by ADIs was up 0.3% in the month, with investor loans flat, and owner occupied loans at 0.46%.
The proportion of investor loans fell again in stock terms to 33.6%.
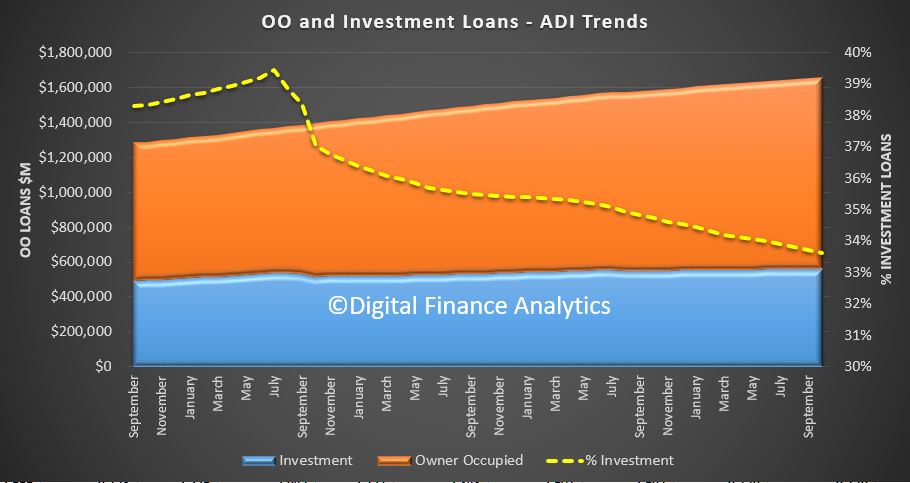
Total ADI lending rose to $1.66 trillion, up 0.3% of $5 billion. Owner occupied loans rose 0.46% to $1.1 trillion and investor loans rose 0.004% to $557.4 billion.
In fact some smaller banks, and non-banks are growing their portfolio faster than the majors, thus the rotation across the sectors continues.
We expect credit to continue to grow more slowly ahead, and this will lead home prices lower.