Digital Finance Analytics will be releasing the results from our rolling household surveys over the next few days. This is the first in the series.
These are the results from our 52,000 households looking at property buying propensity, price expectations and a range of other factors.
We use a segmented approach to the market for this analysis, and in our surveys place households in one of a number of potential segments.
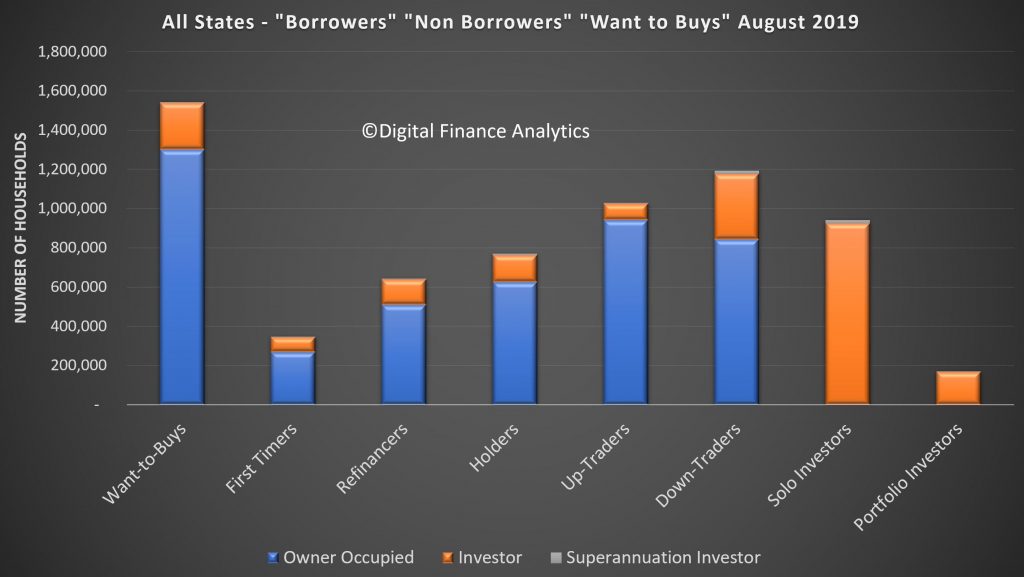
Want To Buys: households who would like to buy, but have no immediate path to to purchase. There are more than 1.5 million households currently in this group.
First Timers: first time buyers with active plans to purchase. There are around 350,000 households in this segment.
Up-Traders: households with plans to buy a larger property (and sell their current one to facilitate the up-sizing. There are around 1 million households in this group.
Down Traders: households wishing to sell and down size, sometimes buying a smaller property at the same time. There are around 1.2 million households in this group.
Some of these households will hold investment property as well. We categorise investors into one of two groups.
Solo Investors: households with one or two investment properties. There are about 940,000 of these.
Portfolio Investors: households with more than two investment properties. There are around 170,000 of these.
Finally we also identify those who are planning in refinance existing loans, but are not intending to buy or sell property – flagged as Refinancers, and those with no plans to buy, sell or refinance – flagged as Holders.
It is the interplay of all these segments which drives the property market and demand for mortgages.
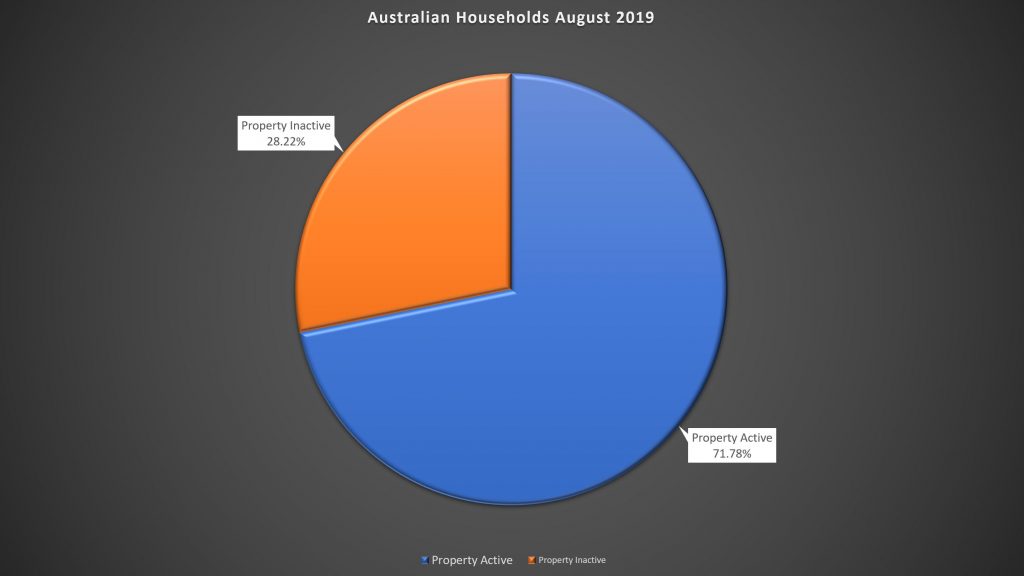
Around 72% of households are property active – meaning they want to buy, sell, or own property. More than 28% are property inactive, meaning they rent, live with parents or in other arrangements. Our surveys track all household cohorts. A greater proportion are falling into the inactive category.
Intention To Transact Is Rising (From A Low Base)
We ask about households intentions to transact in the next 12 months, and whether they will be buy-led (seeking to purchase a property first) or sell-led (seeking to sell a property first). (Click on Image To See Full Size).
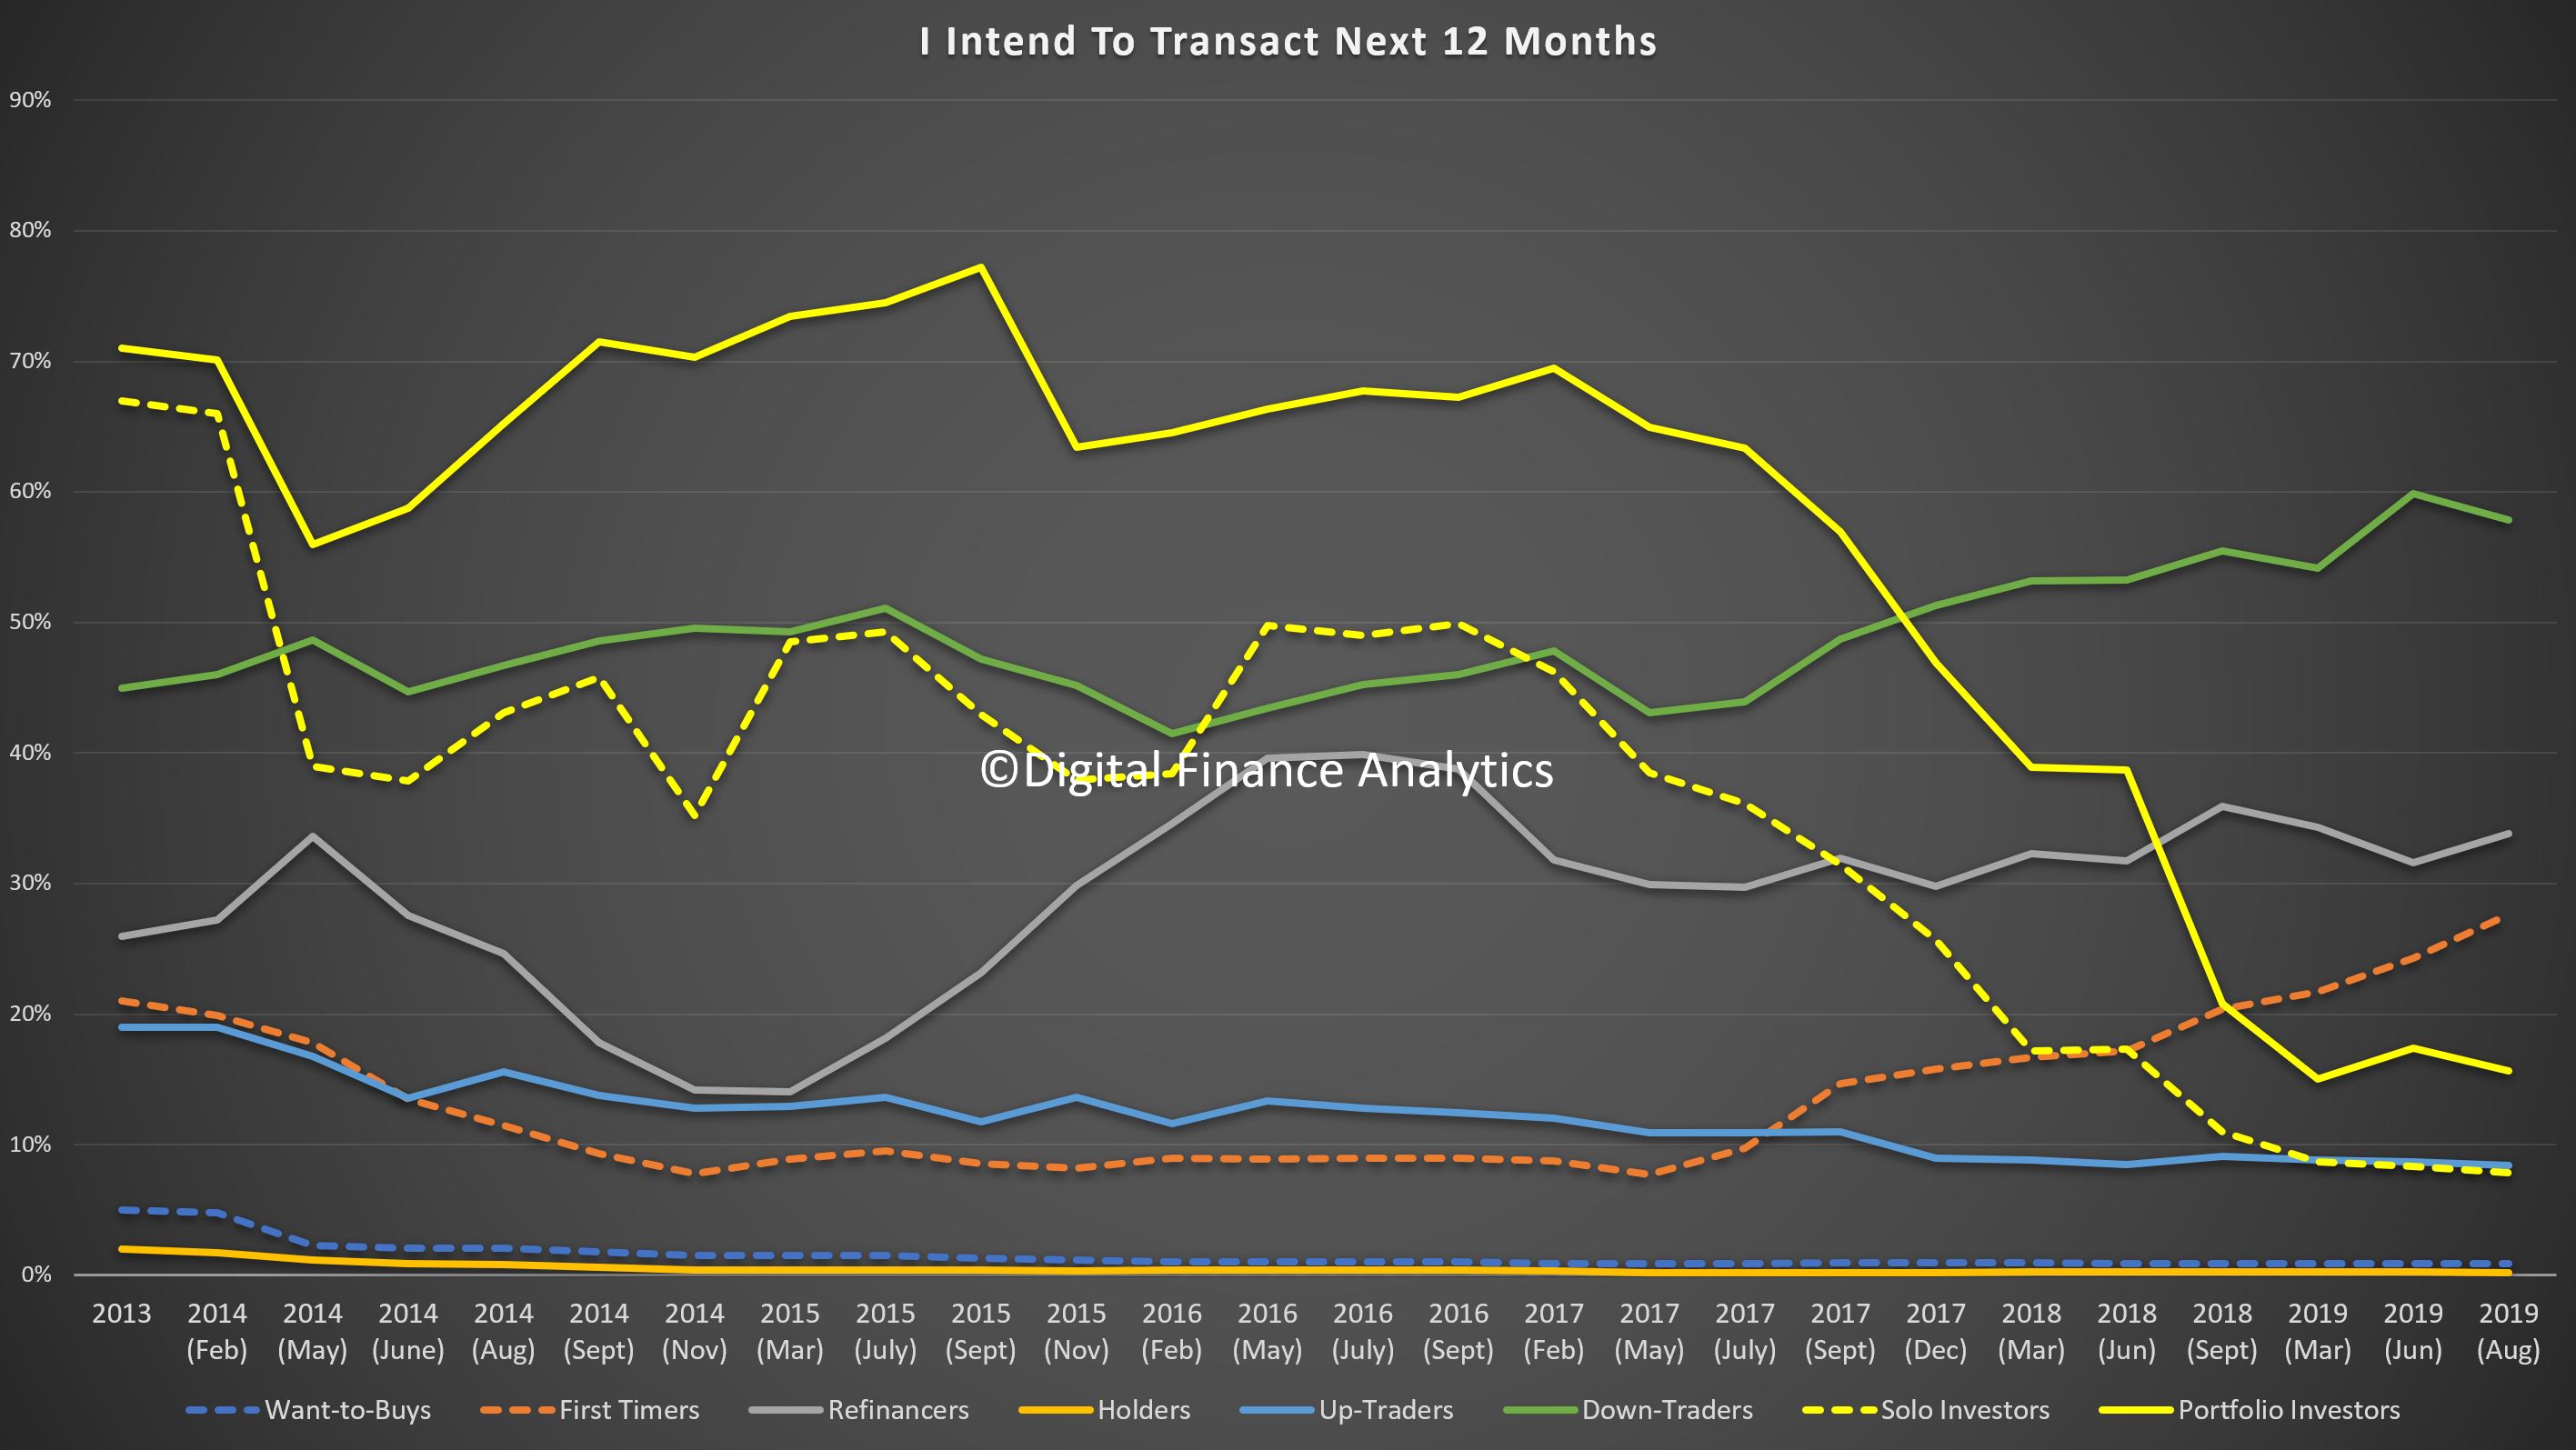
Property investors are still coy (hardly surprising given the fall in capital values, the switch to P&I loans and receding rentals. But Down Traders, First Time Buyers and Refinancers are showing more intent.
We will look at the drivers by segment in a later post.
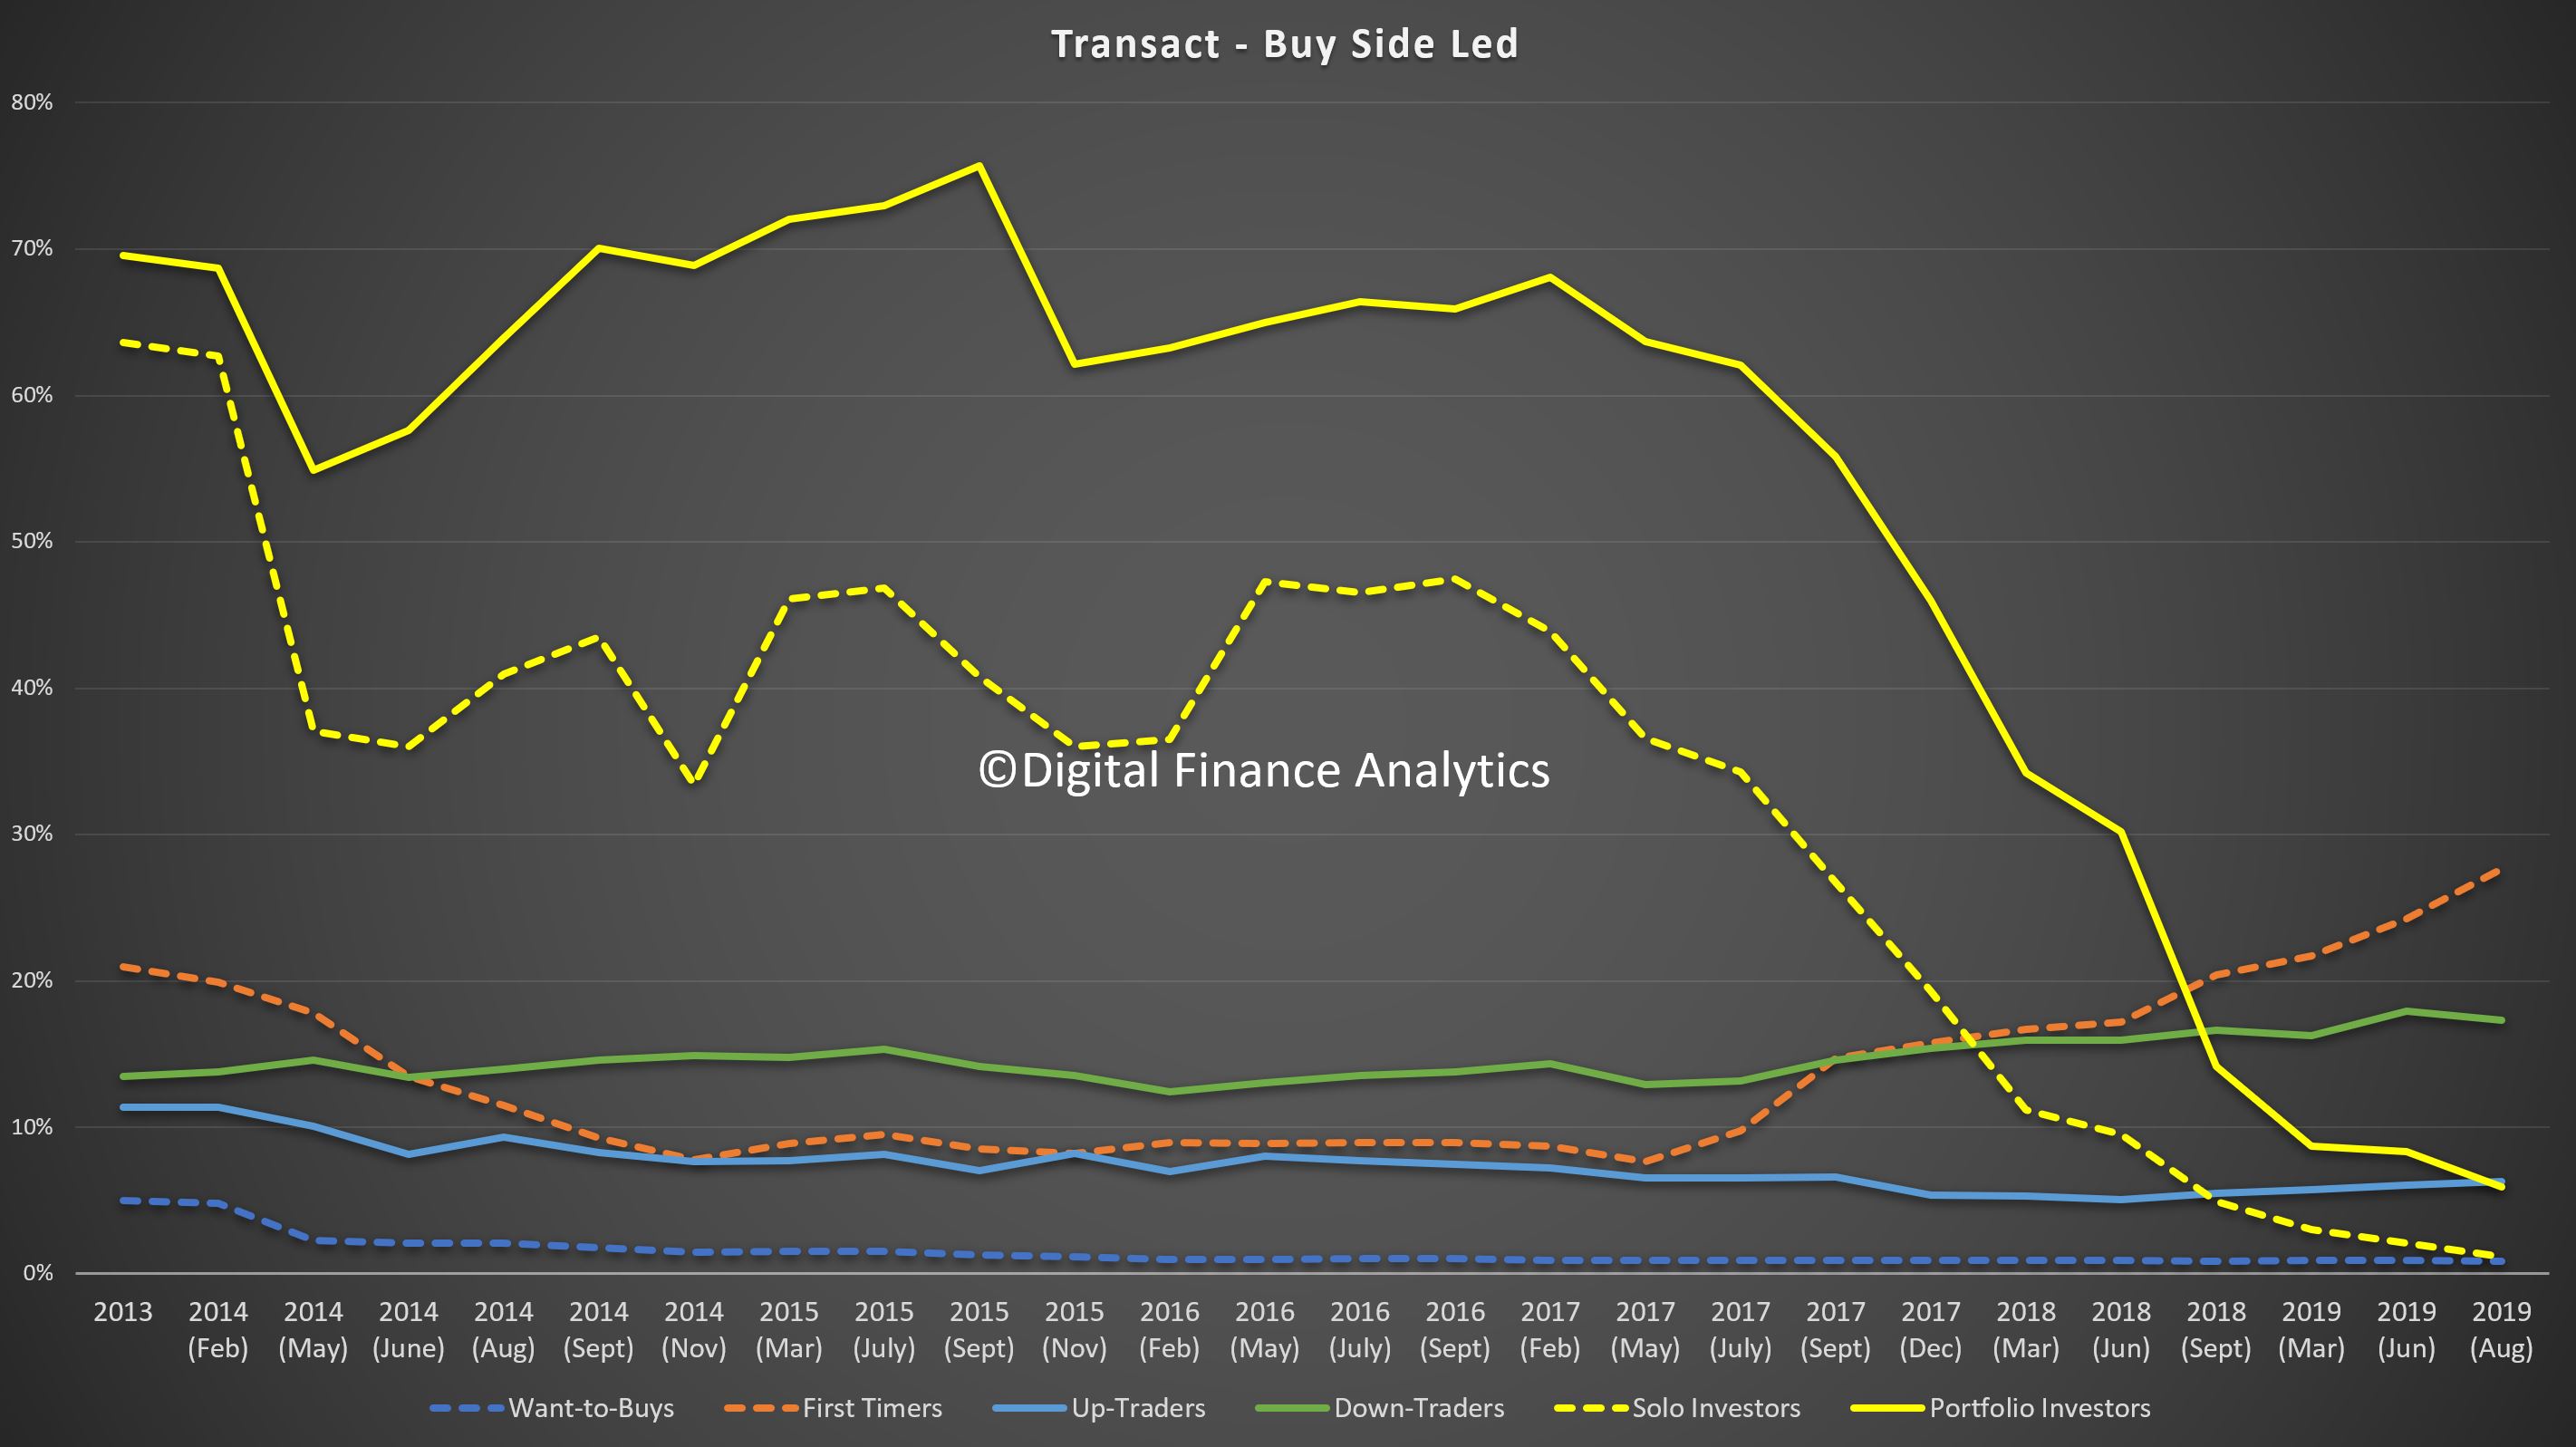
But the Buy Side and Sell Side Analysis is telling
Those seeking to buy are being led by First Time Buyers and Down Traders.
Those looking to sell are being led by the Down Traders, and Property Investors. In fact this suggests we will see a spike in listings as we move into spring.
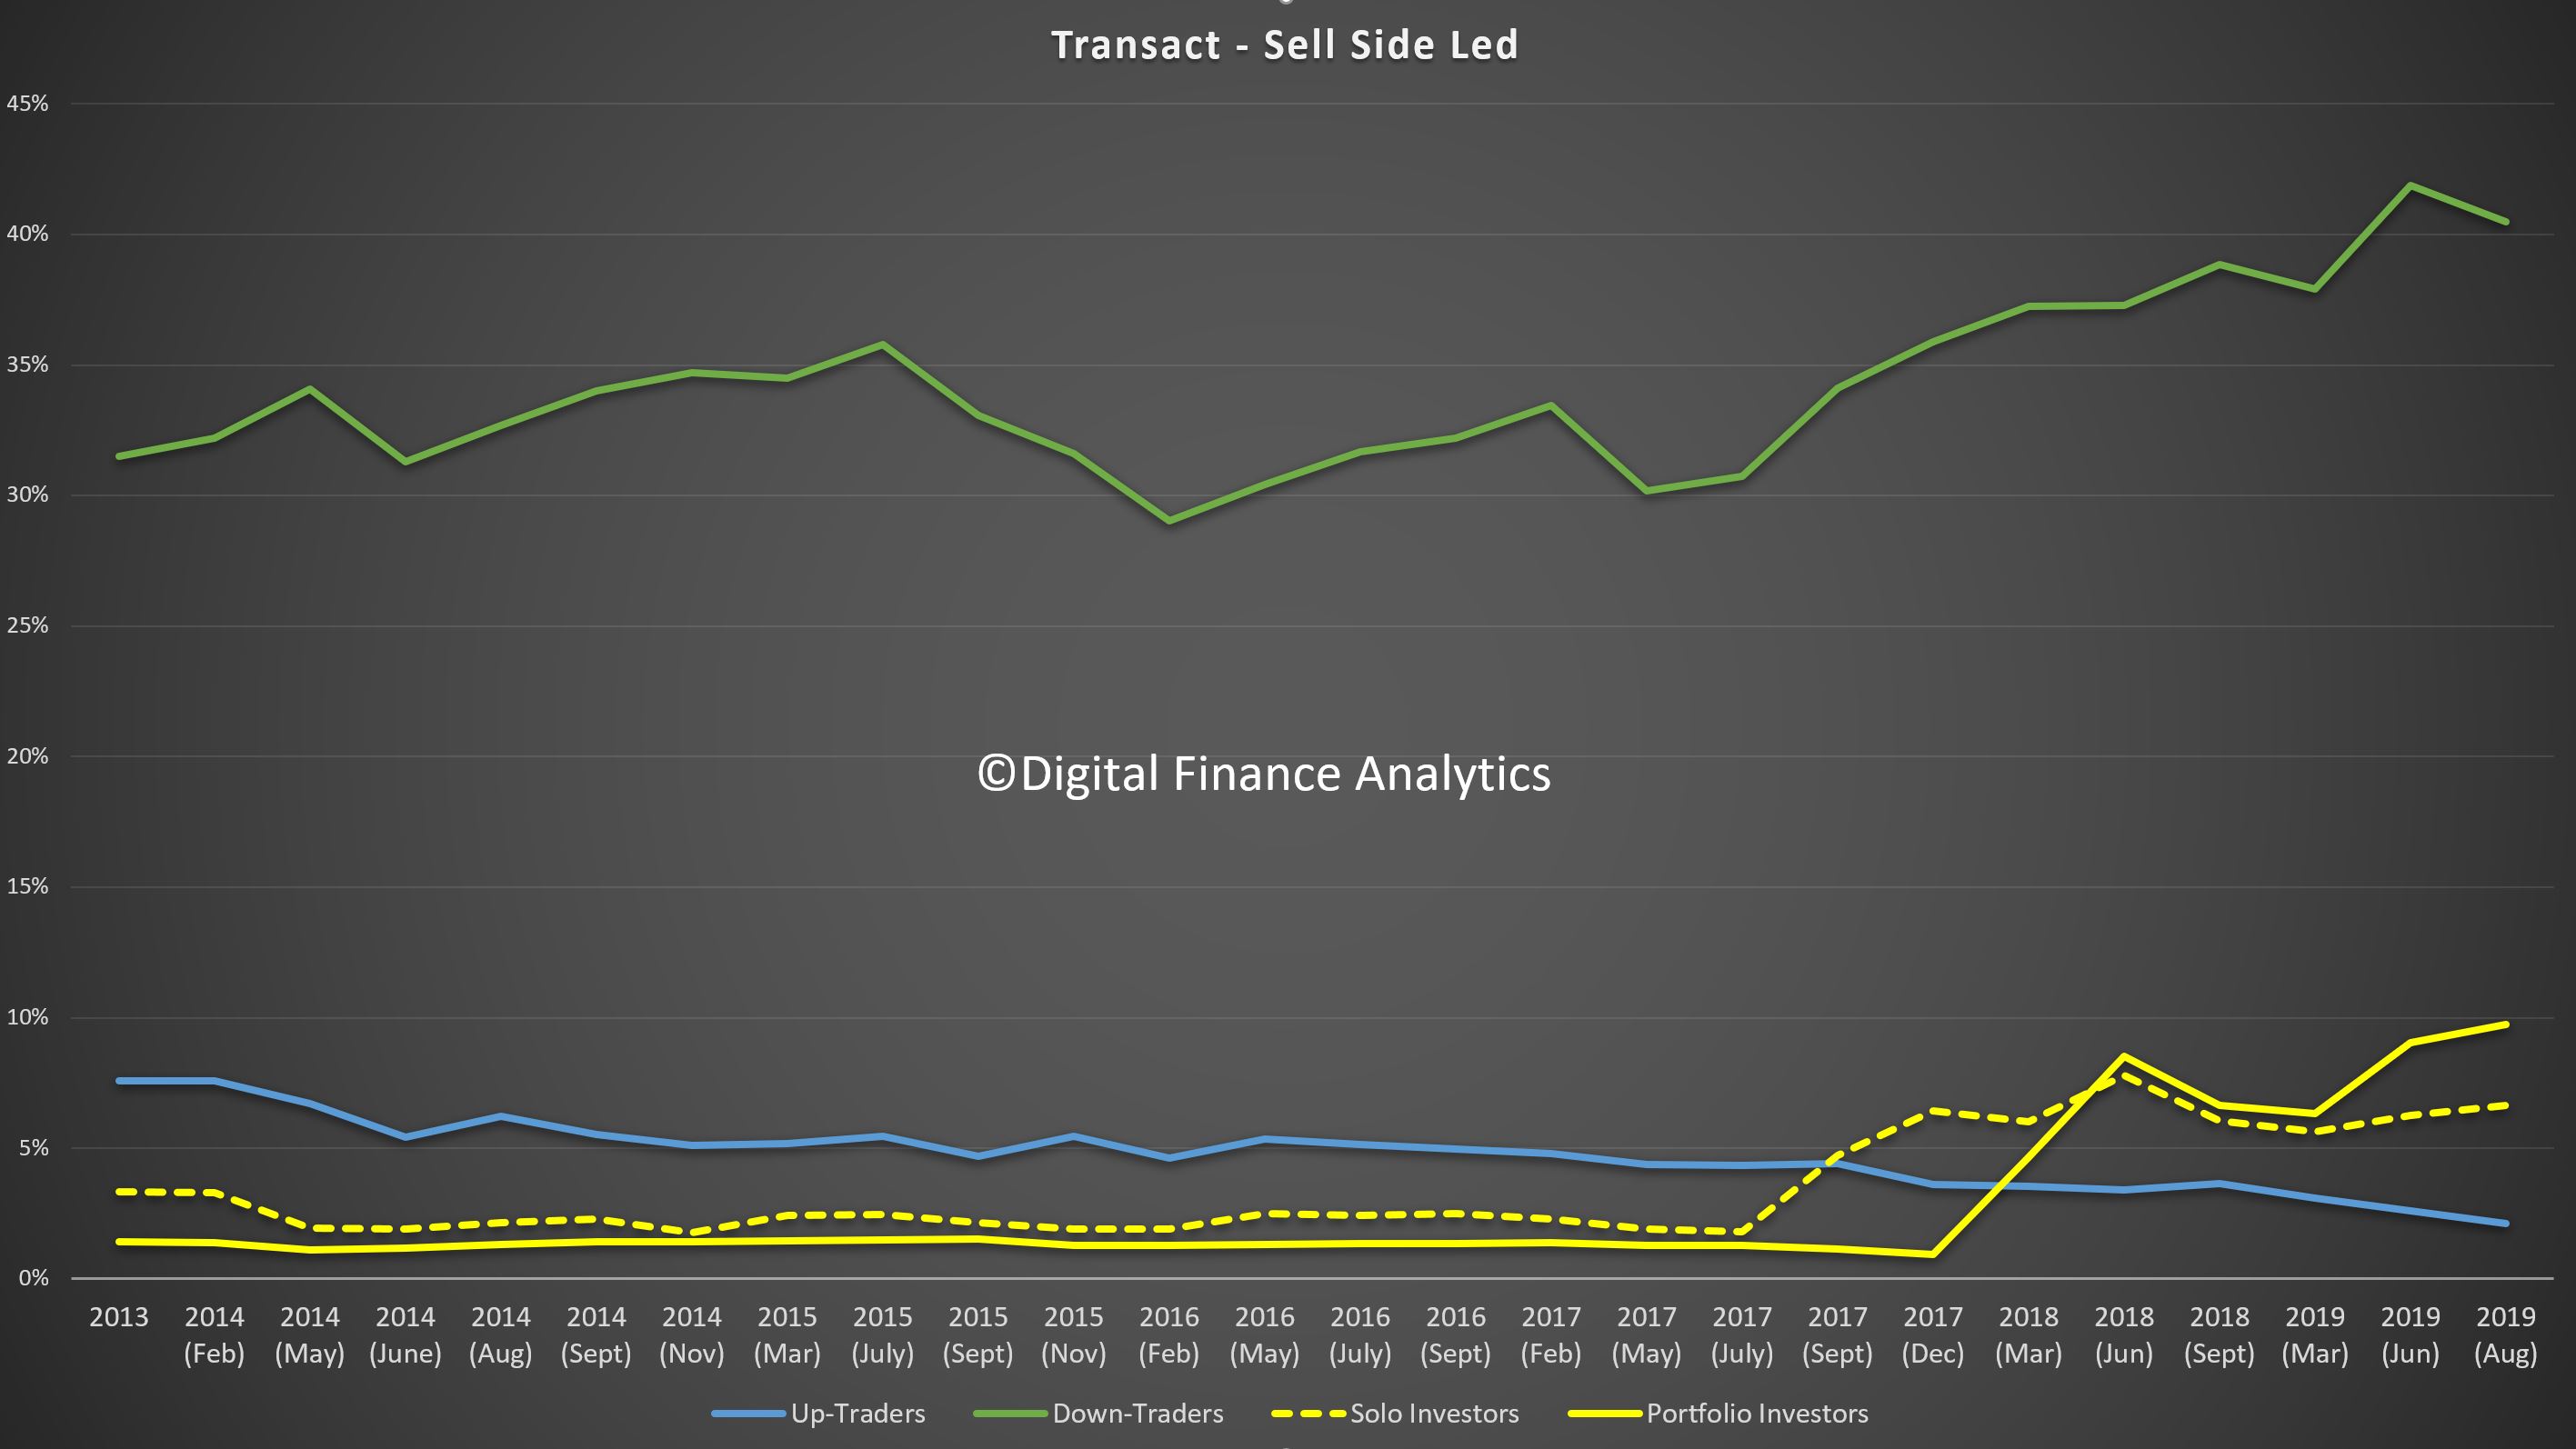
Our equilibrium model suggests that currently supply is not meeting demand (adjusted for property types and locations) in a number of prime Sydney and Melbourne locations, within 30 minutes of the CBD. But beyond that demand is below current supply, and more is coming.
On this basis, we expect to see some local price uplifts, but not a return to the rises a couple of years back. What is clear, is that the property investment sector continues to slumber, and Down Traders are getting more desperate to sell.
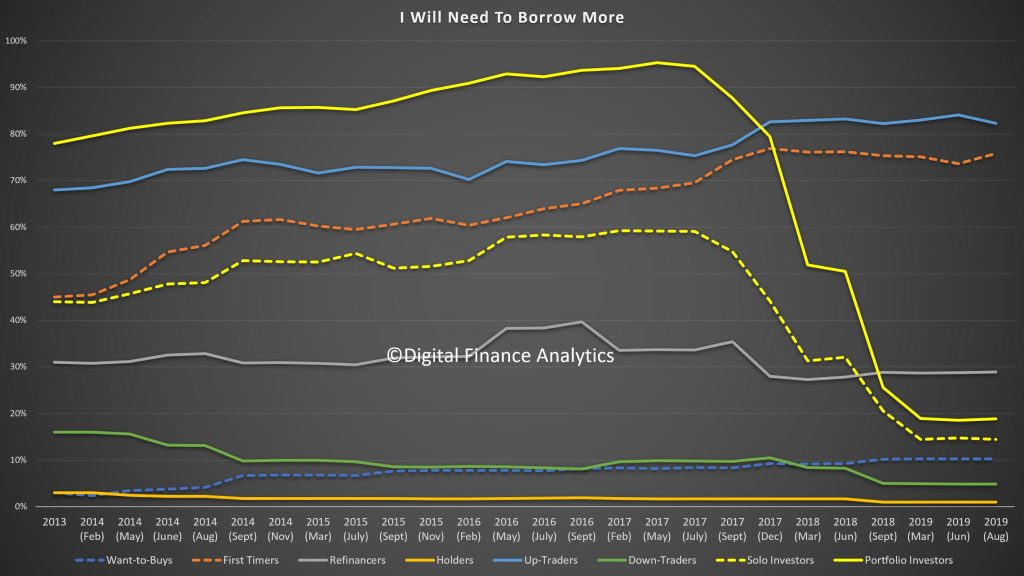
Finally, today demand for more credit is coming from Up-Traders, First Time Buyers and Refinancers. Not Investors.
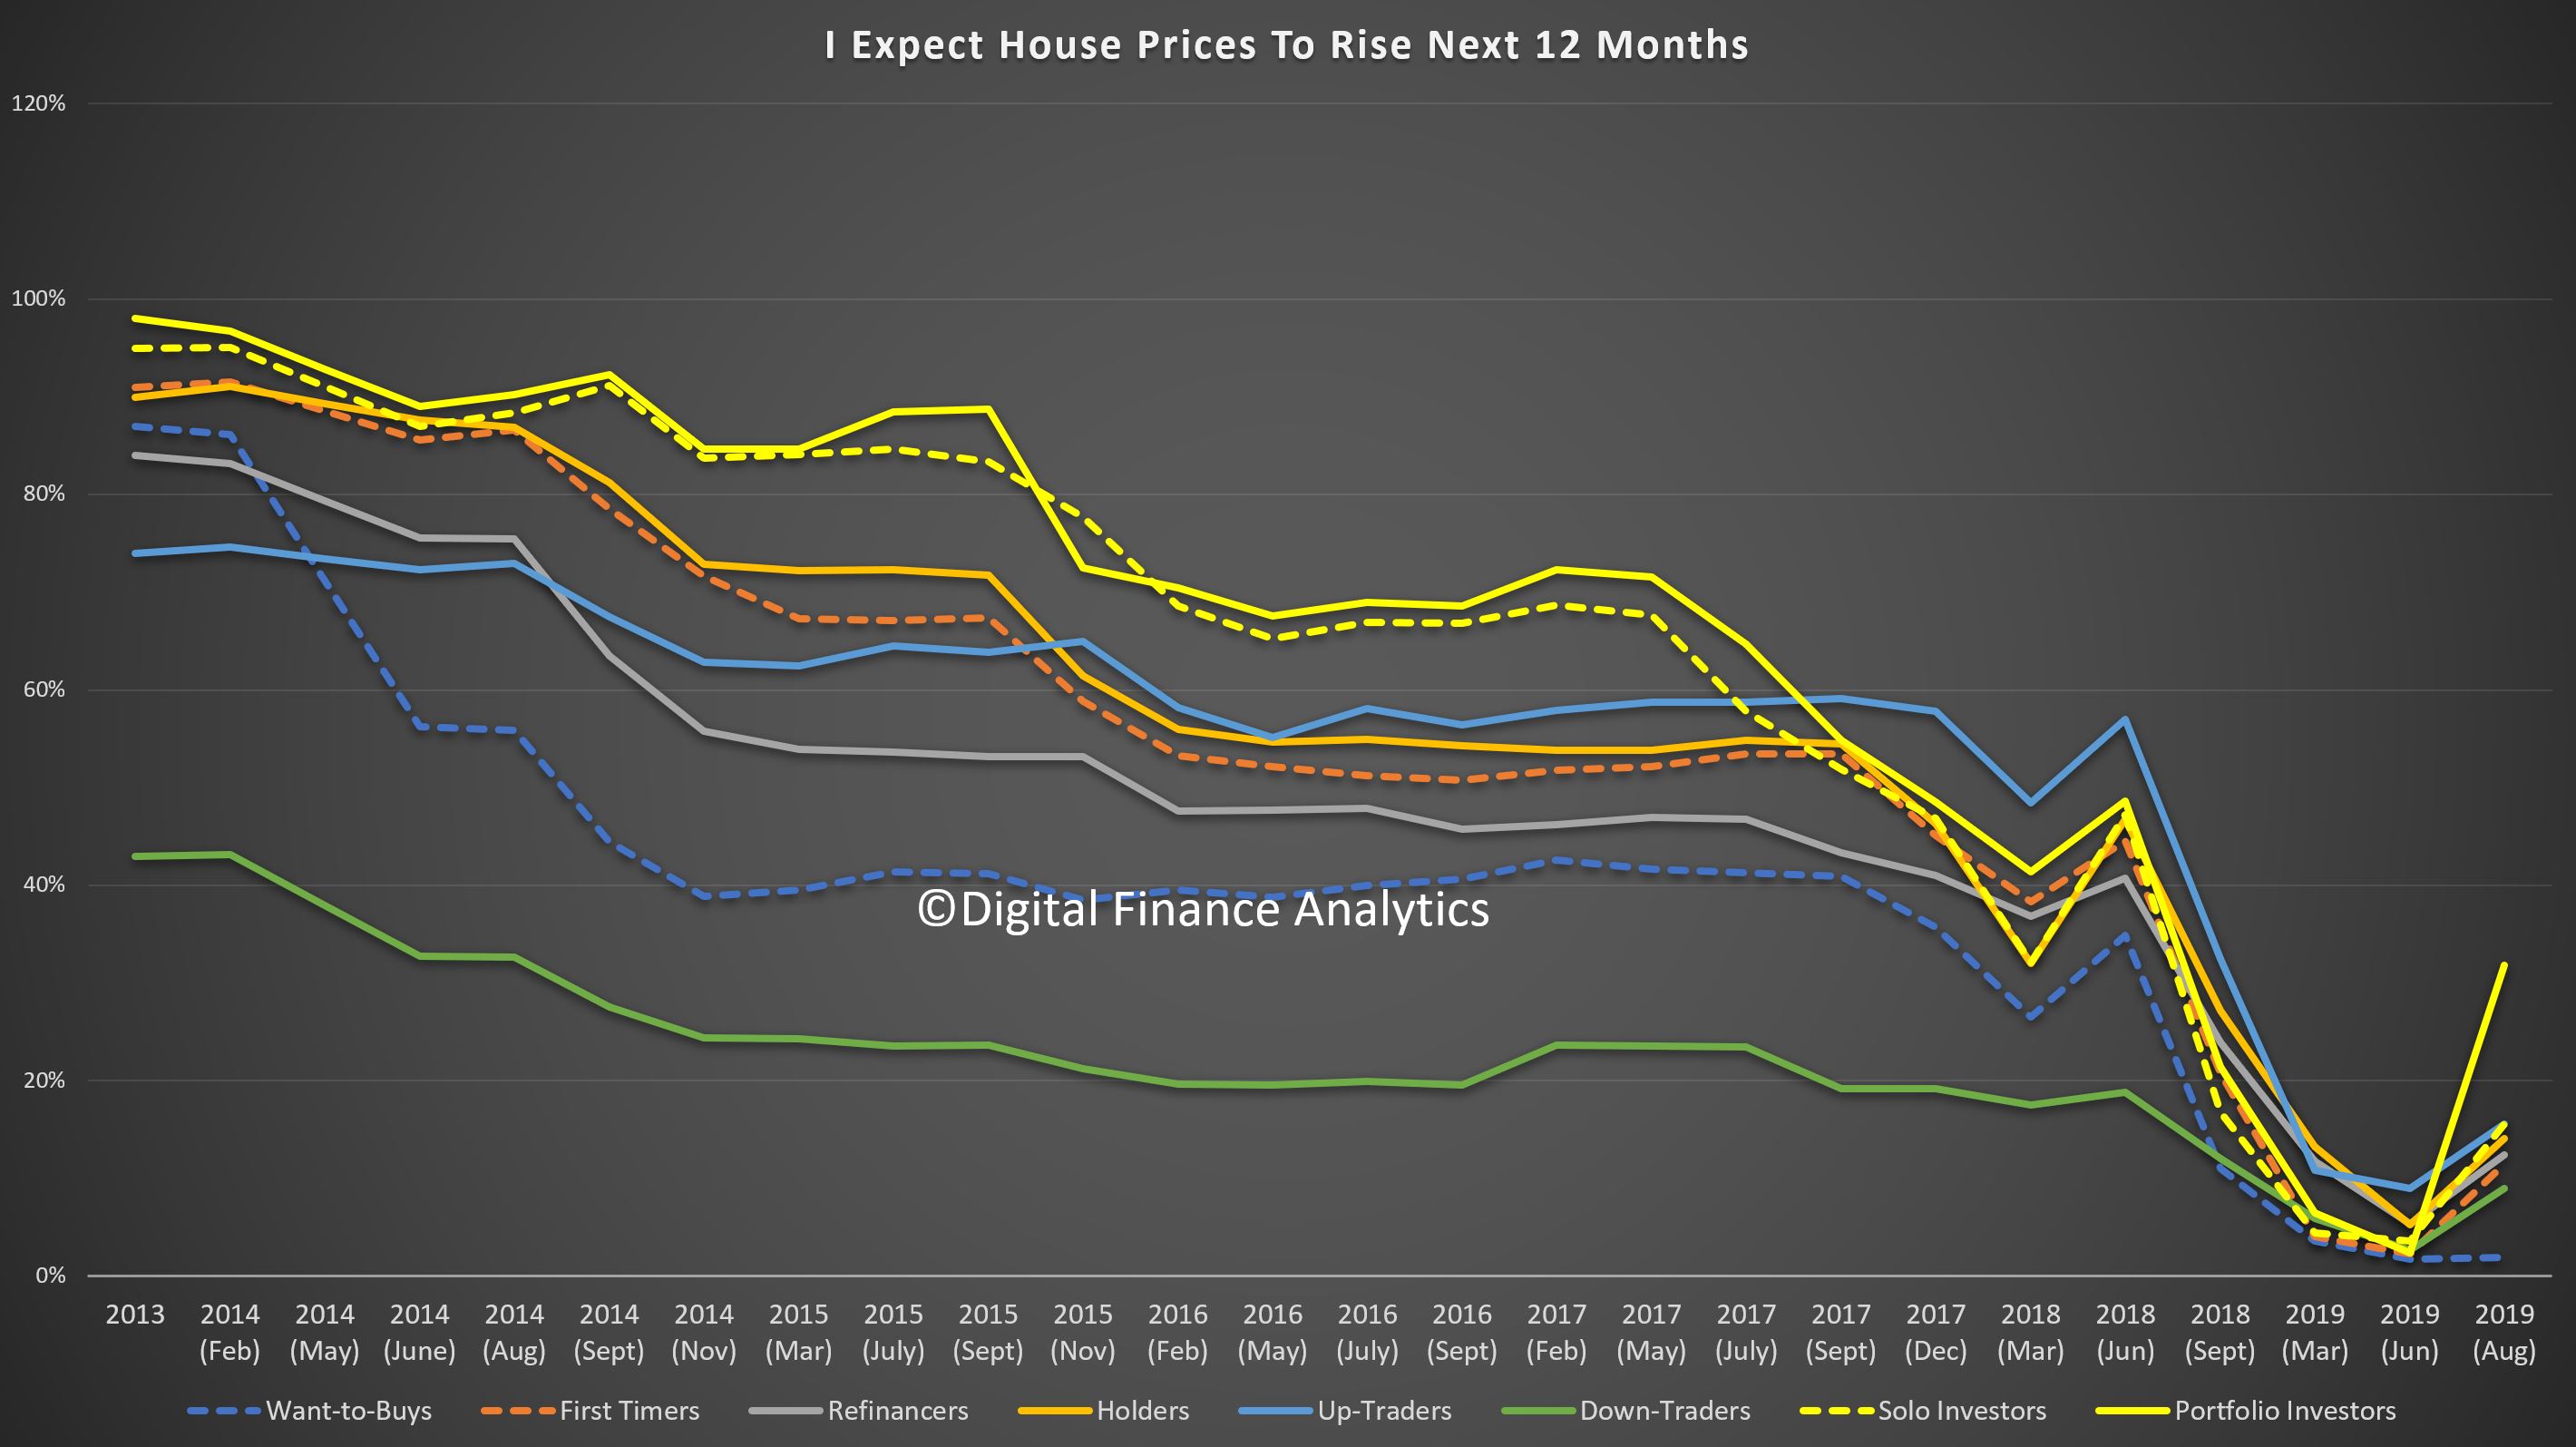
And price expectations seem to be on the improve, driven by investors. But it is still lower than a couple of years ago.
Next time we will dive into the segment specific drivers.
