
Perhaps the speed at which GDP grows relative to debt matters more than the ratio of debt to GDP. The faster GDP grows relative to debt, the lower might be the risks surrounding the repayment of debt obligations.
Expressed differently, the greater the return from debt capital, the lower should be the incidence of delinquencies, charge offs, and defaults. When productively employed, debt capital can more than pay for itself.
The U.S.’ ratio of private and public nonfinancial-sector debt has soared from 1968’s 131% to 2017’s 253% of 2017. Nevertheless, the 10-year average annualized growth of U.S. real GDP decelerated from the 4.9% of the span-ended 1968 to the 1.4% of the span-ended 2017. Over time, higher ratios of U.S. nonfinancial-sector debt to nominal GDP failed to prevent a deceleration by U.S. real GDP’s 10-year average annualized growth rate. Additional debt may have warded off hard times, but it apparently fell considerably short of lifting the underlying pace of business activity.
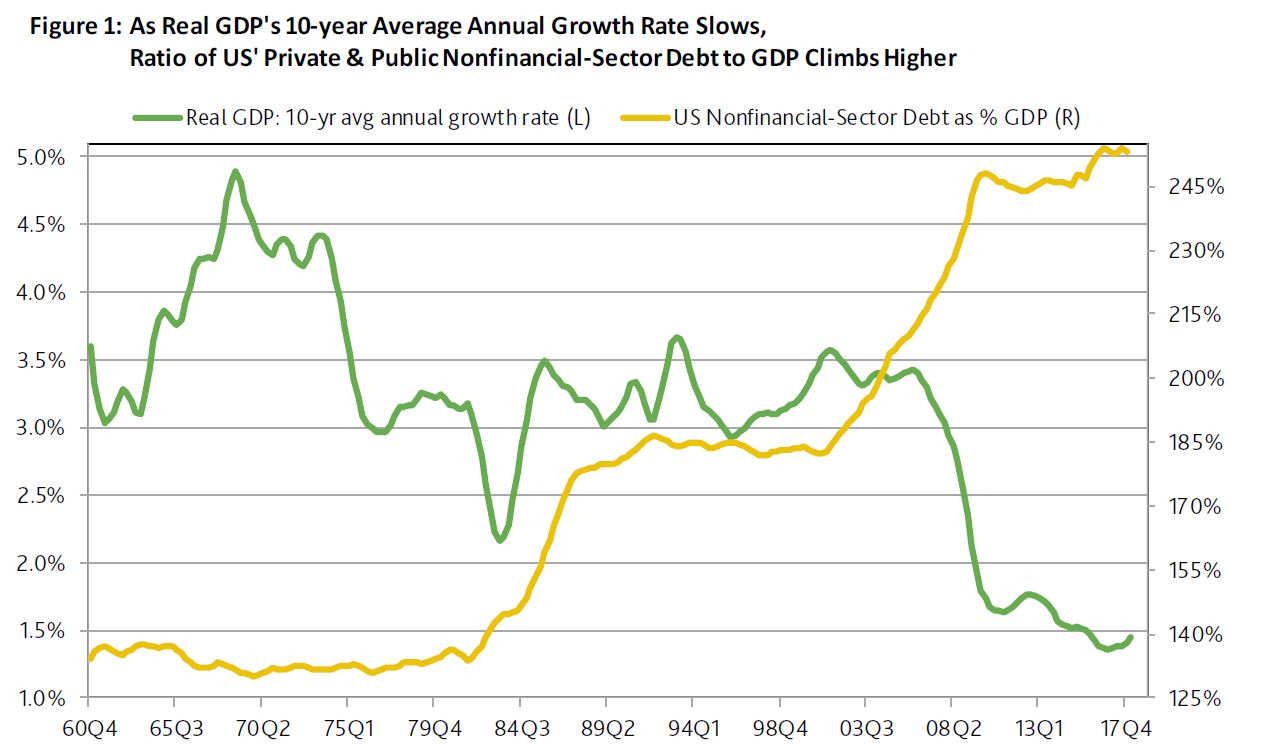
Just as the velocity of money (or the ratio of GDP to the M2 money supply) has slowed over time so has the velocity of debt (or the ratio of GDP to nonfinancial-sector debt). Today each dollar of nonfinancial-sector debt is accompanied by only $0.40 of GDP. By contrast, in 1968, each dollar of debt was joined by $0.76 of GDP. Each additional dollar of debt may now add considerably less to GDP than it did 50 years ago.
The Productivity of Debt Varies Across Business Cycle Upturns
Similar to how the relationship between M2 growth and GDP growth varies over time, the relationship between nonfinancial-sector debt growth and economic growth is far from constant. The 37% cumulative increase by nonfinancial-sector debt of the current business cycle upturn has been joined by a cumulative 38% increase in nominal GDP. In stark contrast, during the previous economic recovery of 2002-2007, the cumulative 37% increase by nominal GDP lagged far behind the 65% expansion of nonfinancial-sector debt. The imbalance of 2002-2007 reflects an excessive increase in home mortgage debt that outran personal income by enough to ultimately spark a mortgage repayment crisis.
Though 1991-2000’s upturn had the cumulative 73% increase by nominal GDP outpacing debt’s 69% increase, the high-yield default rate trended higher from 1998’s second half into the start of 2001’s recession. However, the late payment rates of household debt were relatively well behaved.
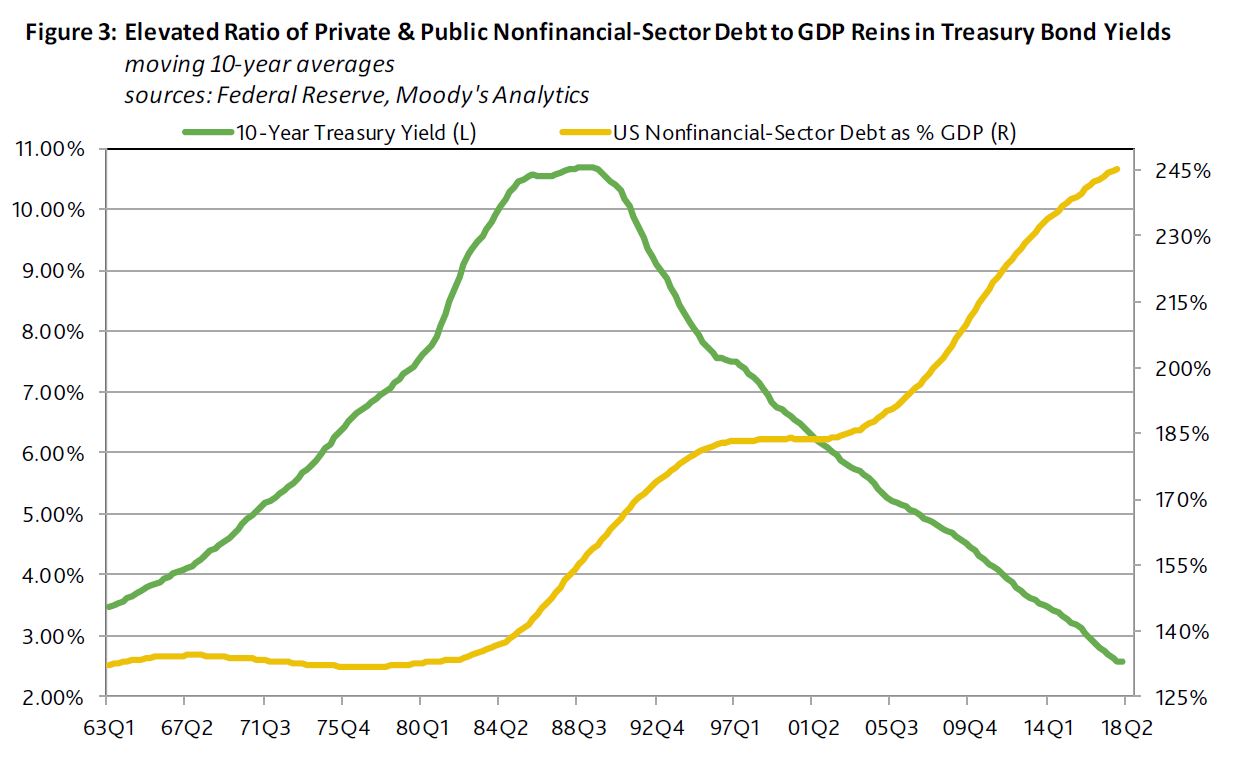
Treasury Bond Yields Decline Amid Rising Ratio of Debt to GDP
Despite how nonfinancial-sector debt moving 10-year average has increased from 1978’s 132% to 2017’s 245% of nominal GDP’s moving 10-year average, the 10-year Treasury yield’s accompanying moving 10-year average fell from 7.22% to 2.59%. The declining trend of the 10-year Treasury yield amid a rising ratio of debt to GDP seems counterintuitive. After all, shouldn’t an increase in the supply of debt relative to overall economic activity lower the price of credit market instruments and, thereby, put upward pressure on interest rates?
In all likelihood, expectations concerning core consumer price inflation and real economic growth wield more influence over interest rates than the amount of outstanding debt relative to GDP. It may be nonsensical to expect interest rates to decline as outstanding debt rises relative to GDP all else being the same. Nonetheless, a high ratio of debt to GDP may create a repayment burden that heightens the economy’s sensitivity to higher interest rates. If each percentage point increase by interest rates slows business activity more quickly as the ratio of debt to GDP climbs higher, the upside for benchmark interest rates may be lower than otherwise as an economy’s debt leverage steepens.
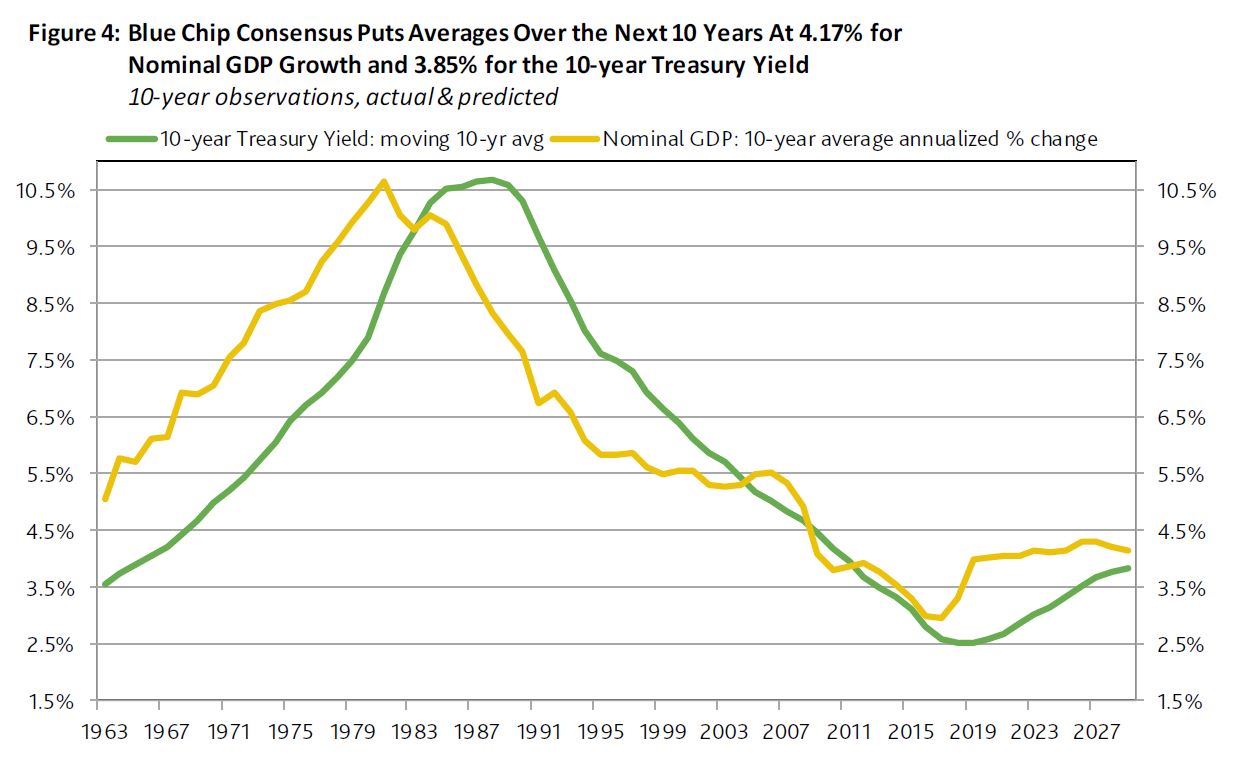
Nominal GDP’s Underlying Growth Rate Leads Treasury Bond Yields
The record shoes that the growth of nominal GDP tends to lead the path taken by the 10-year Treasury yield. When nominal GDP’s 10-year average annualized growth rate accelerated from the 5.1% of the span-ended 1963 to its 10.6% zenith of the span-ended 1981, the 10-year Treasury yield’s moving 10-year average would increase from 1963’s 3.56% to 1981’s 8.69% and would not crest until reaching the10.69% of 1988.
Note how nominal GDP’s 10-year average annualized growth rate exceeded the 10-year Treasury yield’s moving 10-year average through 1981. Thus, there is no guarantee that the 10-year Treasury yield will be equal to or greater than nominal GDP growth.
By 1988, the 10-year average annualized growth rate of nominal GDP had slowed to 8.3%. A subsequent deceleration by nominal GDP’s 10-year annualized growth rate to 2017’s 3.0% was joined by a drop for the moving 10-year average of the 10-year Treasury to 2017’s 2.59%.
According to the recent trend and the latest Blue Chip consensus forecasts, nominal GDP’s 10-year average annual growth rate bottomed in 2017 and is likely to rise to 3.3% in 2018. Thereafter, the 10-year growth rate is expected to inch higher until peaking at the 4.3% of the span-ended 2027. By 2027, the 10-year Treasury yield’s moving 10-year average is expected to have reached 3.69% and is projected to extend its climb to 3.85% by 2029.
Apparently, the Treasury bond yield forecasts of the Blue Chip consensus make no allowance for the likelihood of a recession by 2029. After climbing up from 2017’s 2.33% to 3.0% in 2018 and 3.4% in 2019, the consensus has the 10-year Treasury yield remaining at 3.8% from 2020 through 2024 and then averaging 3.9% during 2025 through 2029. To the contrary, when the next recession arrives most likely well before 2029, the benchmark Treasury bond yield will probably temporarily sink under 2%.
Federal Debt Accelerates as Debt Growth Elsewhere Is Unchanged
On June 7, the Federal Reserve released its first-quarter 2018 estimates of outstanding private and public nonfinancial-sector debt via the Financial Accounts of the United States. In a manner that helps to explain 2018’s upswing by interest rates, the year-to-year growth rate of the U.S.’ private and public nonfinancial-sector debt quickened from Q1-2017’s 3.7% to Q1-2018’s 5.1%. However, that acceleration was the offshoot of a jump by the annual increase of U.S. government debt from Q1-2017’s 3.3% to Q1-2018’s 7.4%. The remaining nonfinancial-sector debt grew by 3.9% yearly for both Q1-2017 and Q1-2018.
The year-to-year growth rate for U.S. nonfinancial-corporate debt edged higher from Q1-2017 5.0% to Q1-2018’s 5.2%. First-quarter 2018’s $5.426 trillion of outstanding U.S. nonfinancial-corporate bonds increased by 4.3% annually, while the $5.396 trillion of outstanding nonfinancial-corporate debt excluding bonds and mortgages advanced by 7.1% annually. In 2017’s first quarter, the annual increases were nearly identical at 5.2% for bonds and 5.3% for debt excluding bonds and mortgages.
The simultaneous slowing of bond growth and acceleration by the outstandings of variable-rate business loans and commercial paper suggest companies do not expect an extended and large increase by benchmark Treasury bond yields.
The much faster growth of Treasury debt vis-a-vis corporate bonds helps to explain why the average 10-year Treasury yield jumped up from Q1-2017’s 2.44% to Q1-2018’s 2.76%, while corporate bond yieldspreads over Treasuries narrowed from 167 bp to 153 bp for the long-term Baa industrial company bonds and from 397 bp to 353 bp for high-yield bonds.