On the last working day of each month the RBA releases their Credit Aggregates and APRA their Monthly Banking Statistics for ADS‘s. Both are now out for March.
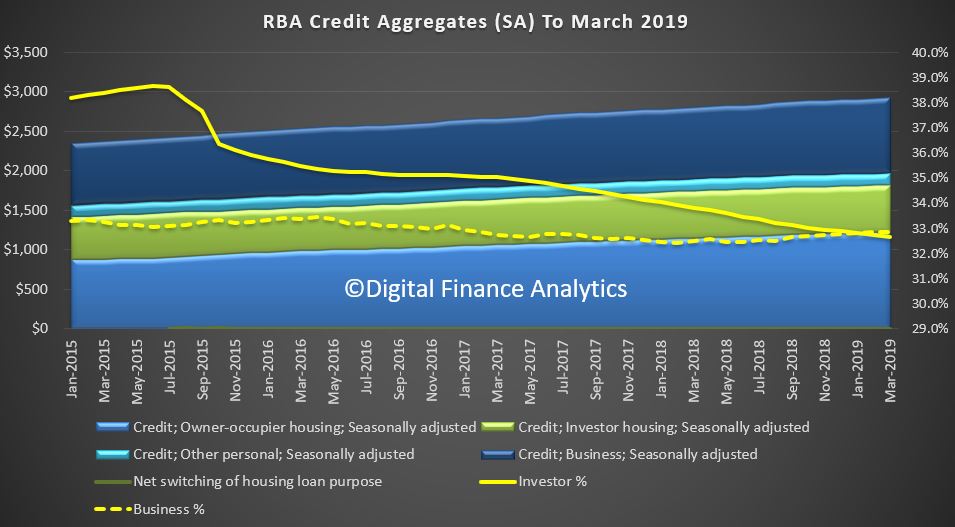
The headline news is the overall housing credit is up, to a new record of $1.82 trillion dollars up 0.31% from last month, or 0.31%. Within that owner occupied lending rose 0.32% to $1.22 trillion dollars and investment lending was flat. 32.7% of lending stock is for investment lending purposes, a slight fall from last month, whilst business lending as a proportion of all lending rose from 32.9% from 32.8% to reach $963.7 billion dollars. Personal credit fell 0.27% or $0.4 billion, to $147.1 billion, and continues to fall.
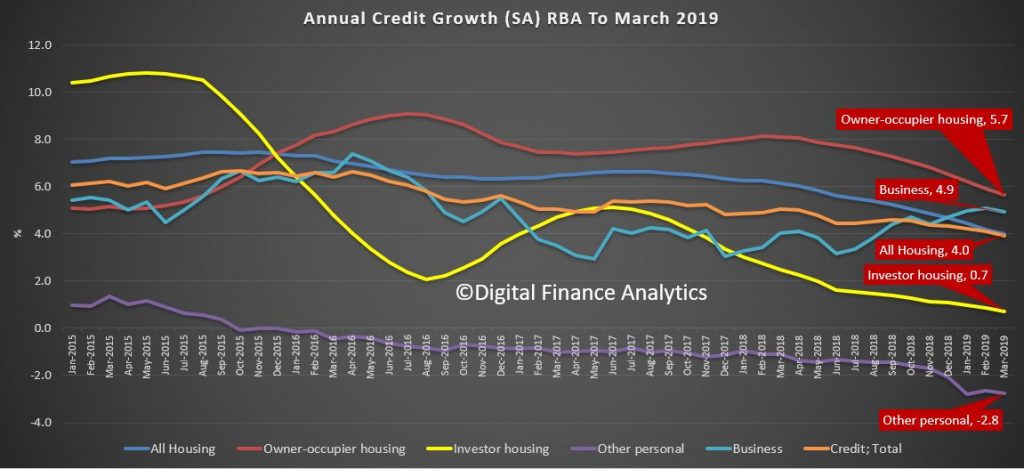
The annualised movements by category shows further weakness, with lending for owner occupied housing now at 5.7%, investment housing lending at 0.7%, giving housing overall growth of just 4% (though still higher than wages growth I would add). Personal credit fell 2.8% over the past year, while business lending rose 4.9% annualised. All these figures are on a seasonally adjusted basis
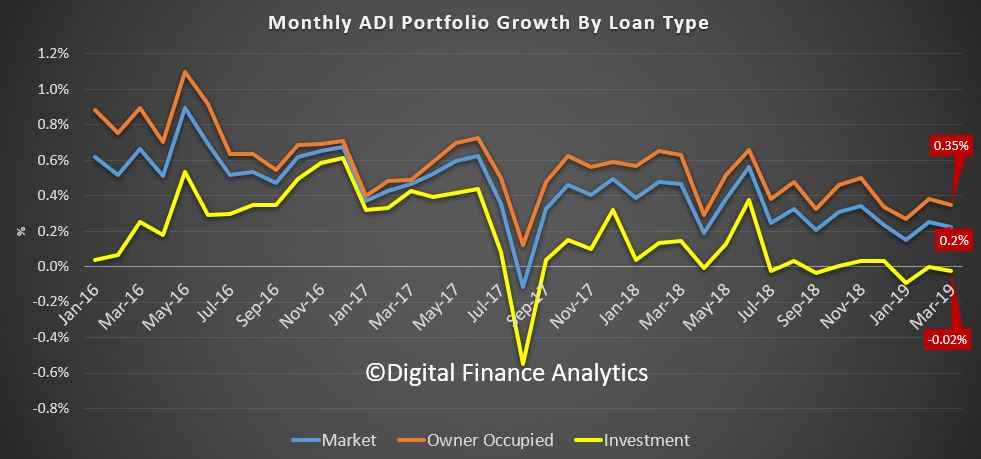
Turning to the APRA data on the banks, owner occupied lending rose 0.35% in March, while investment lending fell by 0.02%, giving total credit growth of just 0.2%. Over the past year owner occupied loans grew by 4.8% (compared with 5.7% at the aggregate level) and investor loans grew 0.4% (compared with 0.7% at the aggregate level). So the banks loan portfolios are growing more slowly than the market.
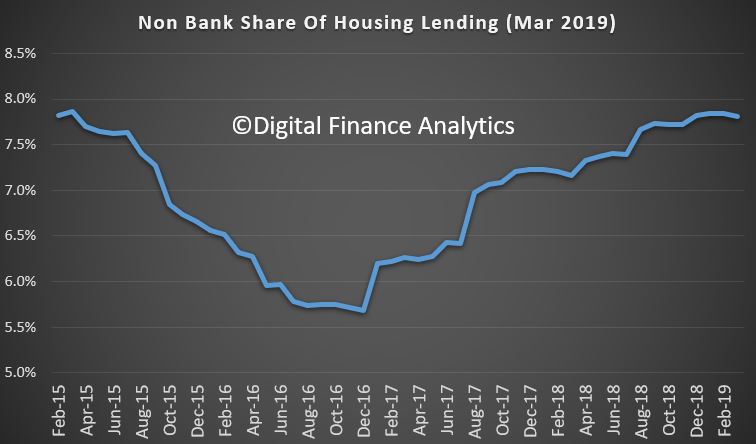
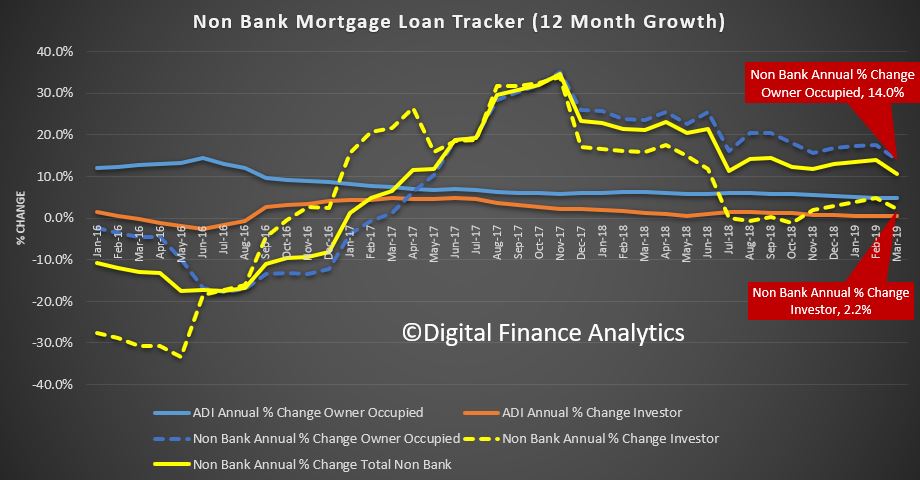
This can be illustrated by comparing the RBA and APRA data (warts and all) to show the non-bank sector is growing faster than the banks. Overall, they have over 7.5% of the market, which is up from the low in December 2016.
In addition, the rate of growth is significantly higher than the banks. Non-bank owner occupied loans are growing at an annual rate of 14%, while investment loans are 2.2%; both significantly higher than the ADI’s. Non-banks have weaker regulation, and more ability to lend. APRA has yet to truly engage with the sector.
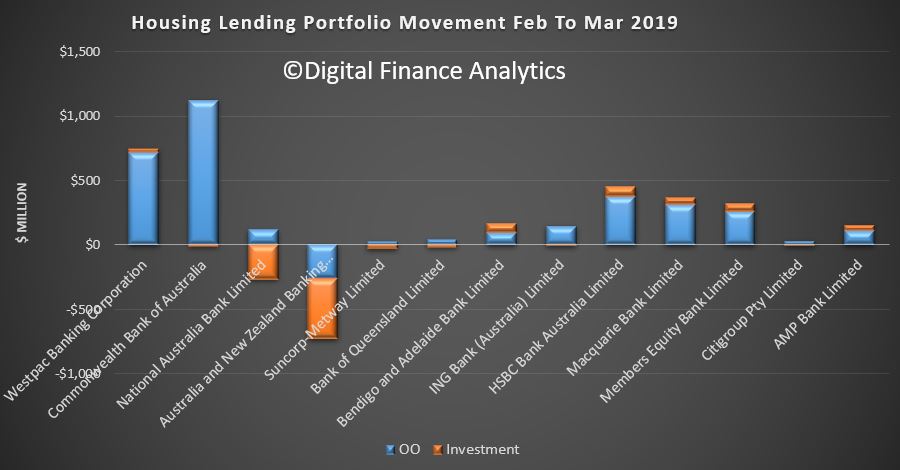
Turning back to the individual lenders, the changes in their portfolios over the month show that Westpac and CBA offered the most new owner occupied loans, while ANZ dropped back, on both owner occupied and investment loans, while NAB dropped investment lending. HSBC, Macquarie and Member Equity Bank (ME) lend more than the regionals.
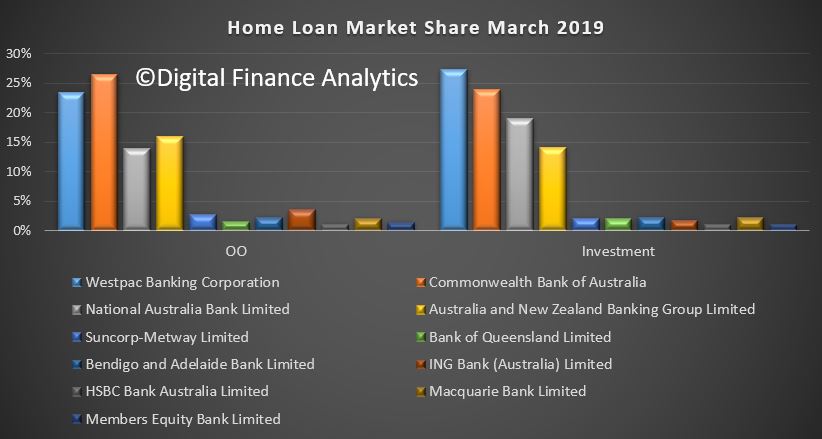
Overall market shares hardly moved, with CBA still the largest owner occupied lending, and Westpac the biggest investor lender.
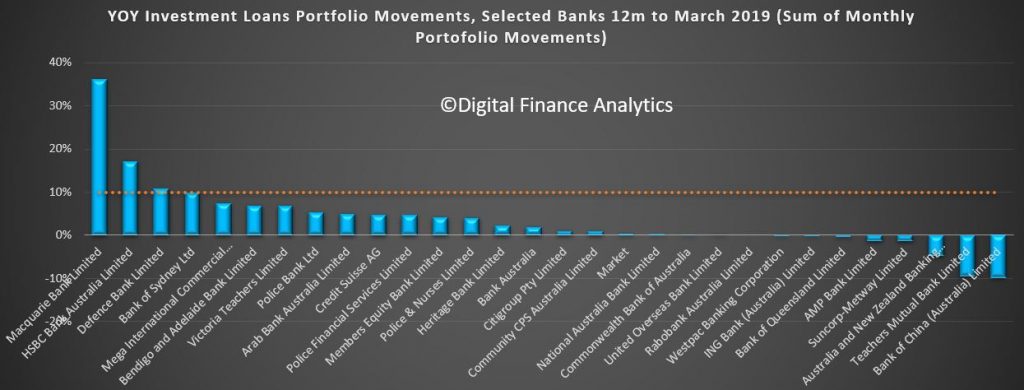
Investment lending growth over the past 12 months has been anemic, but some lenders such as Macquarie are making hay. Of course the old 10% speed limit from APRA has gone now, but the relative growth highlights the fact that the four majors are well below market growth levels – and ANZ the weakest (which is why they said they wanted to lend more).
So finally, the total ADI lending book is at $1.68 trillion dollars, with owner occupied loans comprising $1.12 trillion dollars and investment loans $557 billion dollars, and comprising 33.2% of the portfolio – as the ratio continues to fall.
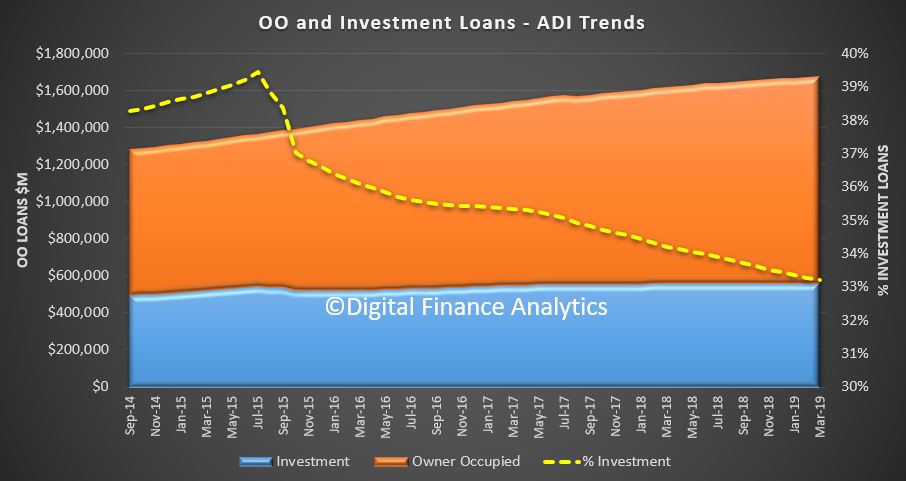
In conclusion, the credit impulse – the rate of change of credit being written is the most significant forward indicator of house price trajectory. The weak state of the market suggests more and significant price falls ahead. Yet despite all this, household debt will continue to rise. There is absolutely no reason to loosen lending requirements, or drop the hurdle rate on these numbers. More households will get into trouble ahead.
